Oklahoma City, OK Investment Properties for Sale
Browse homes for sale and investment properties in Oklahoma City, OK. Refine your search by price, property type, or more.
Best cash flowing properties in Oklahoma City, OK
Active
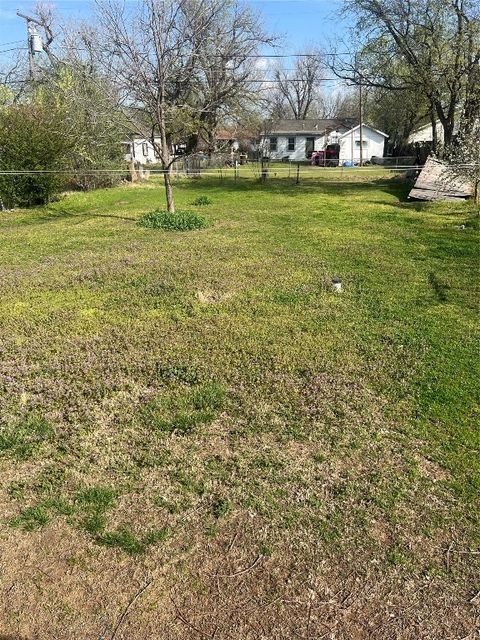
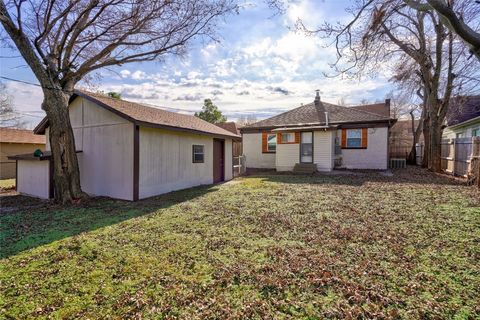
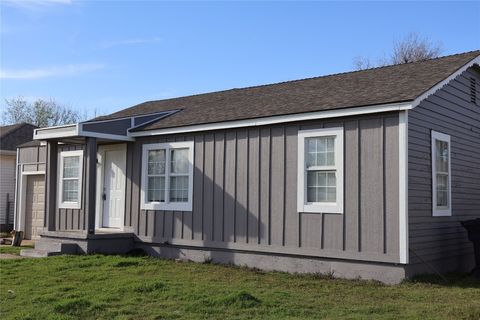
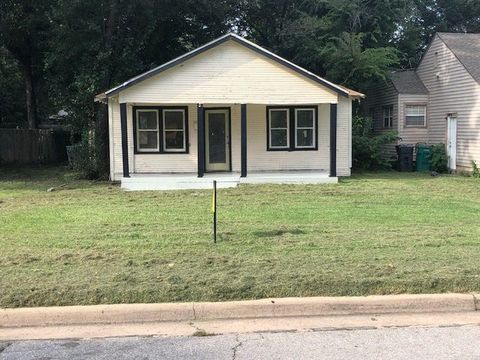
$79,900
3
bds
|
1
ba
|
0
sqft
|
built
1951
2815 SW 39th St, Oklahoma City, OK 73119
$300
Cash flow
19.6%
Cash-on-Cash Return
10.2%
Cap rate
1.3%
Rent to Value Ratio

Active
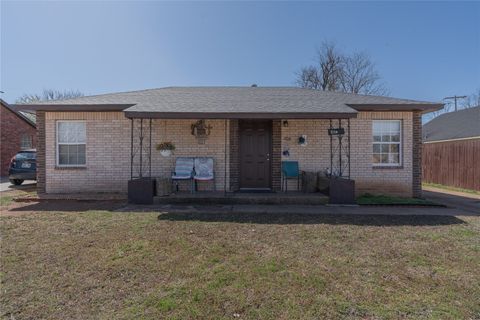
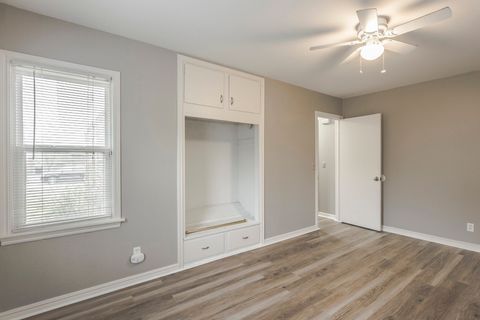
$145,000
3
bds
|
2
ba
|
0
sqft
|
built
1910
1823 NW 8th St, Oklahoma City, OK 73106
$232
Cash flow
8.3%
Cash-on-Cash Return
7.6%
Cap rate
1.0%
Rent to Value Ratio
1,417 out of 1,794 properties for sale in Oklahoma City, OK
Limited Results Shown
Create a free account, or log in to reveal all property listings and enjoy the complete experience.
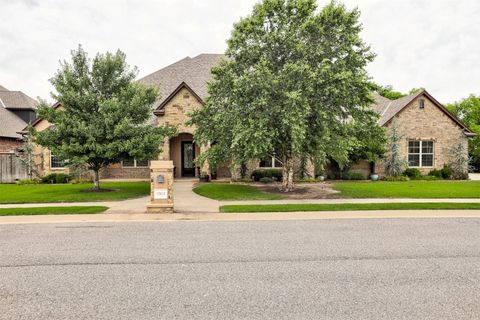
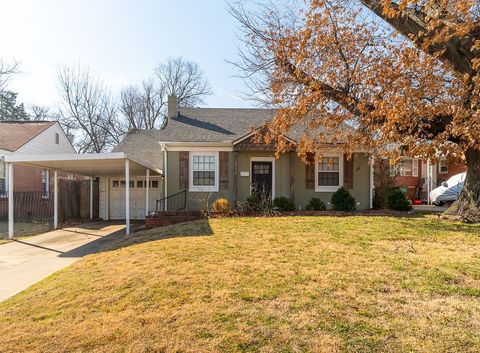
Active
$175,000
2
bds
|
1
ba
|
0
sqft
|
built
1951
1116 SE 19th St, Oklahoma City, OK 73129
$-126
Cash flow
-3.8%
Cash-on-Cash Return
4.8%
Cap rate
0.7%
Rent to Value Ratio
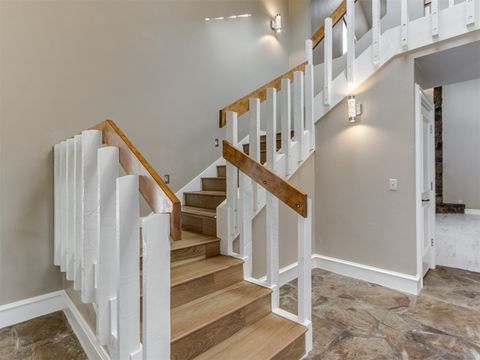
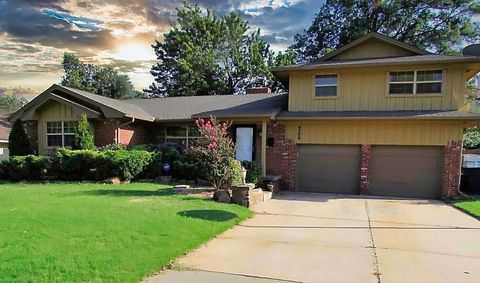
Active
$279,000
4
bds
|
2
ba
|
0
sqft
|
built
1973
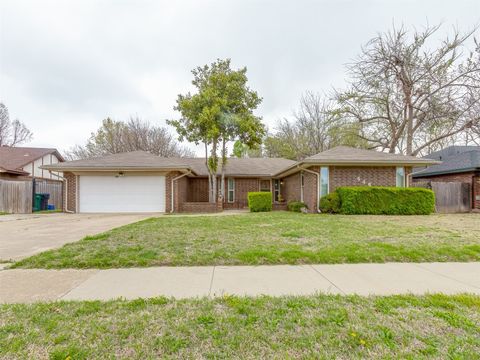
10212 Little Pond Dr, Oklahoma City, OK 73162
$-280
Cash flow
-5.2%
Cash-on-Cash Return
4.5%
Cap rate
0.6%
Rent to Value Ratio
Active
$267,900
4
bds
|
2
ba
|
0
sqft
|
built
1935
2421 NW 18th St, Oklahoma City, OK 73107
$-332
Cash flow
-6.5%
Cash-on-Cash Return
4.2%
Cap rate
0.6%
Rent to Value Ratio
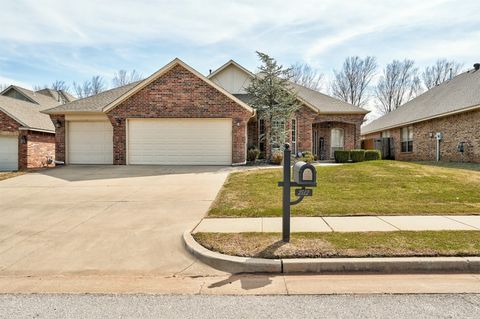
Active
$245,900
3
bds
|
2
ba
|
0
sqft
|
built
1973
449 SW 99th St, Oklahoma City, OK 73139
$-269
Cash flow
-5.7%
Cash-on-Cash Return
4.4%
Cap rate
0.7%
Rent to Value Ratio
Active
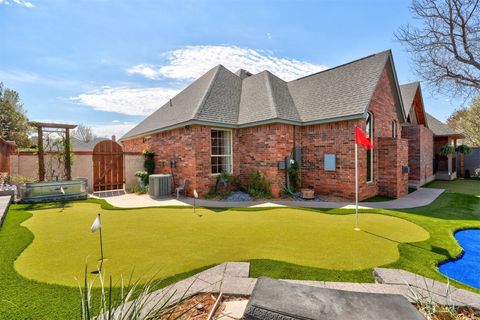
$750,000
4
bds
|
3
ba
|
0
sqft
|
built
2002
3117 Birch Bark Ln, Oklahoma City, OK 73120
$-1,784
Cash flow
-12.4%
Cash-on-Cash Return
2.8%
Cap rate
0.4%
Rent to Value Ratio
Active
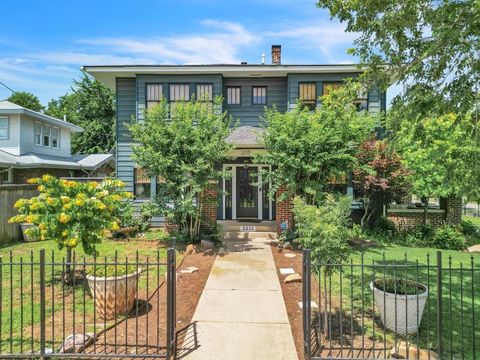
$549,000
3
bds
|
3
ba
|
0
sqft
|
built
1917
2215 N Shartel Ave, Oklahoma City, OK 73103
$-586
Cash flow
-5.6%
Cash-on-Cash Return
4.4%
Cap rate
0.6%
Rent to Value Ratio
Active
$645,000
3
bds
|
3
ba
|
0
sqft
|
built
1973
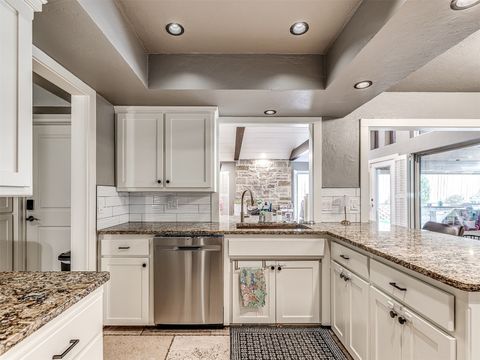
12924 Cedar Springs Rd, Oklahoma City, OK 73120
$-1,105
Cash flow
-8.9%
Cash-on-Cash Return
3.6%
Cap rate
0.6%
Rent to Value Ratio
Active
$327,500
3
bds
|
2
ba
|
0
sqft
|
built
1928
2765 NW 20th St, Oklahoma City, OK 73107
$-61
Cash flow
-1.0%
Cash-on-Cash Return
5.5%
Cap rate
0.8%
Rent to Value Ratio
Active
$195,000
2
bds
|
1
ba
|
0
sqft
|
built
1949
2757 Lancaster Ln, Oklahoma City, OK 73116
$-96
Cash flow
-2.6%
Cash-on-Cash Return
5.1%
Cap rate
0.7%
Rent to Value Ratio
Active
$699,900
3
bds
|
4
ba
|
0
sqft
|
built
2015
12613 Shenandoah Dr, Oklahoma City, OK 73173
$-1,486
Cash flow
-11.1%
Cash-on-Cash Return
3.1%
Cap rate
0.6%
Rent to Value Ratio
Active
$655,000
5
bds
|
4
ba
|
0
sqft
|
built
1976
3001 Raintree Rd, Oklahoma City, OK 73120
$-511
Cash flow
-4.1%
Cash-on-Cash Return
4.7%
Cap rate
0.7%
Rent to Value Ratio
Active
$170,000
4
bds
|
1
ba
|
0
sqft
|
built
1952
3205 SW 49th St, Oklahoma City, OK 73119
$-172
Cash flow
-5.3%
Cash-on-Cash Return
4.5%
Cap rate
0.6%
Rent to Value Ratio
Active
$389,900
4
bds
|
3
ba
|
0
sqft
|
built
2003
5405 NW 122nd Ter, Oklahoma City, OK 73162
$-493
Cash flow
-6.6%
Cash-on-Cash Return
4.2%
Cap rate
0.6%
Rent to Value Ratio
Active
$145,000
2
bds
|
1
ba
|
0
sqft
|
built
1949
3232 SW 20th St, Oklahoma City, OK 73108
$101
Cash flow
3.6%
Cash-on-Cash Return
6.5%
Cap rate
0.8%
Rent to Value Ratio
Active
$200,000
3
bds
|
2
ba
|
0
sqft
|
built
1955
1800 N Ann Arbor Ave, Oklahoma City, OK 73127
$49
Cash flow
1.3%
Cash-on-Cash Return
6.0%
Cap rate
0.8%
Rent to Value Ratio
Active
$79,900
3
bds
|
1
ba
|
0
sqft
|
built
1951
2815 SW 39th St, Oklahoma City, OK 73119
$300
Cash flow
19.6%
Cash-on-Cash Return
10.2%
Cap rate
1.3%
Rent to Value Ratio
Active
$293,500
4
bds
|
2
ba
|
0
sqft
|
built
1976
6620 Whitehall Dr, Oklahoma City, OK 73132
$-235
Cash flow
-4.2%
Cash-on-Cash Return
4.7%
Cap rate
0.7%
Rent to Value Ratio
Active
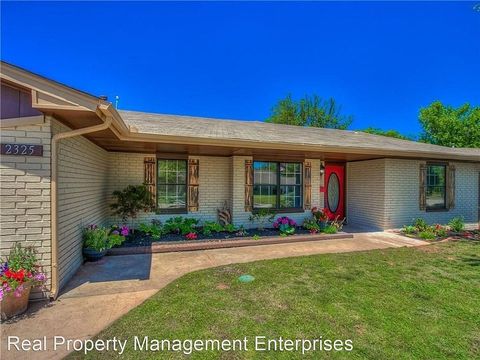
$350,000
4
bds
|
3
ba
|
0
sqft
|
built
1972
2325 NW 119th St, Oklahoma City, OK 73120
$-373
Cash flow
-5.6%
Cash-on-Cash Return
4.4%
Cap rate
0.7%
Rent to Value Ratio
Active
$264,900
3
bds
|
2
ba
|
0
sqft
|
built
1959
2821 Kerry Ln, Oklahoma City, OK 73120
$-191
Cash flow
-3.8%
Cash-on-Cash Return
4.8%
Cap rate
0.7%
Rent to Value Ratio
Active
$200,000
3
bds
|
3
ba
|
0
sqft
|
built
1940
3513 NW 16th St, Oklahoma City, OK 73107
$22
Cash flow
0.6%
Cash-on-Cash Return
5.8%
Cap rate
0.8%
Rent to Value Ratio
Active
$242,000
3
bds
|
2
ba
|
0
sqft
|
built
1939
3112 NW 27th St, Oklahoma City, OK 73107
$-319
Cash flow
-6.9%
Cash-on-Cash Return
4.1%
Cap rate
0.7%
Rent to Value Ratio
Active
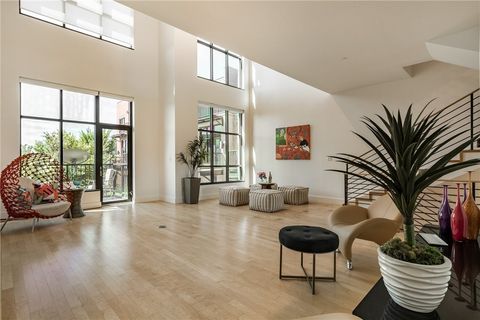
$615,000
2
bds
|
3
ba
|
0
sqft
|
built
2008
245 NE 4th St, Oklahoma City, OK 73104
$-2,095
Cash flow
-17.8%
Cash-on-Cash Return
1.6%
Cap rate
0.5%
Rent to Value Ratio
Active
$215,000
3
bds
|
3
ba
|
0
sqft
|
built
1963
4700 NW 59th Ter, Oklahoma City, OK 73122
$3
Cash flow
0.1%
Cash-on-Cash Return
5.7%
Cap rate
0.7%
Rent to Value Ratio

Active
$595,000
2
bds
|
3
ba
|
0
sqft
|
built
1975
6448 Brandywine Ln, Oklahoma City, OK 73116
$-930
Cash flow
-8.2%
Cash-on-Cash Return
3.8%
Cap rate
0.7%
Rent to Value Ratio
Active
$340,000
3
bds
|
2
ba
|
0
sqft
|
built
2009
2512 SW 141st St, Oklahoma City, OK 73170
$-317
Cash flow
-4.9%
Cash-on-Cash Return
4.6%
Cap rate
0.7%
Rent to Value Ratio
Active
$373,000
3
bds
|
3
ba
|
0
sqft
|
built
2005
12300 Maiden Ln, Oklahoma City, OK 73142
$-614
Cash flow
-8.6%
Cash-on-Cash Return
3.7%
Cap rate
0.7%
Rent to Value Ratio
Active
$182,900
2
bds
|
1
ba
|
0
sqft
|
built
1923
1521 N Pennsylvania Ave, Oklahoma City, OK 73107
$-100
Cash flow
-2.9%
Cash-on-Cash Return
5.0%
Cap rate
0.8%
Rent to Value Ratio
Active
$124,500
2
bds
|
1
ba
|
0
sqft
|
built
1930
2921 NW 12th St, Oklahoma City, OK 73107
$89
Cash flow
3.7%
Cash-on-Cash Return
6.5%
Cap rate
0.9%
Rent to Value Ratio
Active
$289,000
4
bds
|
2
ba
|
0
sqft
|
built
1973
10908 Creekvale Rd, Oklahoma City, OK 73165
$39
Cash flow
0.7%
Cash-on-Cash Return
5.8%
Cap rate
0.8%
Rent to Value Ratio

Active
$499,000
3
bds
|
4
ba
|
0
sqft
|
built
2002
3113 Hickory Sign Post Rd, Oklahoma City, OK 73116
$-936
Cash flow
-9.8%
Cash-on-Cash Return
3.4%
Cap rate
0.6%
Rent to Value Ratio
Active
$145,000
3
bds
|
2
ba
|
0
sqft
|
built
1910
1823 NW 8th St, Oklahoma City, OK 73106
$232
Cash flow
8.3%
Cash-on-Cash Return
7.6%
Cap rate
1.0%
Rent to Value Ratio
Active
$360,000
2
bds
|
2
ba
|
0
sqft
|
built
1956
3101 NW 70th St, Oklahoma City, OK 73116
$-75
Cash flow
-1.1%
Cash-on-Cash Return
5.4%
Cap rate
0.7%
Rent to Value Ratio
Active
$349,900
2
bds
|
3
ba
|
0
sqft
|
built
1984
6204 Waterford Blvd, Oklahoma City, OK 73118
$-1,295
Cash flow
-19.3%
Cash-on-Cash Return
1.2%
Cap rate
0.6%
Rent to Value Ratio
Active
$360,000
4
bds
|
3
ba
|
0
sqft
|
built
1960
5917 N Roff Ave, Oklahoma City, OK 73112
$-378
Cash flow
-5.5%
Cash-on-Cash Return
4.4%
Cap rate
0.6%
Rent to Value Ratio
Active
$175,000
3
bds
|
2
ba
|
0
sqft
|
built
1966
1413 NW 106th St, Oklahoma City, OK 73114
$-27
Cash flow
-0.8%
Cash-on-Cash Return
5.5%
Cap rate
0.8%
Rent to Value Ratio
Active
$269,500
4
bds
|
2
ba
|
0
sqft
|
built
1977
8201 Willow Creek Blvd, Oklahoma City, OK 73162
$-311
Cash flow
-6.0%
Cash-on-Cash Return
4.3%
Cap rate
0.7%
Rent to Value Ratio

Active
$325,000
4
bds
|
2
ba
|
0
sqft
|
built
1978
7237 Warriner Way, Oklahoma City, OK 73162
$-112
Cash flow
-1.8%
Cash-on-Cash Return
5.3%
Cap rate
0.7%
Rent to Value Ratio
Active
$298,500
3
bds
|
2
ba
|
0
sqft
|
built
1971
2416 SW 92nd St, Oklahoma City, OK 73159
$-383
Cash flow
-6.7%
Cash-on-Cash Return
4.1%
Cap rate
0.6%
Rent to Value Ratio
Active
$245,000
2
bds
|
2
ba
|
0
sqft
|
built
2004
13440 Prairie View Ln, Oklahoma City, OK 73142
$-272
Cash flow
-5.8%
Cash-on-Cash Return
4.3%
Cap rate
0.7%
Rent to Value Ratio

Active
$474,900
4
bds
|
4
ba
|
0
sqft
|
built
2018
1413 N Mc Kinley Ave, Oklahoma City, OK 73106
$-735
Cash flow
-8.1%
Cash-on-Cash Return
3.8%
Cap rate
0.7%
Rent to Value Ratio