Oklahoma City, OK Investment Properties for Sale
Browse homes for sale and investment properties in Oklahoma City, OK. Refine your search by price, property type, or more.
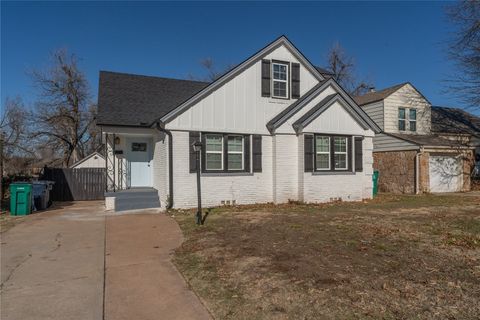
Best cash flowing properties in Oklahoma City, OK
Active
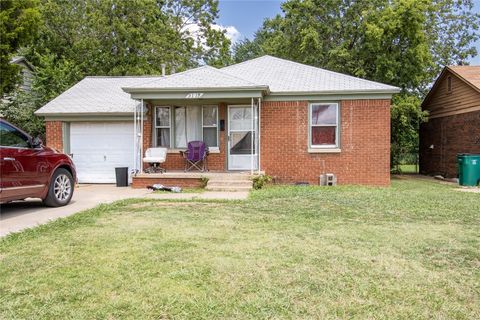
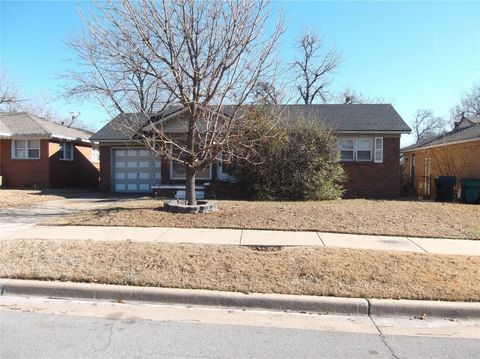
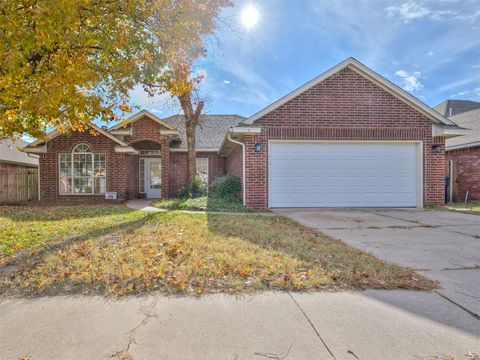
$184,333
3
bds
|
2
ba
|
0
sqft
|
built
1965
2916 SW 61st St, Oklahoma City, OK 73159
$157
Cash flow
4.4%
Cash-on-Cash Return
6.7%
Cap rate
0.9%
Rent to Value Ratio
Active
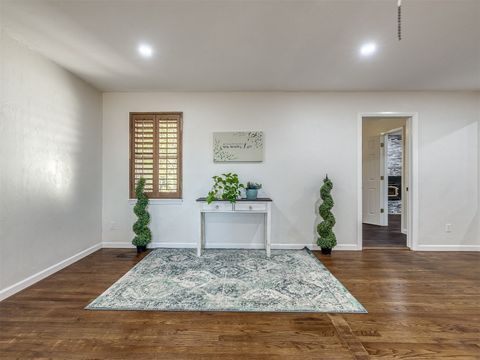
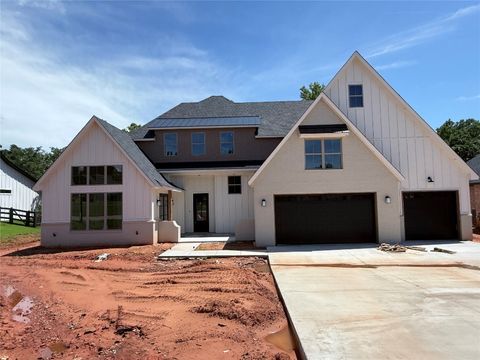
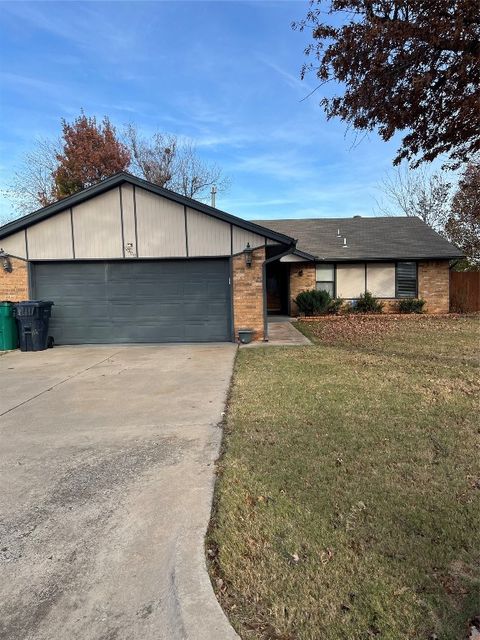
$124,900
4
bds
|
1
ba
|
0
sqft
|
built
1941
6009 NW 19th St, Oklahoma City, OK 73127
$156
Cash flow
6.5%
Cash-on-Cash Return
7.2%
Cap rate
1.0%
Rent to Value Ratio
1,420 out of 1,798 properties for sale in Oklahoma City, OK
Limited Results Shown
Create a free account, or log in to reveal all property listings and enjoy the complete experience.

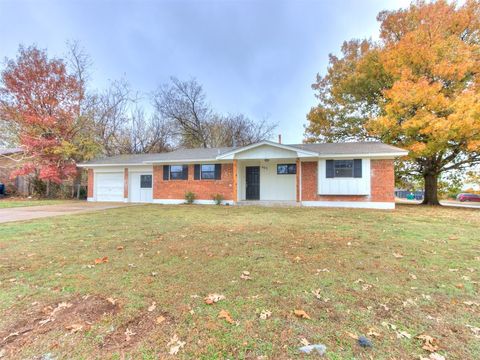
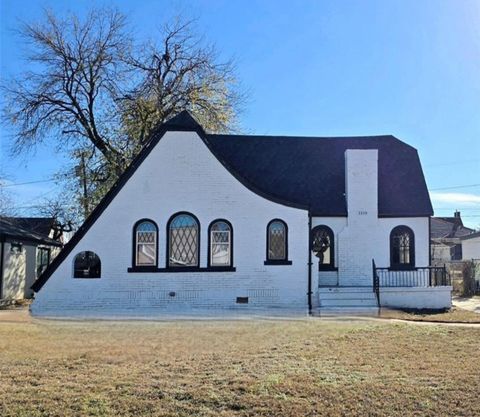
Active
$250,000
2
bds
|
1
ba
|
0
sqft
|
built
1905
38 SE 21st St, Oklahoma City, OK 73129
$-355
Cash flow
-7.4%
Cash-on-Cash Return
4.0%
Cap rate
0.5%
Rent to Value Ratio

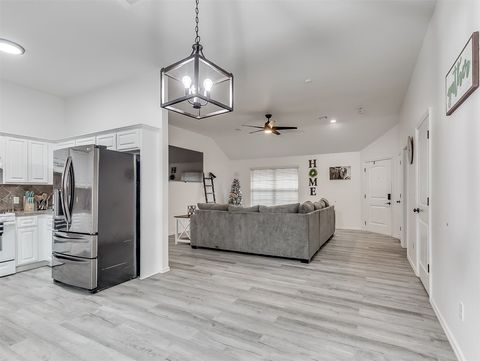
Active
$295,333
6
bds
|
2
ba
|
0
sqft
|
built
1978
8201 NW 90th Ter, Oklahoma City, OK 73132
$-181
Cash flow
-3.2%
Cash-on-Cash Return
4.9%
Cap rate
0.7%
Rent to Value Ratio

Active
$225,000
3
bds
|
1
ba
|
0
sqft
|
built
1939
3800 Key Pl, Oklahoma City, OK 73112
$-52
Cash flow
-1.2%
Cash-on-Cash Return
5.4%
Cap rate
0.7%
Rent to Value Ratio

Active
$223,500
3
bds
|
3
ba
|
0
sqft
|
built
1965
6428 S Drexel Ave, Oklahoma City, OK 73159
$152
Cash flow
3.5%
Cash-on-Cash Return
6.5%
Cap rate
0.8%
Rent to Value Ratio

Active
$569,000
3
bds
|
3
ba
|
0
sqft
|
built
1921
1322 NW 21st St, Oklahoma City, OK 73106
$-1,021
Cash flow
-9.4%
Cash-on-Cash Return
3.5%
Cap rate
0.5%
Rent to Value Ratio

Active
$724,000
4
bds
|
4
ba
|
0
sqft
|
built
1930
1917 N Shartel Ave, Oklahoma City, OK 73103
$-1,554
Cash flow
-11.2%
Cash-on-Cash Return
3.1%
Cap rate
0.5%
Rent to Value Ratio
Active
$235,000
3
bds
|
3
ba
|
0
sqft
|
built
1998
6813 NW 133rd Ter, Oklahoma City, OK 73142
$-393
Cash flow
-8.7%
Cash-on-Cash Return
3.7%
Cap rate
0.6%
Rent to Value Ratio

Active
$456,000
3
bds
|
3
ba
|
0
sqft
|
built
2012
14509 Almond Valley Dr, Oklahoma City, OK 73165
$-734
Cash flow
-8.4%
Cash-on-Cash Return
3.7%
Cap rate
0.6%
Rent to Value Ratio
Active
$389,000
3
bds
|
2
ba
|
0
sqft
|
built
1977
3233 Raintree Rd, Oklahoma City, OK 73120
$-241
Cash flow
-3.2%
Cash-on-Cash Return
4.9%
Cap rate
0.7%
Rent to Value Ratio
Active
$234,999
3
bds
|
2
ba
|
0
sqft
|
built
1942
2525 NW 32nd St, Oklahoma City, OK 73112
$-172
Cash flow
-3.8%
Cash-on-Cash Return
4.8%
Cap rate
0.7%
Rent to Value Ratio
Active
$199,000
2
bds
|
1
ba
|
0
sqft
|
built
1926
2829 NW 18th St, Oklahoma City, OK 73107
$83
Cash flow
2.2%
Cash-on-Cash Return
6.2%
Cap rate
0.9%
Rent to Value Ratio

Active
$375,000
4
bds
|
4
ba
|
0
sqft
|
built
1937
16 Oakwood Dr, Oklahoma City, OK 73121
$-309
Cash flow
-4.3%
Cash-on-Cash Return
4.7%
Cap rate
0.7%
Rent to Value Ratio
Active
$184,333
3
bds
|
2
ba
|
0
sqft
|
built
1965
2916 SW 61st St, Oklahoma City, OK 73159
$157
Cash flow
4.4%
Cash-on-Cash Return
6.7%
Cap rate
0.9%
Rent to Value Ratio
Active
$1,390,000
4
bds
|
5
ba
|
0
sqft
|
built
2001
5808 Mistletoe Ct, Oklahoma City, OK 73142
$-5,091
Cash flow
-19.1%
Cash-on-Cash Return
1.3%
Cap rate
0.3%
Rent to Value Ratio
Active
$415,000
4
bds
|
2
ba
|
0
sqft
|
built
2022
14704 Ashore Dr, Oklahoma City, OK 73142
$-519
Cash flow
-6.5%
Cash-on-Cash Return
4.2%
Cap rate
0.7%
Rent to Value Ratio
Active
$129,900
2
bds
|
1
ba
|
0
sqft
|
built
1949
3119 NW 39th Ter, Oklahoma City, OK 73112
$53
Cash flow
2.1%
Cash-on-Cash Return
6.2%
Cap rate
0.8%
Rent to Value Ratio
Active
$277,500
3
bds
|
2
ba
|
0
sqft
|
built
1956
1847 N Allen Ln, Oklahoma City, OK 73127
$-138
Cash flow
-2.6%
Cash-on-Cash Return
5.1%
Cap rate
0.6%
Rent to Value Ratio
Active
$209,000
2
bds
|
1
ba
|
0
sqft
|
built
1923
2244 NW 20th St, Oklahoma City, OK 73107
$102
Cash flow
2.5%
Cash-on-Cash Return
6.3%
Cap rate
0.8%
Rent to Value Ratio

Active
$139,900
3
bds
|
3
ba
|
0
sqft
|
built
1975
8808 N Rockwell Dr, Oklahoma City, OK 73132
$-94
Cash flow
-3.5%
Cash-on-Cash Return
4.9%
Cap rate
1.0%
Rent to Value Ratio
Active
$539,000
3
bds
|
4
ba
|
0
sqft
|
built
2001
5100 Burr Oaks Rd, Oklahoma City, OK 73105
$-630
Cash flow
-6.1%
Cash-on-Cash Return
4.3%
Cap rate
0.6%
Rent to Value Ratio
Active
$320,000
3
bds
|
2
ba
|
0
sqft
|
built
1947
2832 NW 45th St, Oklahoma City, OK 73112
$-282
Cash flow
-4.6%
Cash-on-Cash Return
4.6%
Cap rate
0.7%
Rent to Value Ratio
Active
$425,000
4
bds
|
3
ba
|
0
sqft
|
built
1997
2308 Renwick Ave, Oklahoma City, OK 73128
$-502
Cash flow
-6.2%
Cash-on-Cash Return
4.3%
Cap rate
0.6%
Rent to Value Ratio
Active
$265,000
3
bds
|
2
ba
|
0
sqft
|
built
2023
607 SW 31st St, Oklahoma City, OK 73109
$124
Cash flow
2.4%
Cash-on-Cash Return
6.2%
Cap rate
0.8%
Rent to Value Ratio
Active
$625,000
5
bds
|
4
ba
|
0
sqft
|
built
1928
809 NE 18th St, Oklahoma City, OK 73105
$-724
Cash flow
-6.0%
Cash-on-Cash Return
4.3%
Cap rate
0.6%
Rent to Value Ratio
Active
$395,000
3
bds
|
3
ba
|
0
sqft
|
built
2009
5609 NW 130th St, Oklahoma City, OK 73142
$-570
Cash flow
-7.5%
Cash-on-Cash Return
3.9%
Cap rate
0.6%
Rent to Value Ratio
Active
$399,000
3
bds
|
2
ba
|
0
sqft
|
built
1936
4435 N Martin Luther King Ave, Oklahoma City, OK 73111
$-461
Cash flow
-6.0%
Cash-on-Cash Return
4.3%
Cap rate
0.6%
Rent to Value Ratio
Active
$899,800
4
bds
|
4
ba
|
0
sqft
|
built
2024
2220 NW 27th St, Oklahoma City, OK 73107
$-3,150
Cash flow
-18.3%
Cash-on-Cash Return
1.5%
Cap rate
0.2%
Rent to Value Ratio
Active
$284,900
5
bds
|
3
ba
|
0
sqft
|
built
1957
5900 NW 62nd St, Oklahoma City, OK 73122
$-97
Cash flow
-1.8%
Cash-on-Cash Return
5.3%
Cap rate
0.8%
Rent to Value Ratio
Active
$141,999
3
bds
|
1
ba
|
0
sqft
|
built
1954
2924 N Vermont Ave, Oklahoma City, OK 73107
$-14
Cash flow
-0.5%
Cash-on-Cash Return
5.6%
Cap rate
0.8%
Rent to Value Ratio
Active
$124,900
4
bds
|
1
ba
|
0
sqft
|
built
1941
6009 NW 19th St, Oklahoma City, OK 73127
$156
Cash flow
6.5%
Cash-on-Cash Return
7.2%
Cap rate
1.0%
Rent to Value Ratio
Active
$837,045
4
bds
|
4
ba
|
0
sqft
|
built
2024
400 Eagle Creek Way, Oklahoma City, OK 73117
$-2,890
Cash flow
-18.0%
Cash-on-Cash Return
1.5%
Cap rate
0.2%
Rent to Value Ratio
Active
$169,000
4
bds
|
2
ba
|
0
sqft
|
built
1964
401 NW 86th St, Oklahoma City, OK 73114
$97
Cash flow
3.0%
Cash-on-Cash Return
6.4%
Cap rate
0.8%
Rent to Value Ratio
Active
$221,000
3
bds
|
2
ba
|
0
sqft
|
built
2013
5612 Marblewood Dr, Oklahoma City, OK 73179
$-136
Cash flow
-3.2%
Cash-on-Cash Return
4.9%
Cap rate
0.7%
Rent to Value Ratio

Active
$159,900
2
bds
|
1
ba
|
0
sqft
|
built
2016
1001 SW 92nd St, Oklahoma City, OK 73139
$-68
Cash flow
-2.2%
Cash-on-Cash Return
5.2%
Cap rate
0.9%
Rent to Value Ratio

Active
$159,900
2
bds
|
1
ba
|
0
sqft
|
built
2014
913 SW 92nd St, Oklahoma City, OK 73139
$-139
Cash flow
-4.5%
Cash-on-Cash Return
4.6%
Cap rate
0.8%
Rent to Value Ratio
Active
$256,000
4
bds
|
2
ba
|
0
sqft
|
built
1996
1036 SW 129th St, Oklahoma City, OK 73170
$-161
Cash flow
-3.3%
Cash-on-Cash Return
4.9%
Cap rate
0.7%
Rent to Value Ratio
Active
$212,000
3
bds
|
2
ba
|
0
sqft
|
built
1983
9000 Kimberly Rd, Oklahoma City, OK 73132
$-91
Cash flow
-2.2%
Cash-on-Cash Return
5.2%
Cap rate
0.8%
Rent to Value Ratio

Active
$289,000
2
bds
|
2
ba
|
0
sqft
|
built
1927
1140 N Kentucky Ave, Oklahoma City, OK 73106
$-518
Cash flow
-9.4%
Cash-on-Cash Return
3.5%
Cap rate
0.5%
Rent to Value Ratio

Active
$304,000
2
bds
|
2
ba
|
0
sqft
|
built
1927
1840 NW 11th St, Oklahoma City, OK 73106
$-604
Cash flow
-10.4%
Cash-on-Cash Return
3.3%
Cap rate
0.5%
Rent to Value Ratio
Active
$204,900
3
bds
|
1
ba
|
0
sqft
|
built
1928
1108 NE 16th St, Oklahoma City, OK 73117
$34
Cash flow
0.9%
Cash-on-Cash Return
5.9%
Cap rate
0.8%
Rent to Value Ratio