Oklahoma City, OK Investment Properties for Sale
Browse homes for sale and investment properties in Oklahoma City, OK. Refine your search by price, property type, or more.
Best cash flowing properties in Oklahoma City, OK
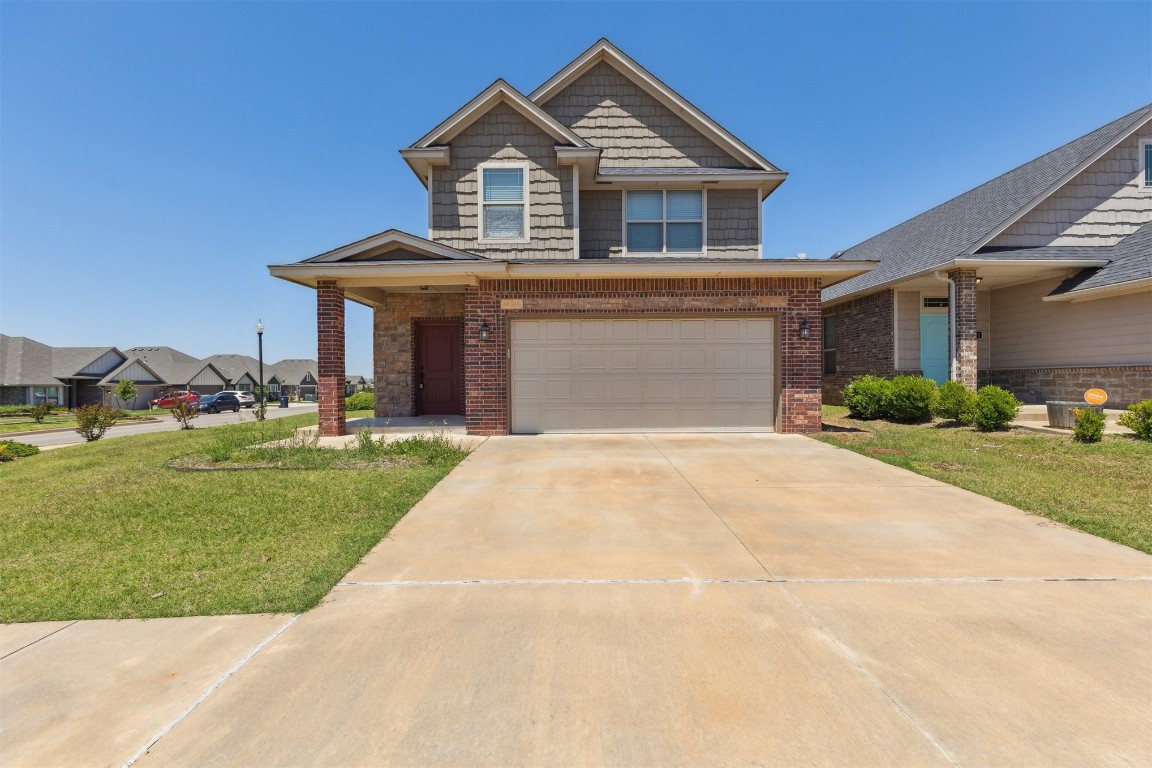
Active
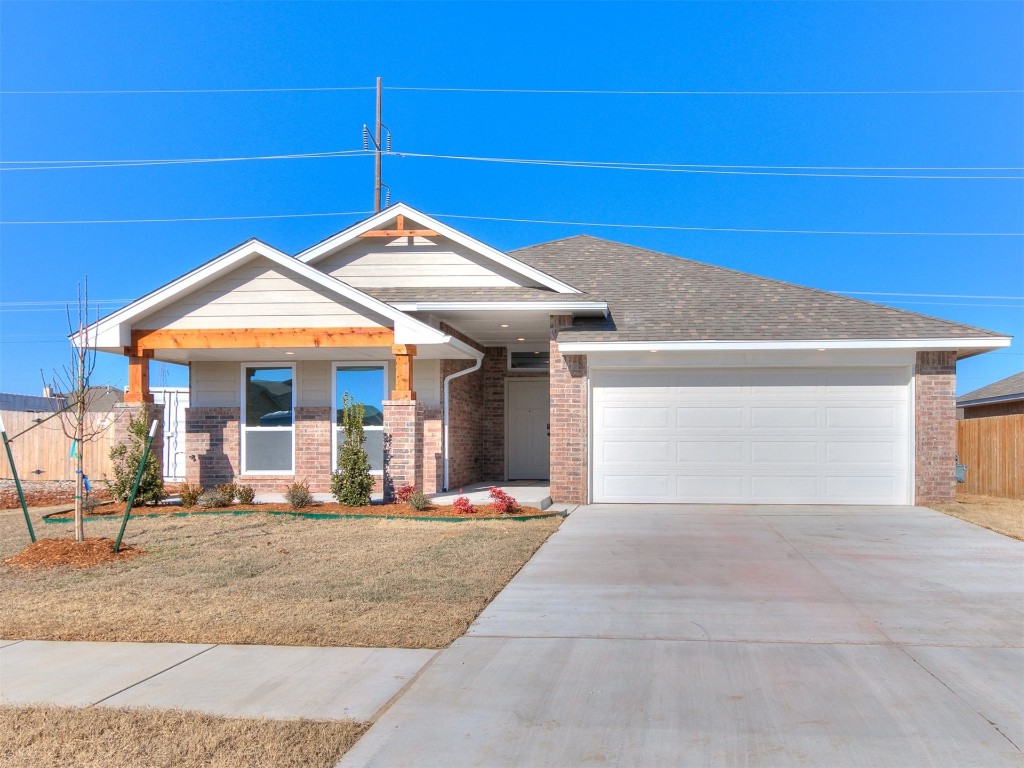
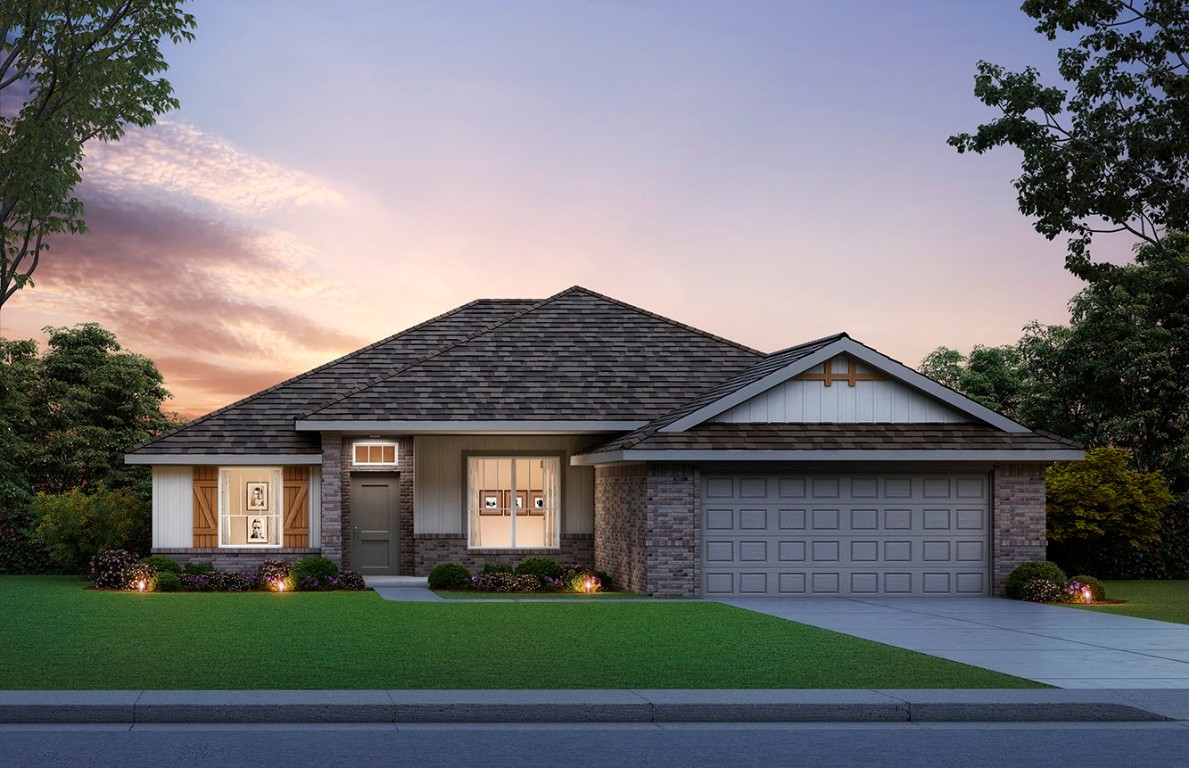
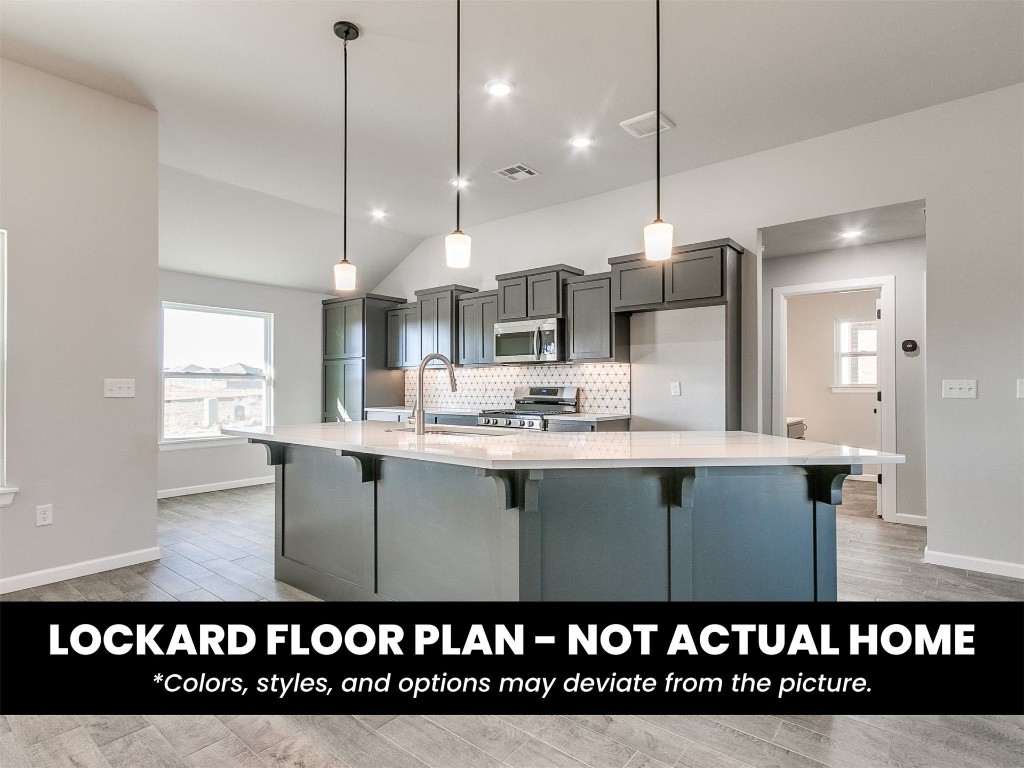
$309,990
3
bds
|
2
ba
|
0
sqft
|
built
2025
8617 NW 77th Pl, Oklahoma City, OK 73132
$233
Cash flow
3.9%
Cash-on-Cash Return
6.6%
Cap rate
0.8%
Rent to Value Ratio
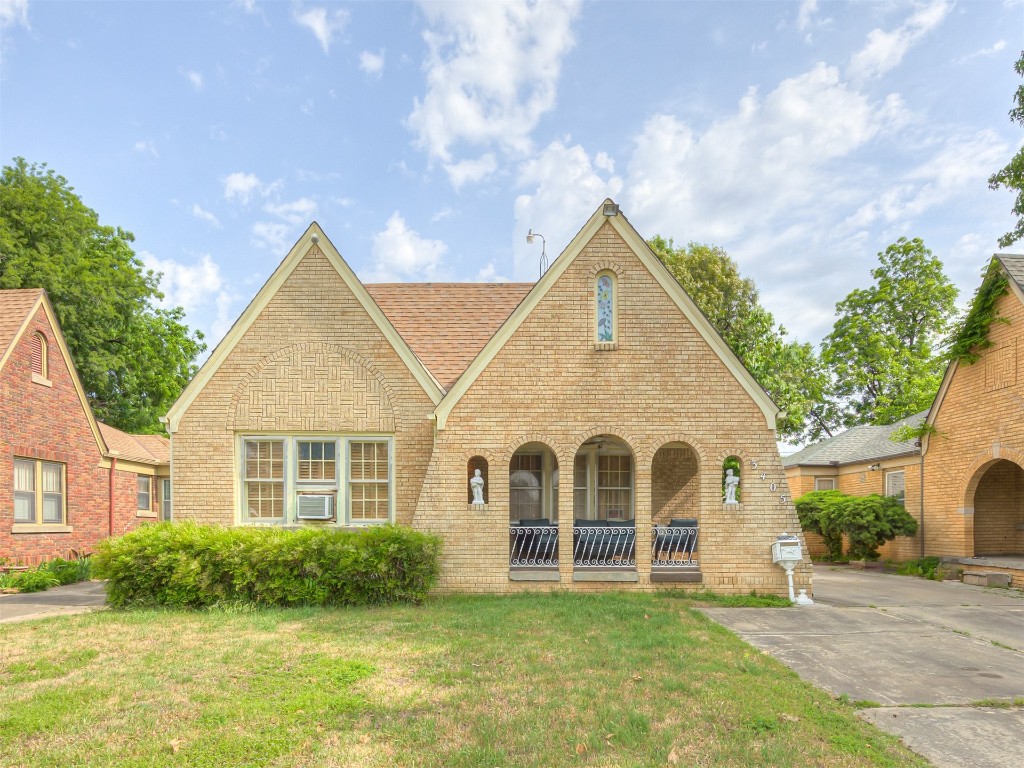
Active
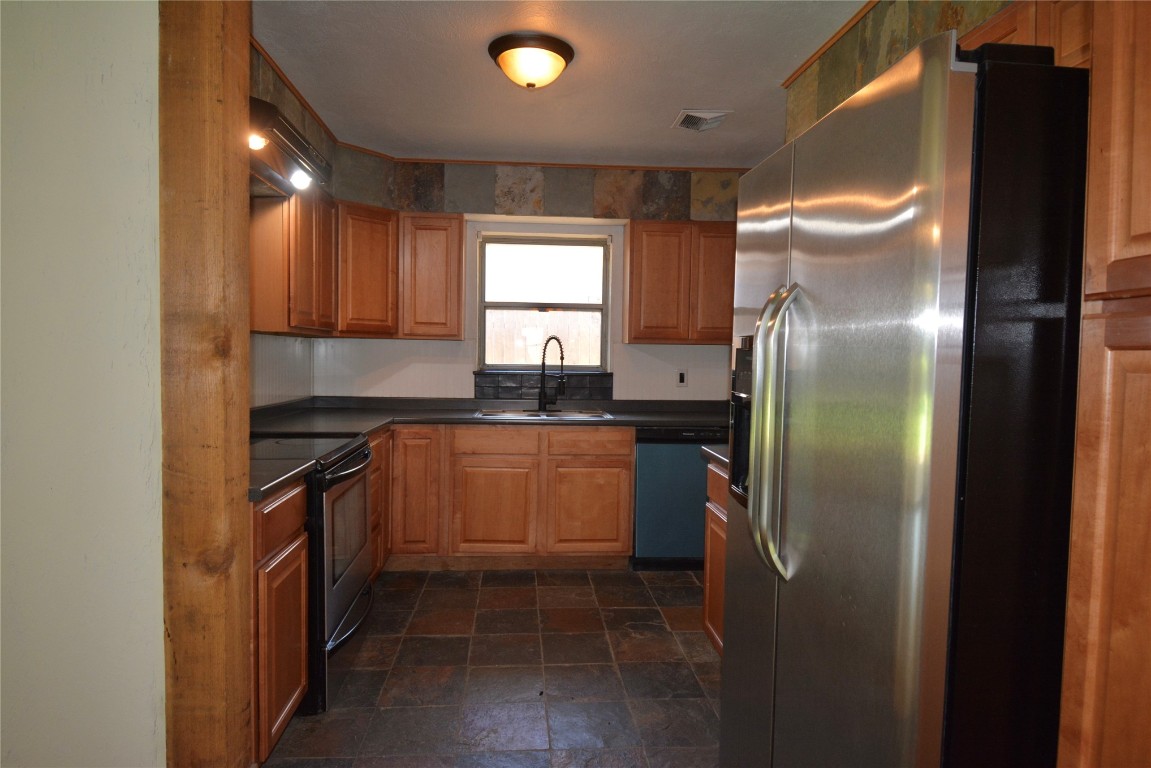
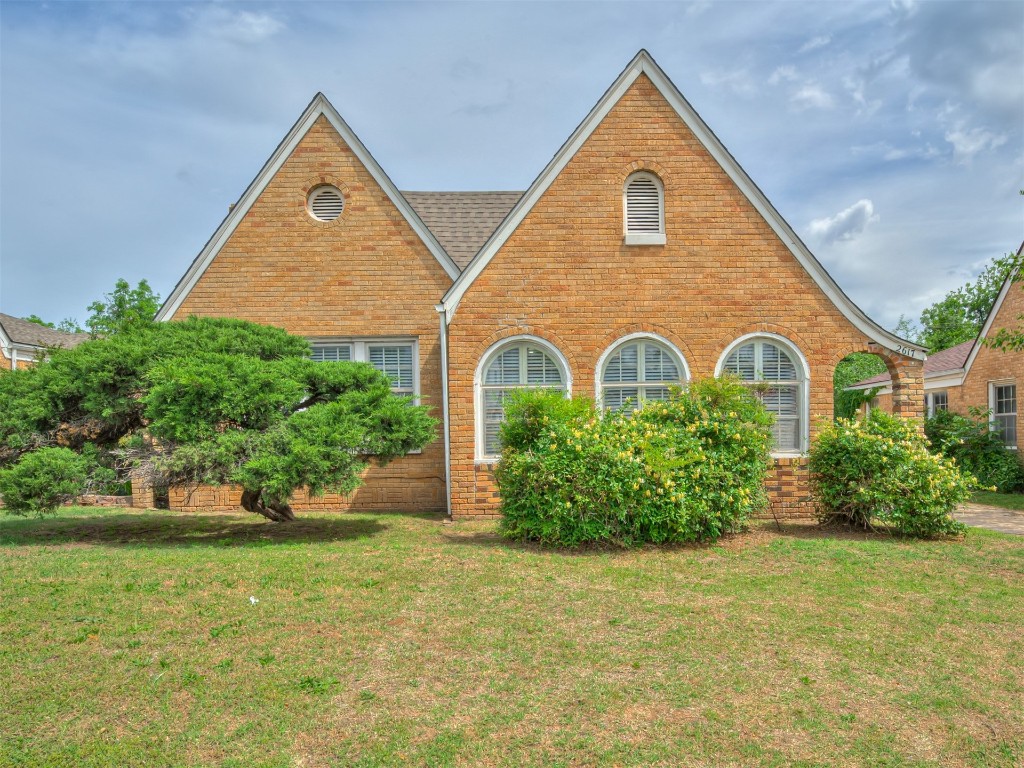
$199,000
3
bds
|
1
ba
|
0
sqft
|
built
1955
3708 NW 59th St, Oklahoma City, OK 73112
$-13
Cash flow
-0.3%
Cash-on-Cash Return
5.6%
Cap rate
0.8%
Rent to Value Ratio
1,322 out of 1,685 properties for sale in Oklahoma City, OK
Limited Results Shown
Create a free account, or log in to reveal all property listings and enjoy the complete experience.
Active
$309,990
3
bds
|
2
ba
|
0
sqft
|
built
2025
8617 NW 77th Pl, Oklahoma City, OK 73132
$233
Cash flow
3.9%
Cash-on-Cash Return
6.6%
Cap rate
0.8%
Rent to Value Ratio
Active
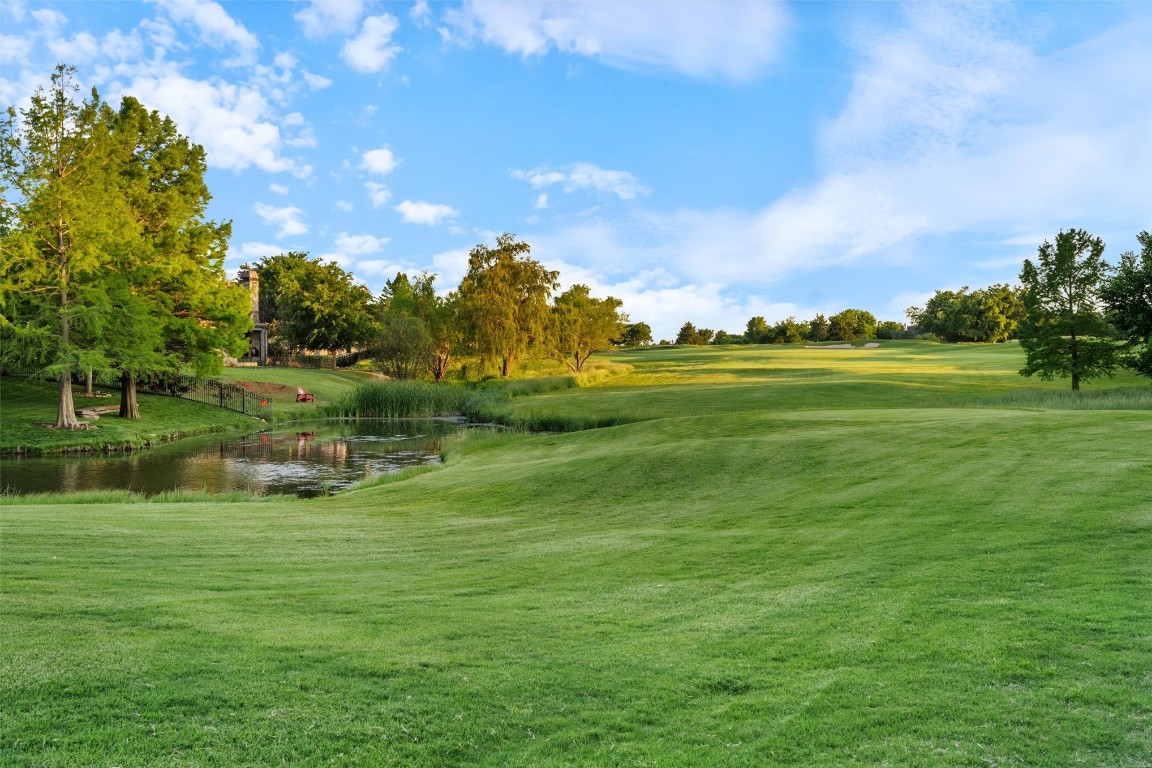
$1,350,000
3
bds
|
4
ba
|
0
sqft
|
built
2000
15032 Gaillardia Dr, Oklahoma City, OK 73142
$-5,860
Cash flow
-22.6%
Cash-on-Cash Return
0.5%
Cap rate
0.3%
Rent to Value Ratio
Active
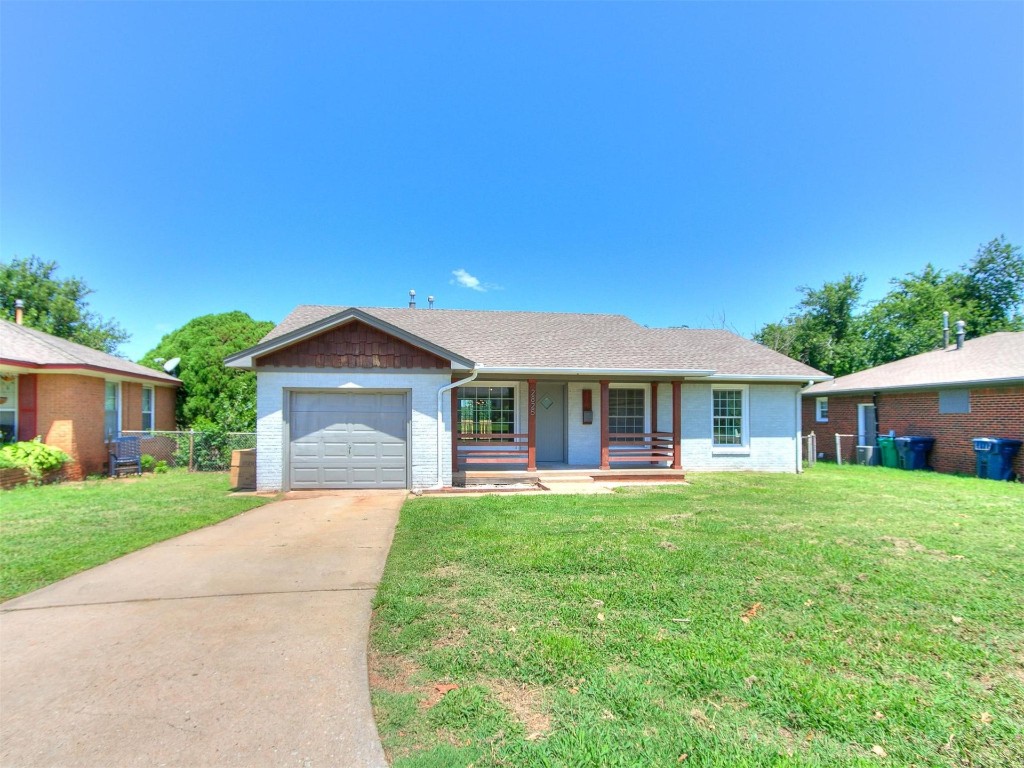
$199,900
3
bds
|
1
ba
|
0
sqft
|
built
1953
2825 NW 66th St, Oklahoma City, OK 73116
$-147
Cash flow
-3.8%
Cash-on-Cash Return
4.8%
Cap rate
0.8%
Rent to Value Ratio
Active
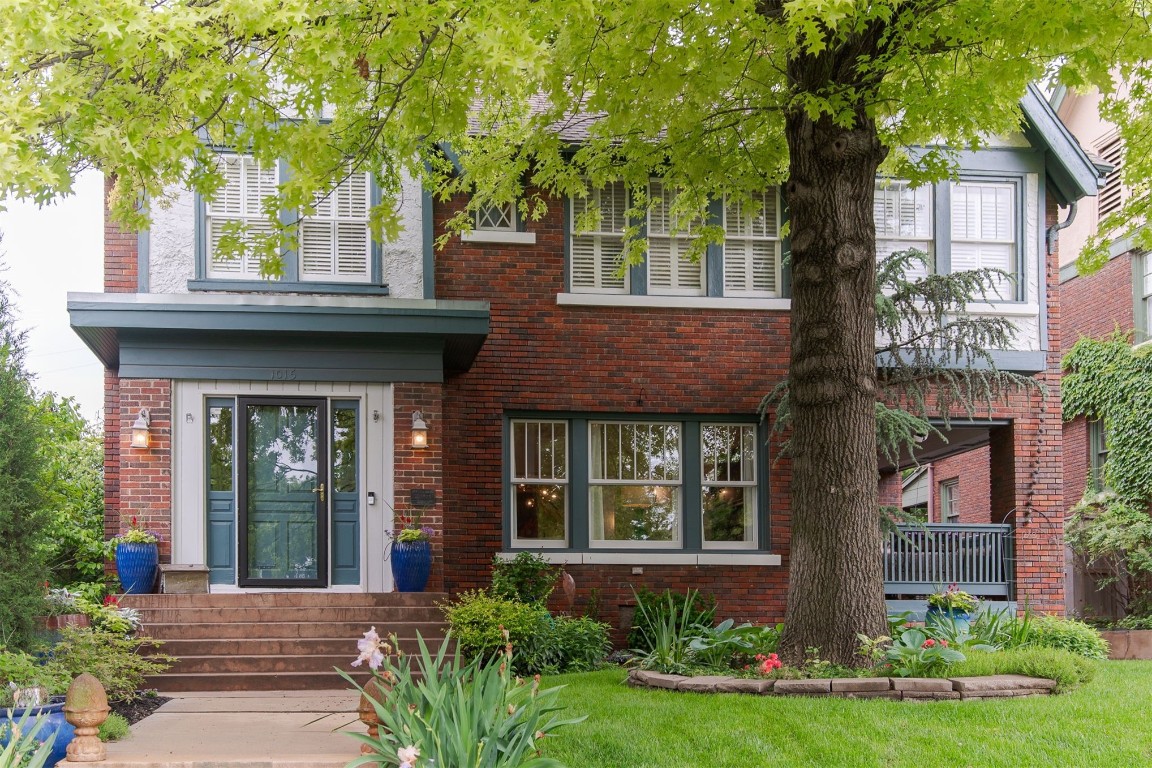
$895,000
3
bds
|
2
ba
|
0
sqft
|
built
1952
1216 W Wilshire Blvd, Oklahoma City, OK 73116
$-3,032
Cash flow
-17.7%
Cash-on-Cash Return
1.6%
Cap rate
0.3%
Rent to Value Ratio

Active
$261,000
3
bds
|
3
ba
|
0
sqft
|
built
1968
5708 NW 87th St, Oklahoma City, OK 73132
$-235
Cash flow
-4.7%
Cash-on-Cash Return
4.6%
Cap rate
0.7%
Rent to Value Ratio
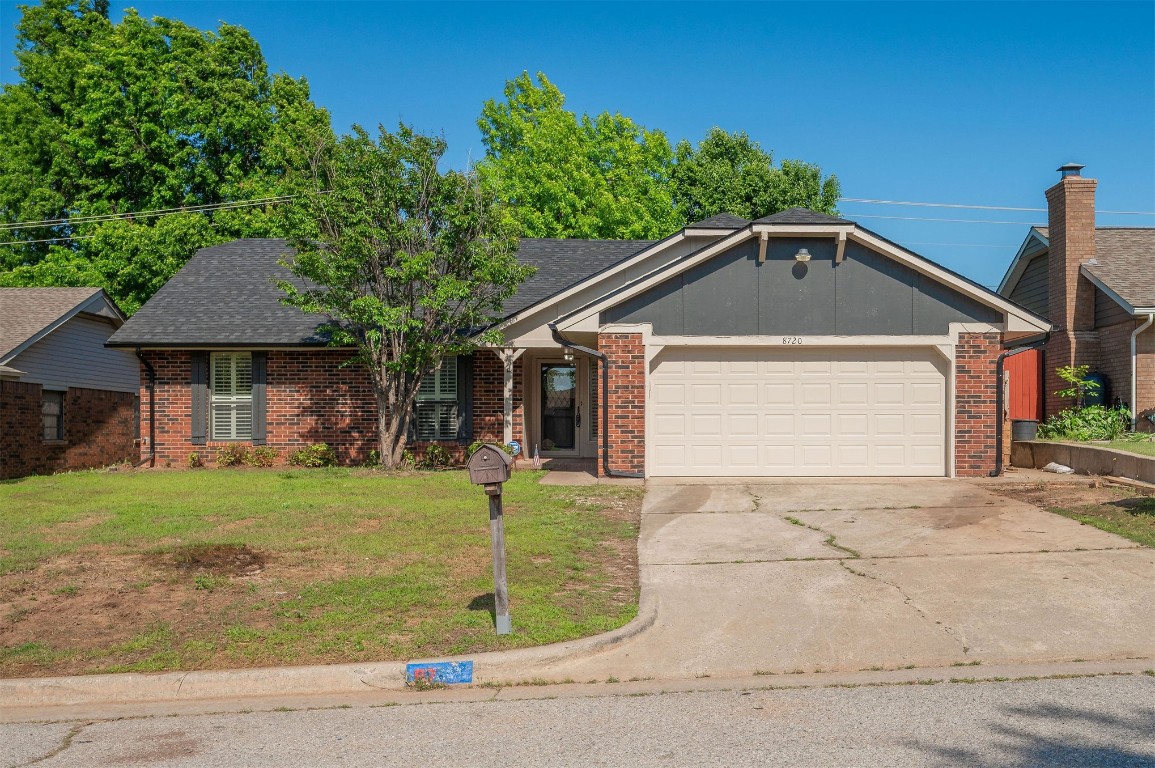
Active
$230,000
3
bds
|
2
ba
|
0
sqft
|
built
1977
8720 Raven Ave, Oklahoma City, OK 73132
$-55
Cash flow
-1.2%
Cash-on-Cash Return
5.4%
Cap rate
0.8%
Rent to Value Ratio
Active
$337,990
3
bds
|
2
ba
|
0
sqft
|
built
2025
8620 SW 75th St, Oklahoma City, OK 73169
$-106
Cash flow
-1.6%
Cash-on-Cash Return
5.3%
Cap rate
0.7%
Rent to Value Ratio
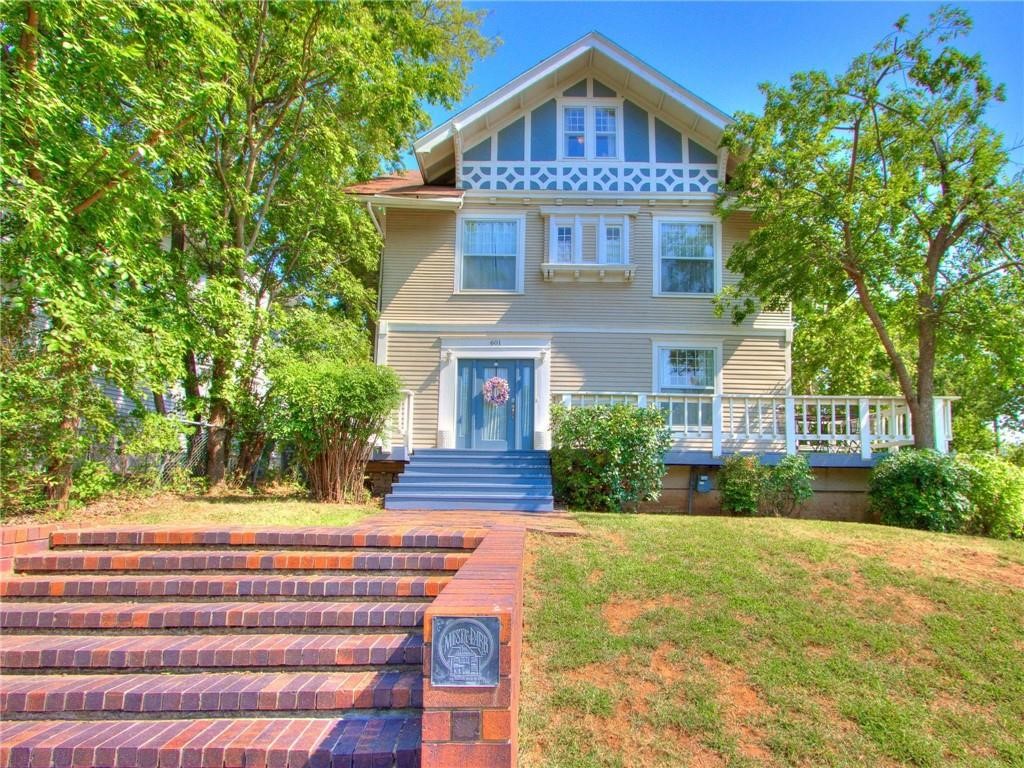
Active
$549,000
4
bds
|
4
ba
|
0
sqft
|
built
1909
601 NW 17th St, Oklahoma City, OK 73103
$-883
Cash flow
-8.4%
Cash-on-Cash Return
3.7%
Cap rate
0.6%
Rent to Value Ratio
Active
$345,385
3
bds
|
2
ba
|
0
sqft
|
built
2025
8613 SW 76th St, Oklahoma City, OK 73169
$-555
Cash flow
-8.4%
Cash-on-Cash Return
3.7%
Cap rate
0.5%
Rent to Value Ratio
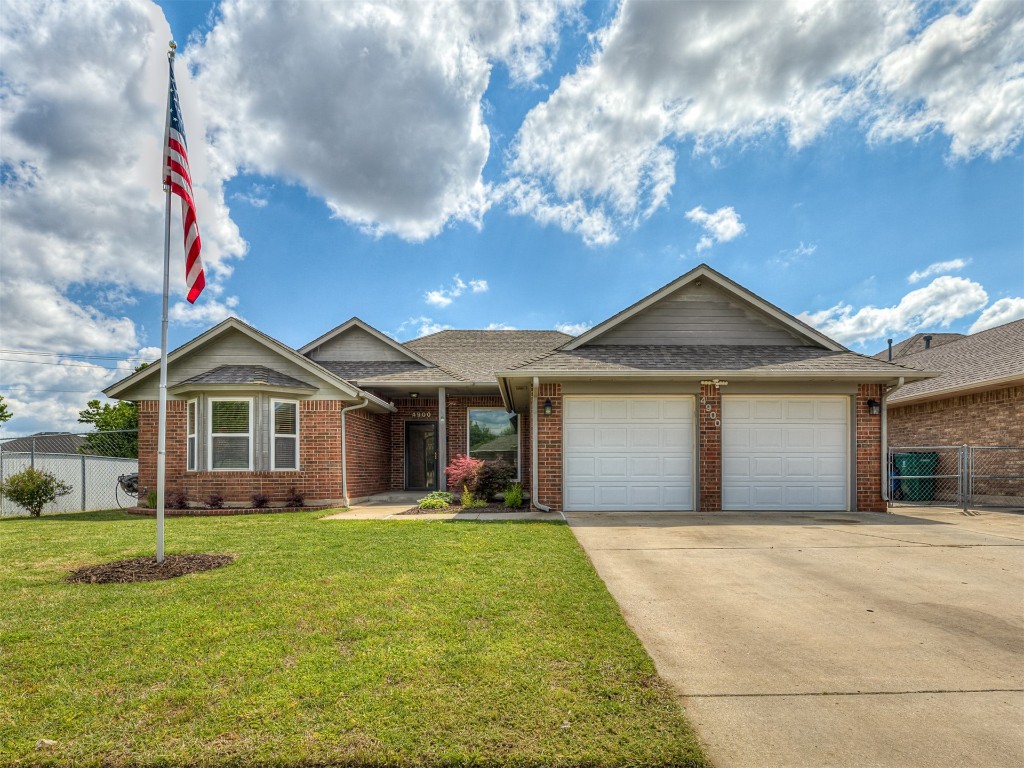
Active
$229,900
3
bds
|
2
ba
|
0
sqft
|
built
1999
4900 Republic Dr, Oklahoma City, OK 73135
$-257
Cash flow
-5.8%
Cash-on-Cash Return
4.3%
Cap rate
0.7%
Rent to Value Ratio
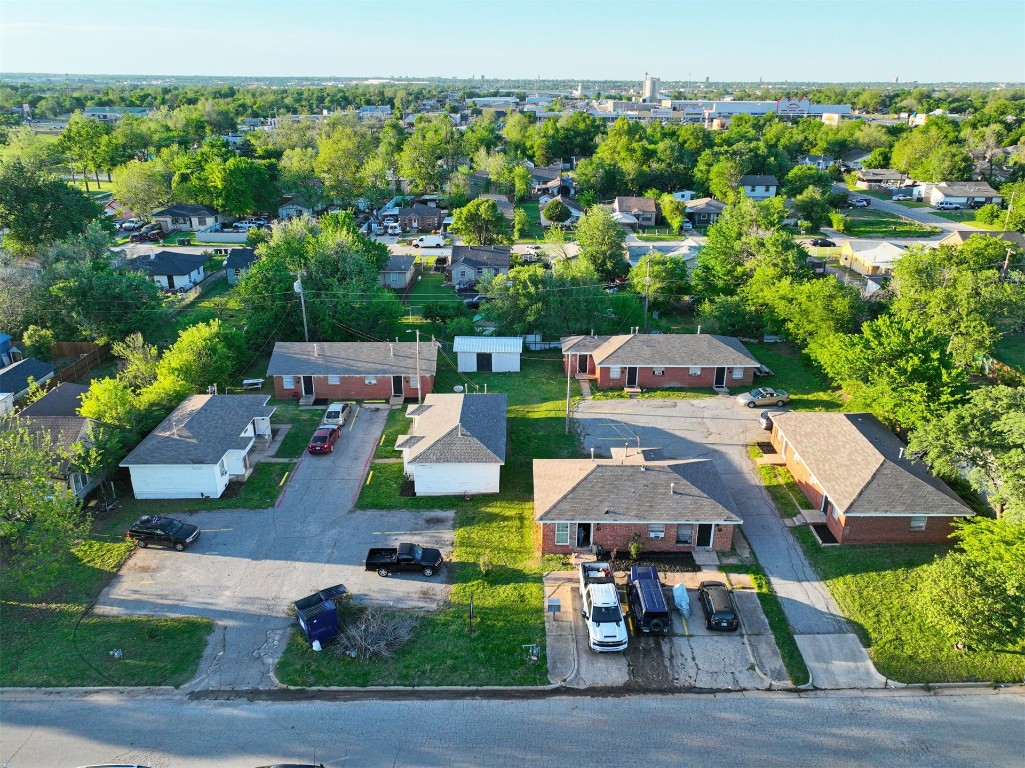
Active
$805,000
15
bds
|
12
ba
|
0
sqft
|
built
1955
2819 SW 33rd St, Oklahoma City, OK 73119
$-2,891
Cash flow
-18.7%
Cash-on-Cash Return
1.4%
Cap rate
0.2%
Rent to Value Ratio
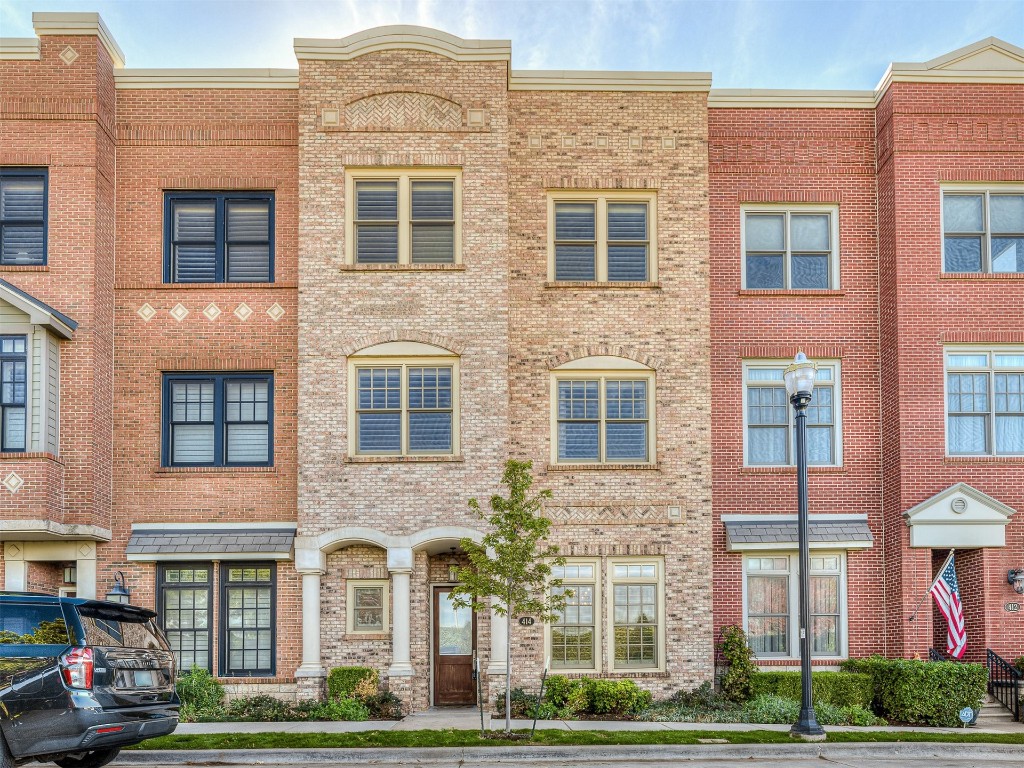
Active
$999,900
4
bds
|
4
ba
|
0
sqft
|
built
2011
414 NE 2nd St, Oklahoma City, OK 73104
$-2,720
Cash flow
-14.2%
Cash-on-Cash Return
2.4%
Cap rate
0.6%
Rent to Value Ratio
Active
$333,990
4
bds
|
2
ba
|
0
sqft
|
built
2025
8609 SW 76th St, Oklahoma City, OK 73169
$-502
Cash flow
-7.8%
Cash-on-Cash Return
3.9%
Cap rate
0.5%
Rent to Value Ratio
Active
$259,999
4
bds
|
3
ba
|
0
sqft
|
built
1933
2617 NW 23rd St, Oklahoma City, OK 73107
$-185
Cash flow
-3.7%
Cash-on-Cash Return
4.8%
Cap rate
0.7%
Rent to Value Ratio
Active
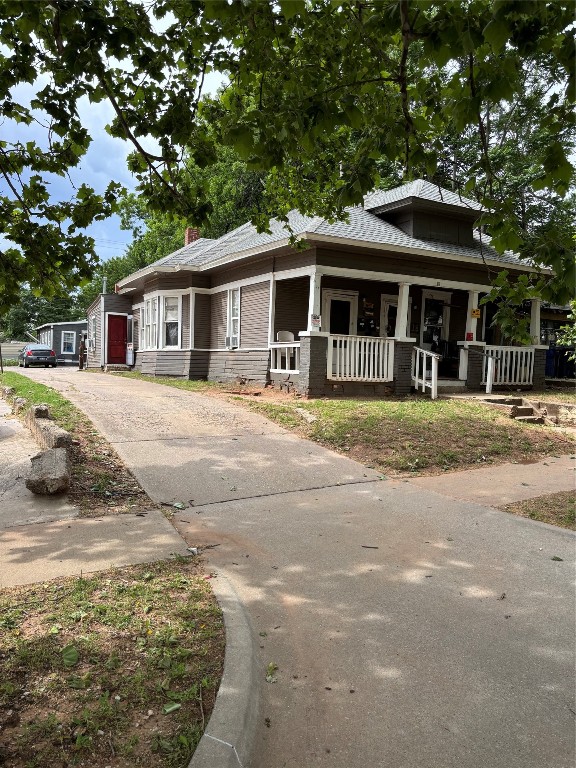
$199,000
3
bds
|
1
ba
|
0
sqft
|
built
1955
3708 NW 59th St, Oklahoma City, OK 73112
$-13
Cash flow
-0.3%
Cash-on-Cash Return
5.6%
Cap rate
0.8%
Rent to Value Ratio
Active
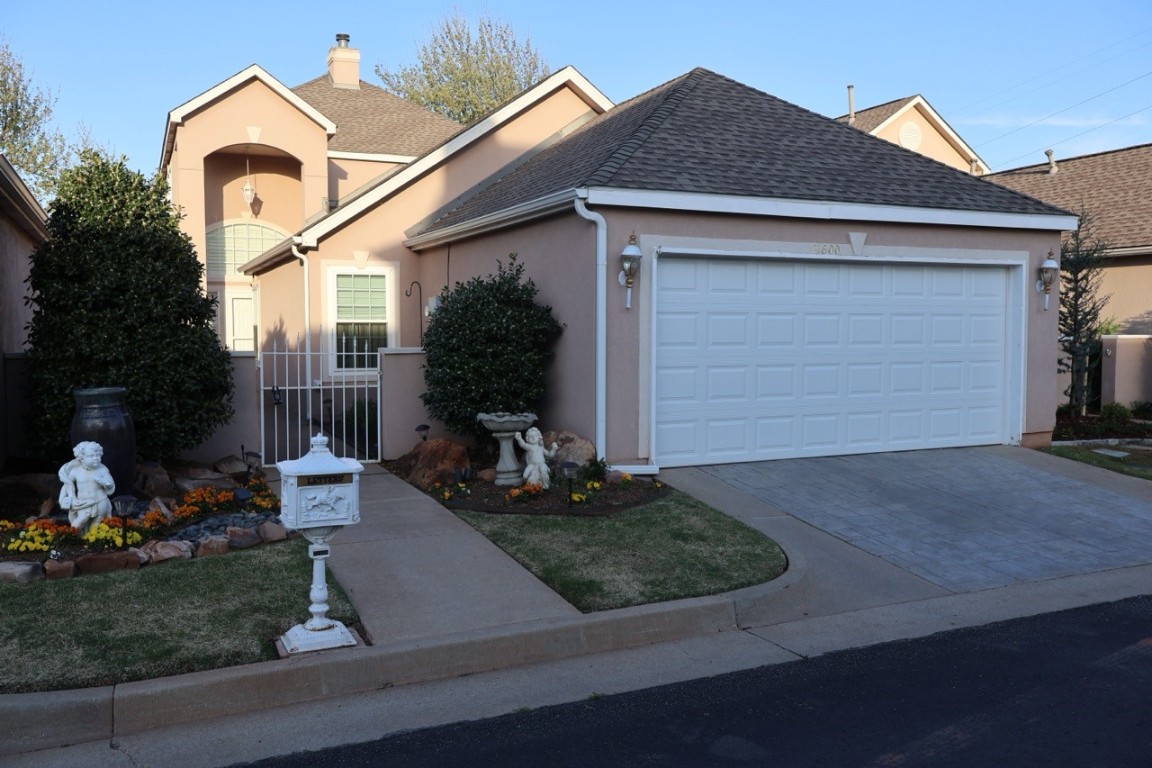
$299,500
2
bds
|
2
ba
|
0
sqft
|
built
1996
11600 Haven Way, Oklahoma City, OK 73120
$-450
Cash flow
-7.8%
Cash-on-Cash Return
3.9%
Cap rate
0.7%
Rent to Value Ratio
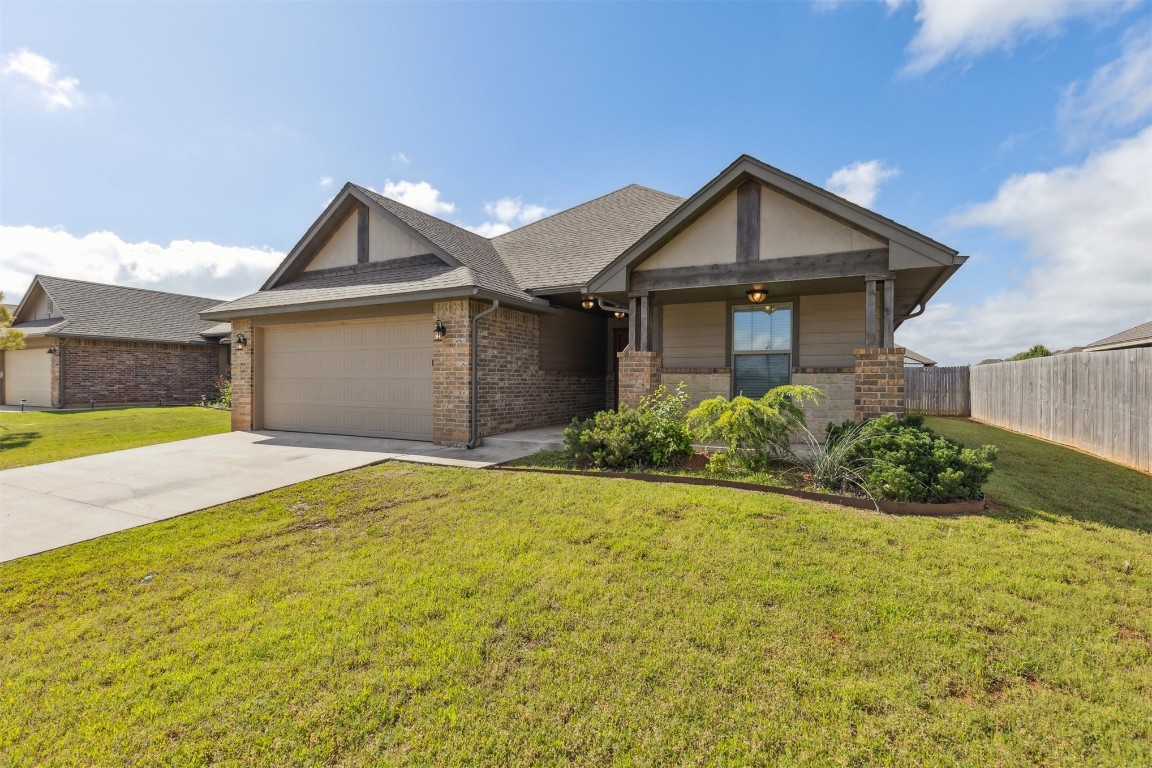
Active
$259,900
3
bds
|
2
ba
|
0
sqft
|
built
2017
8736 SW 38th St, Oklahoma City, OK 73179
$-265
Cash flow
-5.3%
Cash-on-Cash Return
4.5%
Cap rate
0.7%
Rent to Value Ratio
Active
$205,000
2
bds
|
1
ba
|
0
sqft
|
built
1932
3405 NW 22nd St, Oklahoma City, OK 73107
$-25
Cash flow
-0.6%
Cash-on-Cash Return
5.5%
Cap rate
0.7%
Rent to Value Ratio
Active
$329,000
3
bds
|
2
ba
|
0
sqft
|
built
1963
6501 N Laird Ave, Oklahoma City, OK 73105
$-419
Cash flow
-6.6%
Cash-on-Cash Return
4.2%
Cap rate
0.5%
Rent to Value Ratio
Active
$320,000
4
bds
|
3
ba
|
0
sqft
|
built
2016
8345 NW 137th St, Oklahoma City, OK 73142
$-309
Cash flow
-5.0%
Cash-on-Cash Return
4.5%
Cap rate
0.7%
Rent to Value Ratio
Active
$300,000
4
bds
|
2
ba
|
0
sqft
|
built
1973
5613 NW 115th St, Oklahoma City, OK 73162
$-334
Cash flow
-5.8%
Cash-on-Cash Return
4.3%
Cap rate
0.7%
Rent to Value Ratio
Active
$529,999
4
bds
|
2
ba
|
0
sqft
|
built
1928
1017 Dean Pl, Oklahoma City, OK 73117
$-440
Cash flow
-4.3%
Cash-on-Cash Return
4.7%
Cap rate
0.6%
Rent to Value Ratio

Active
$300,000
3
bds
|
3
ba
|
0
sqft
|
built
2008
10924 Silo Ridge Rd, Oklahoma City, OK 73170
$-203
Cash flow
-3.5%
Cash-on-Cash Return
4.9%
Cap rate
0.7%
Rent to Value Ratio
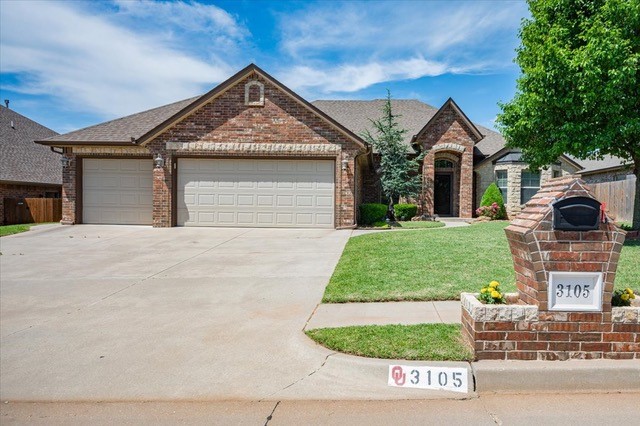
Active
$364,999
3
bds
|
3
ba
|
0
sqft
|
built
2011
3105 SW 139th St, Oklahoma City, OK 73170
$-490
Cash flow
-7.0%
Cash-on-Cash Return
4.1%
Cap rate
0.6%
Rent to Value Ratio
Active
$297,206
3
bds
|
2
ba
|
0
sqft
|
built
2025
8517 SW 76th St, Oklahoma City, OK 73169
$-51
Cash flow
-0.9%
Cash-on-Cash Return
5.5%
Cap rate
0.7%
Rent to Value Ratio
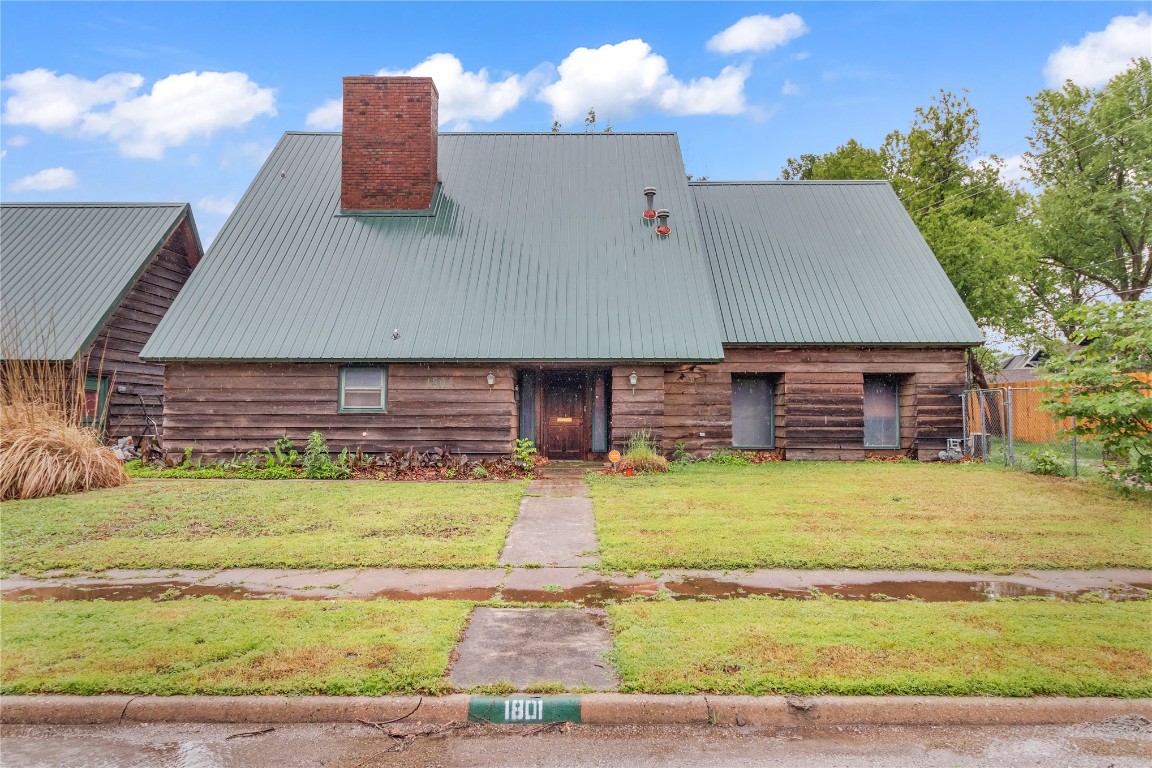
Active
$349,000
4
bds
|
2
ba
|
0
sqft
|
built
1978
1801 N Land Ave, Oklahoma City, OK 73107
$-323
Cash flow
-4.8%
Cash-on-Cash Return
4.6%
Cap rate
0.7%
Rent to Value Ratio

Active
$430,000
3
bds
|
2
ba
|
0
sqft
|
built
2004
5301 NW 123rd Ter, Oklahoma City, OK 73142
$-844
Cash flow
-10.2%
Cash-on-Cash Return
3.3%
Cap rate
0.6%
Rent to Value Ratio
Active
$450,000
7
bds
|
7
ba
|
0
sqft
|
built
1915
18 SW 25th St, Oklahoma City, OK 73109
$-1,091
Cash flow
-12.6%
Cash-on-Cash Return
2.8%
Cap rate
0.4%
Rent to Value Ratio
Active
$330,000
4
bds
|
3
ba
|
0
sqft
|
built
1990
3113 SW 125th St, Oklahoma City, OK 73170
$-273
Cash flow
-4.3%
Cash-on-Cash Return
4.7%
Cap rate
0.7%
Rent to Value Ratio

Active
$214,900
3
bds
|
2
ba
|
0
sqft
|
built
1941
2321 Cashion Pl, Oklahoma City, OK 73112
$-35
Cash flow
-0.8%
Cash-on-Cash Return
5.5%
Cap rate
0.7%
Rent to Value Ratio
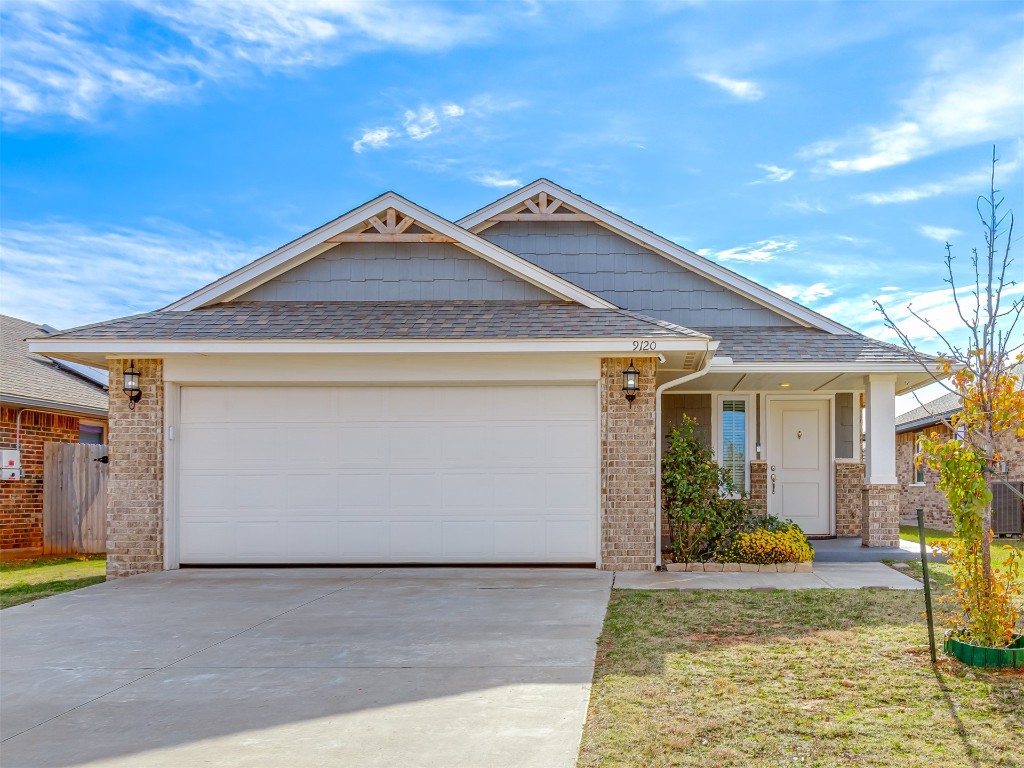
Active
$235,000
3
bds
|
2
ba
|
0
sqft
|
built
2020
9120 SW 46th St, Oklahoma City, OK 73179
$-8,372
Cash flow
-185.9%
Cash-on-Cash Return
-37.1%
Cap rate
0.7%
Rent to Value Ratio
Active
$327,000
5
bds
|
2
ba
|
0
sqft
|
built
1960
3224 S Anderson Rd, Oklahoma City, OK 73150
$-317
Cash flow
-5.1%
Cash-on-Cash Return
4.5%
Cap rate
0.7%
Rent to Value Ratio

Active
$310,000
3
bds
|
2
ba
|
0
sqft
|
built
1922
2107 NW 20th St, Oklahoma City, OK 73107
$-245
Cash flow
-4.1%
Cash-on-Cash Return
4.7%
Cap rate
0.7%
Rent to Value Ratio
Active
$460,000
4
bds
|
3
ba
|
0
sqft
|
built
2005
1501 SW 131st St, Oklahoma City, OK 73170
$-724
Cash flow
-8.2%
Cash-on-Cash Return
3.8%
Cap rate
0.6%
Rent to Value Ratio
Active
$383,000
4
bds
|
3
ba
|
0
sqft
|
built
1962
3804 NW 66th St, Oklahoma City, OK 73116
$-215
Cash flow
-2.9%
Cash-on-Cash Return
5.0%
Cap rate
0.7%
Rent to Value Ratio
Active
$1,475,000
5
bds
|
7
ba
|
0
sqft
|
built
2022
8225 SW 109th Ter, Oklahoma City, OK 73173
$-5,954
Cash flow
-21.1%
Cash-on-Cash Return
0.8%
Cap rate
0.2%
Rent to Value Ratio
Active
$2,499,999
5
bds
|
7
ba
|
0
sqft
|
built
2023
2826 Guilford Ln, Oklahoma City, OK 73120
$-10,102
Cash flow
-21.1%
Cash-on-Cash Return
0.8%
Cap rate
0.3%
Rent to Value Ratio
Active
$867,000
4
bds
|
3
ba
|
0
sqft
|
built
1926
1015 NW 14th St, Oklahoma City, OK 73106
$-2,253
Cash flow
-13.6%
Cash-on-Cash Return
2.6%
Cap rate
0.4%
Rent to Value Ratio
Active
$289,000
3
bds
|
1
ba
|
0
sqft
|
built
1928
915 NE 21st St, Oklahoma City, OK 73105
$-256
Cash flow
-4.6%
Cash-on-Cash Return
4.6%
Cap rate
0.7%
Rent to Value Ratio

Active
$210,000
3
bds
|
2
ba
|
0
sqft
|
built
1972
1004 SW 96th St, Oklahoma City, OK 73139
$-131
Cash flow
-3.3%
Cash-on-Cash Return
4.9%
Cap rate
0.8%
Rent to Value Ratio