Oklahoma City, OK Investment Properties for Sale
Browse homes for sale and investment properties in Oklahoma City, OK. Refine your search by price, property type, or more.
Best cash flowing properties in Oklahoma City, OK
Active
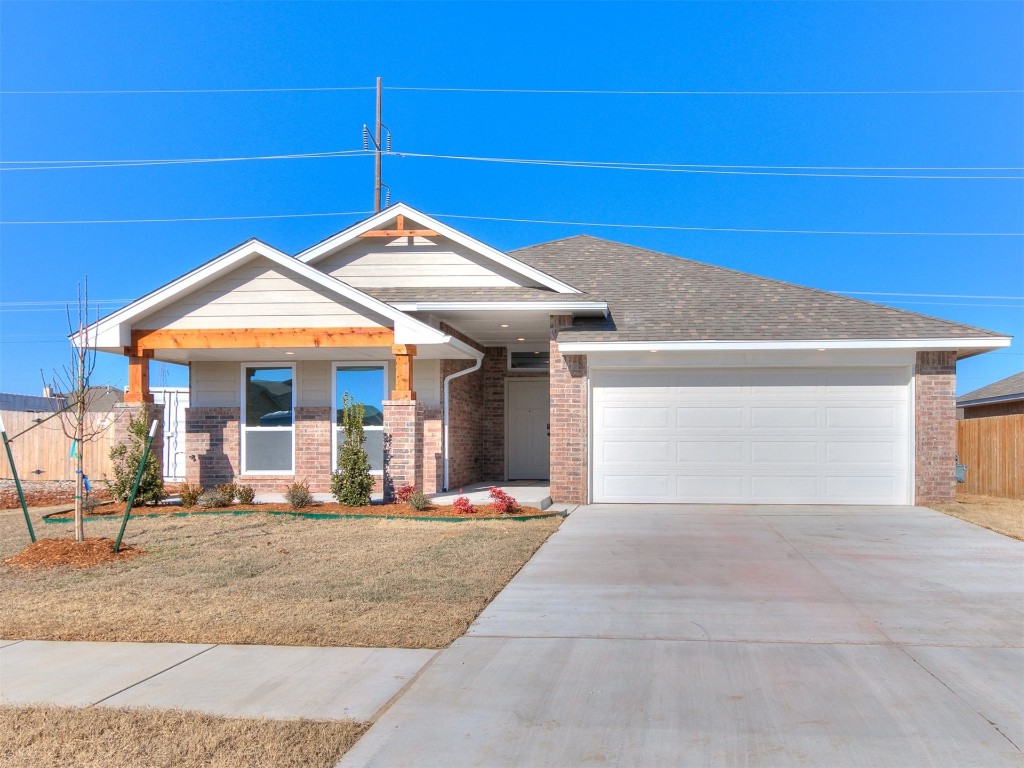
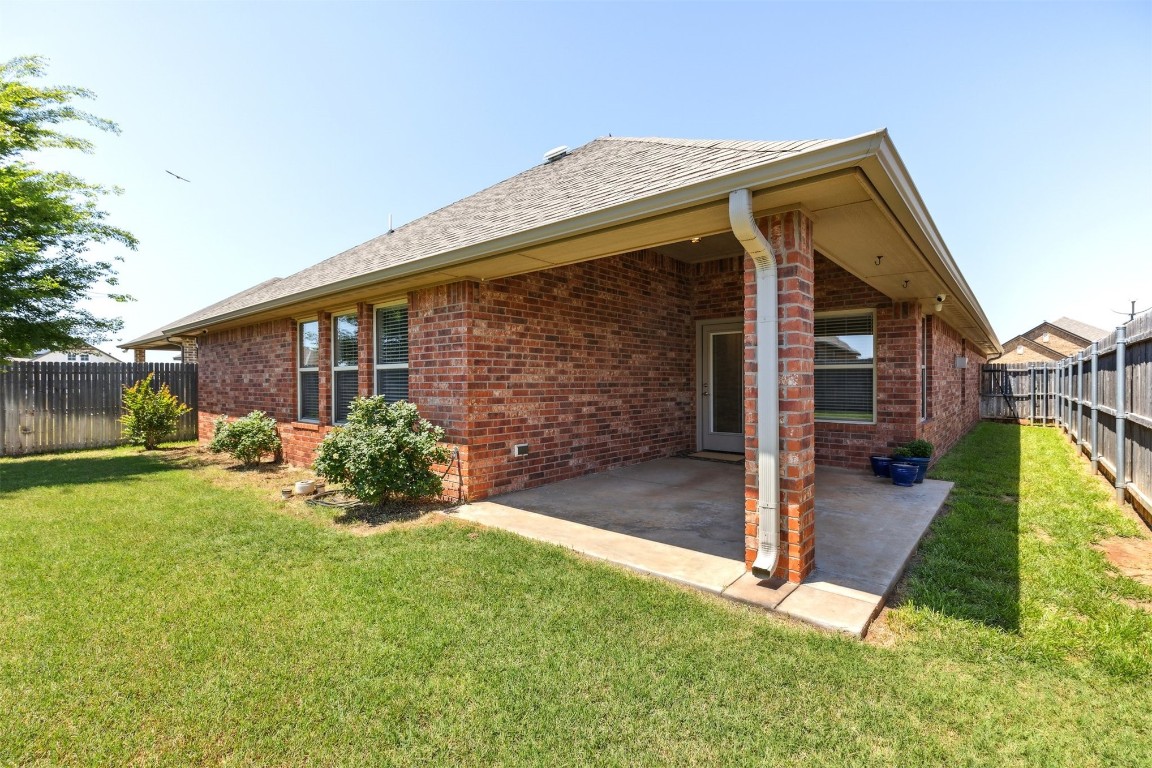
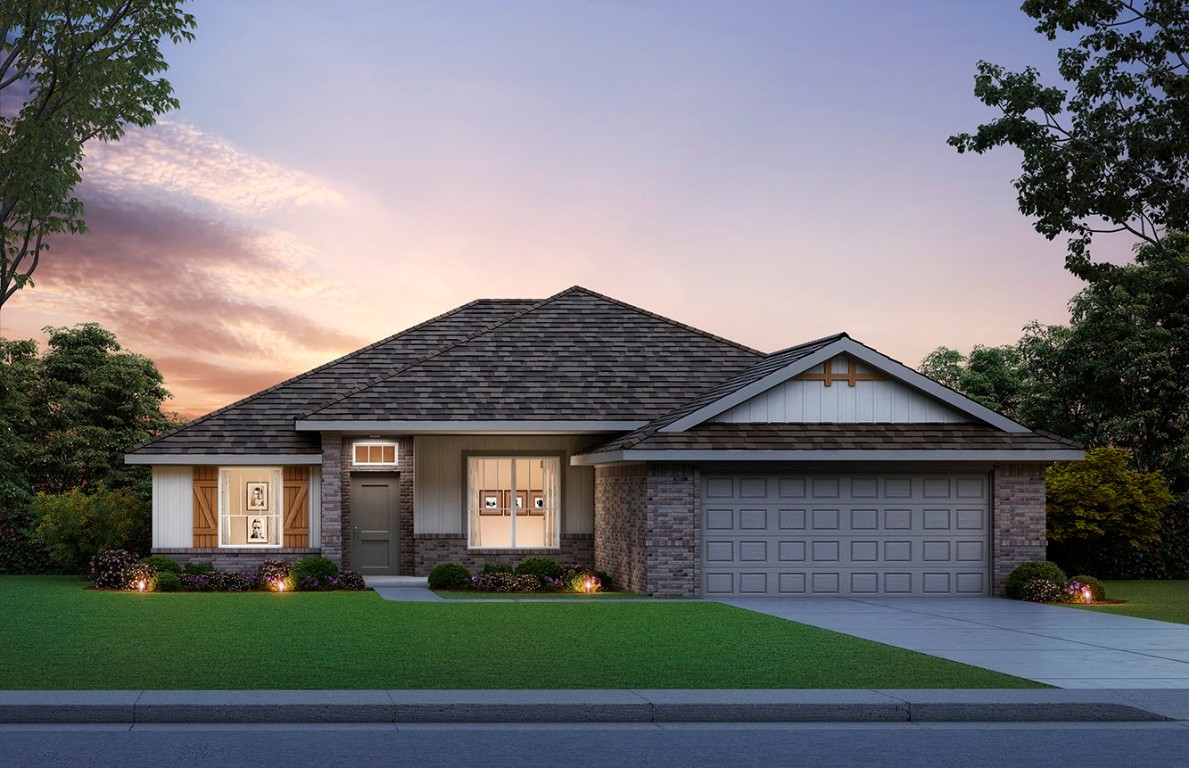
$299,990
3
bds
|
2
ba
|
0
sqft
|
built
2025
8617 NW 77th Pl, Oklahoma City, OK 73132
$129
Cash flow
2.2%
Cash-on-Cash Return
6.8%
Cap rate
0.8%
Rent to Value Ratio
Active
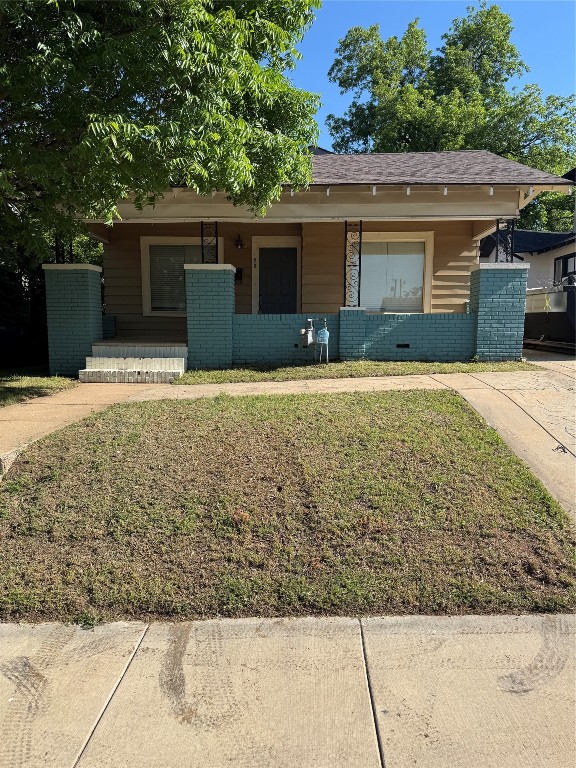
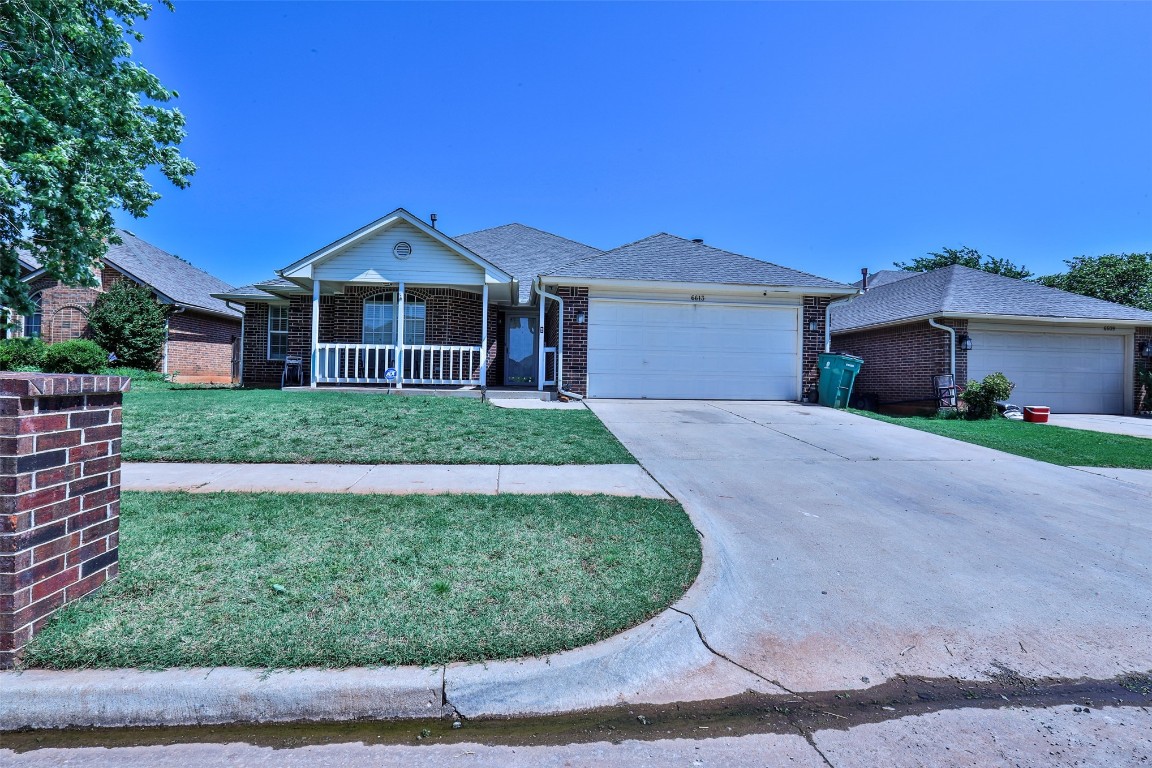
$174,900
3
bds
|
1
ba
|
0
sqft
|
built
1917
1629 W Park Pl, Oklahoma City, OK 73106
$61
Cash flow
1.8%
Cash-on-Cash Return
6.7%
Cap rate
0.9%
Rent to Value Ratio
1,285 out of 1,647 properties for sale in Oklahoma City, OK
Limited Results Shown
Create a free account, or log in to reveal all property listings and enjoy the complete experience.
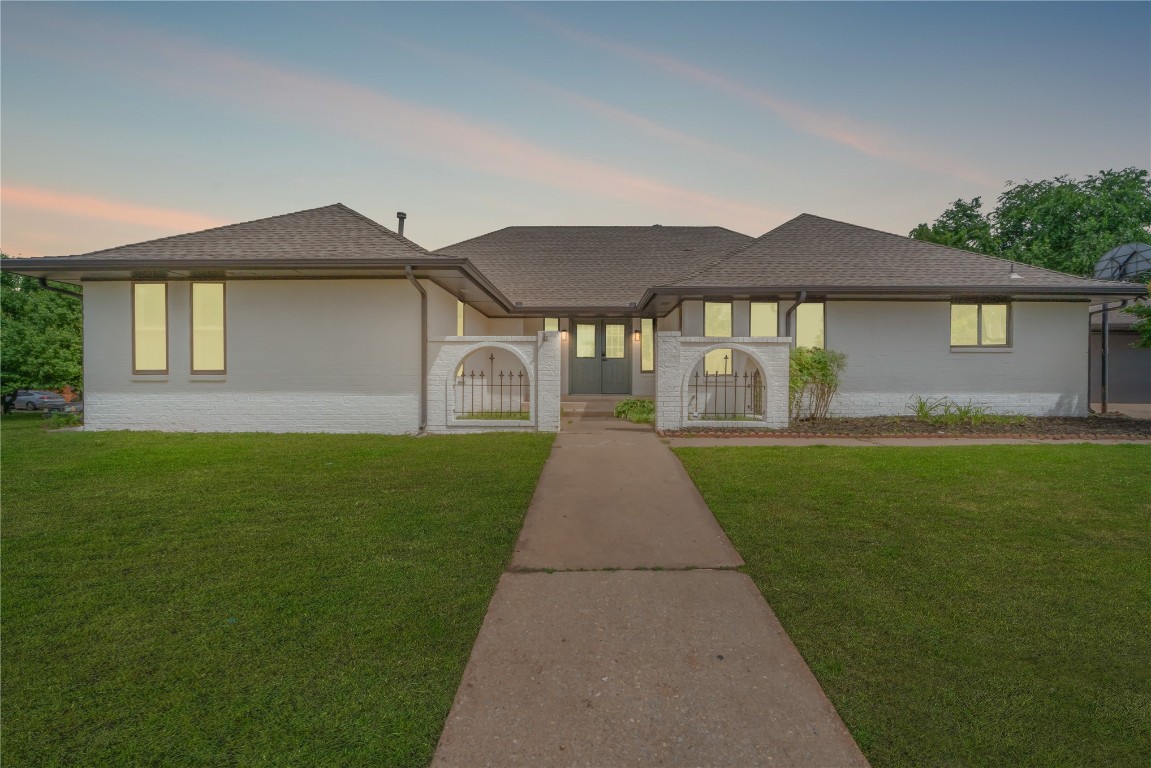
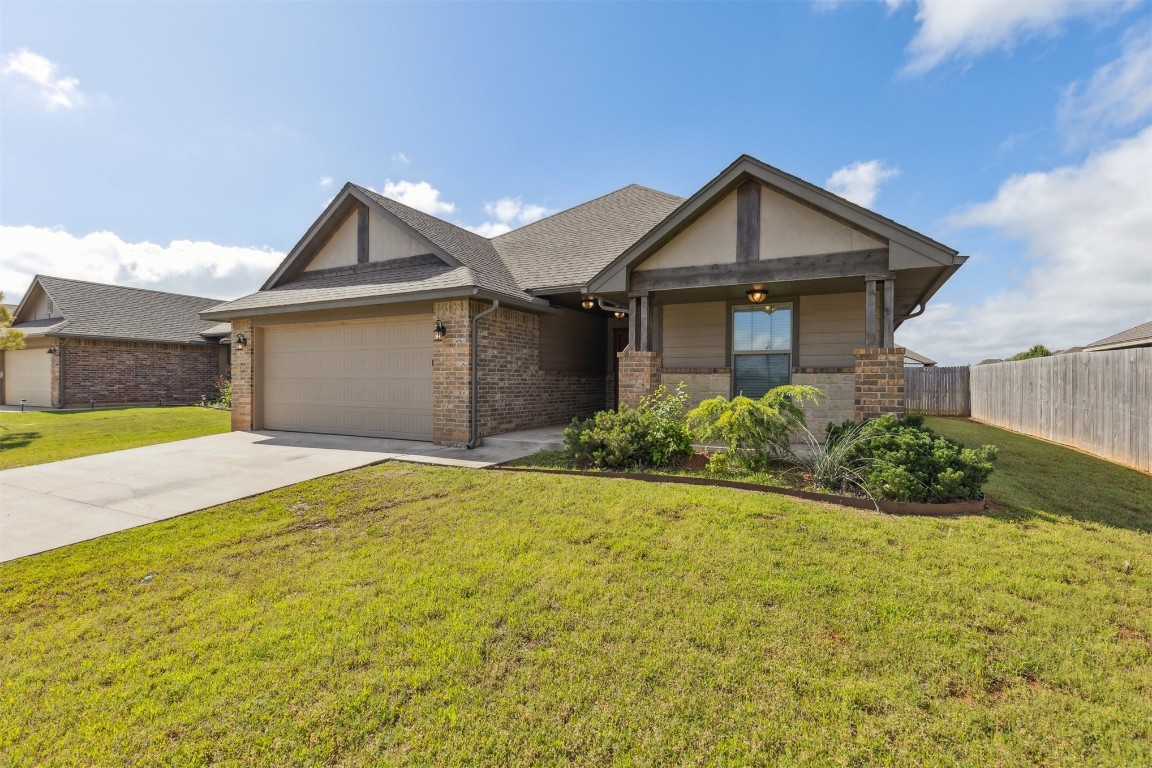
Pending
$315,000
3
bds
|
3
ba
|
0
sqft
|
built
1972
6212 N Utah Ave, Oklahoma City, OK 73112
$-639
Cash flow
-10.6%
Cash-on-Cash Return
3.9%
Cap rate
0.6%
Rent to Value Ratio
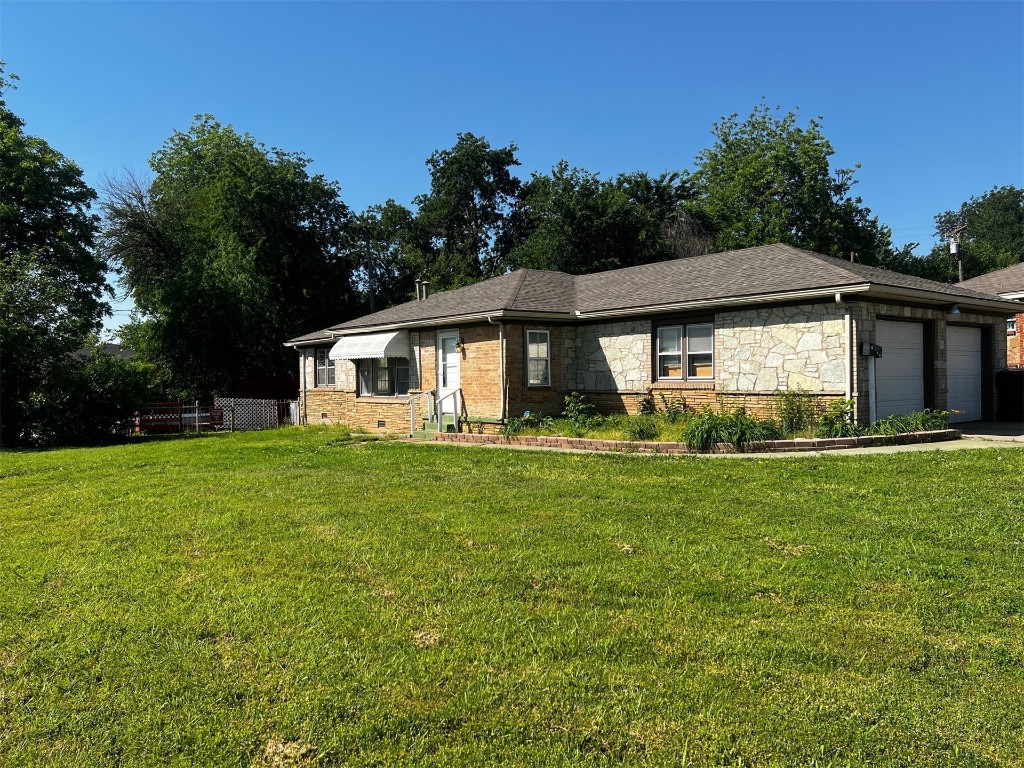
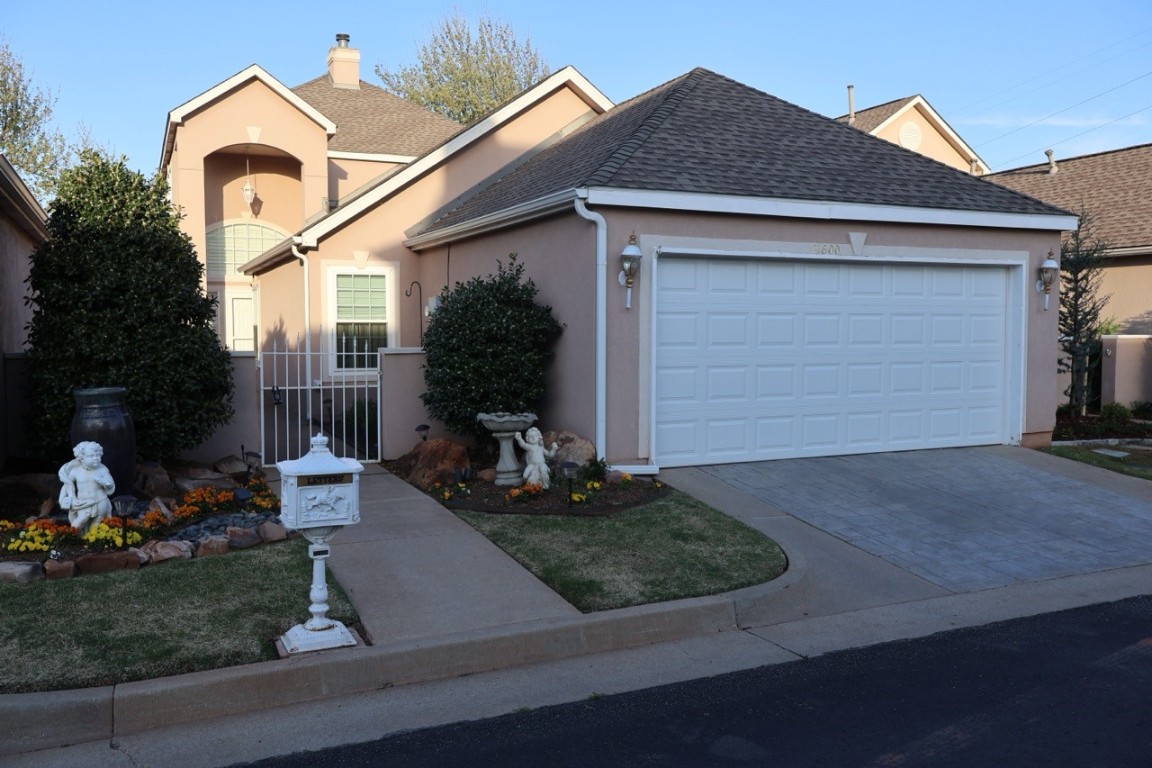
Active
$191,555
3
bds
|
1
ba
|
0
sqft
|
built
1953
3500 NW 14th St, Oklahoma City, OK 73107
$-226
Cash flow
-6.2%
Cash-on-Cash Return
4.9%
Cap rate
0.7%
Rent to Value Ratio
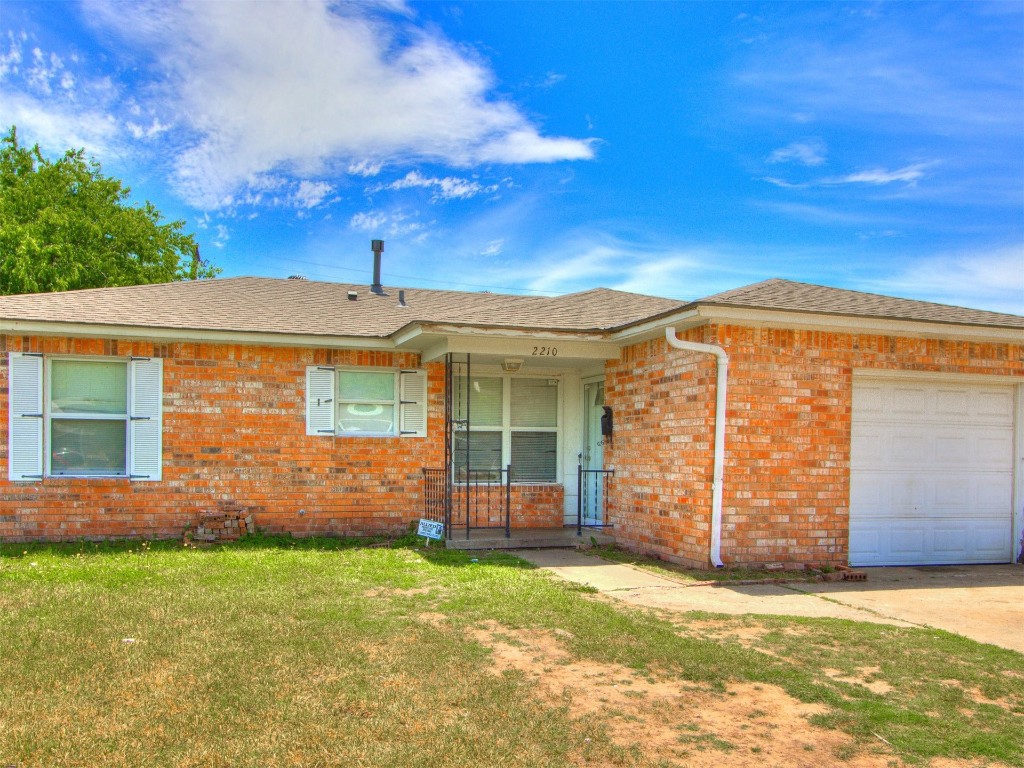
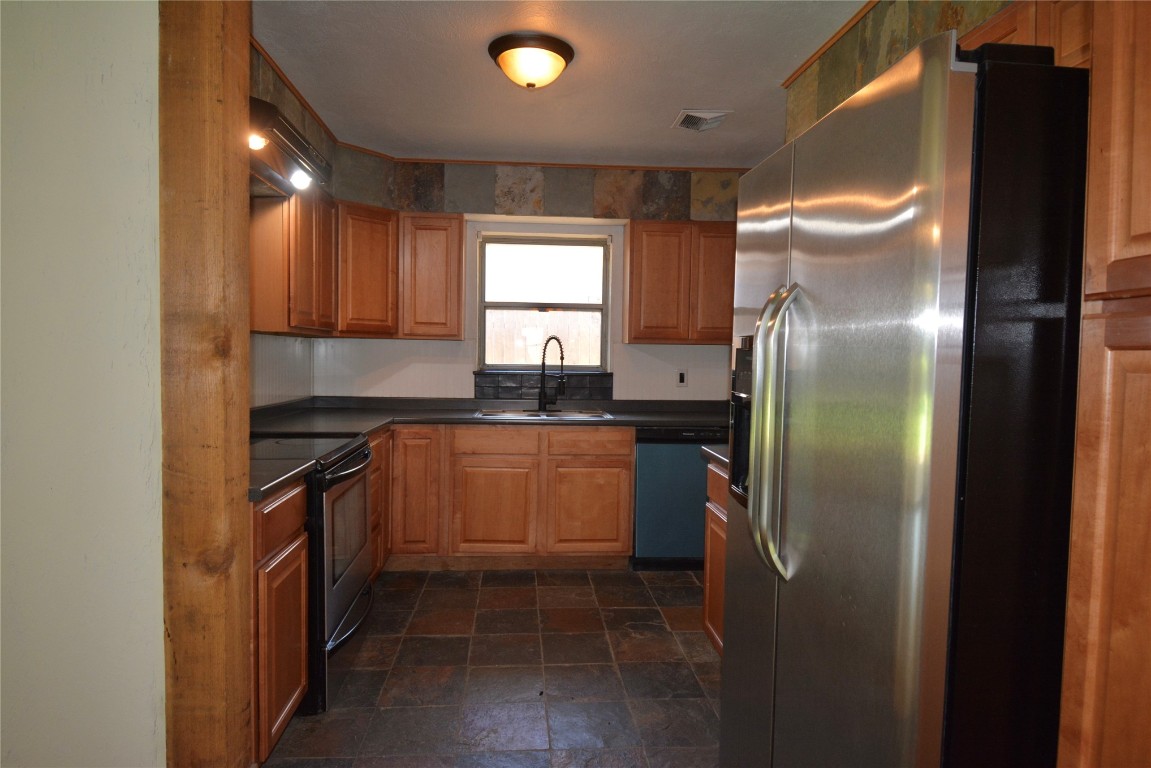
Active
$158,900
3
bds
|
1
ba
|
0
sqft
|
built
1958
2210 SW 52nd St, Oklahoma City, OK 73119
$53
Cash flow
1.7%
Cash-on-Cash Return
6.7%
Cap rate
0.9%
Rent to Value Ratio
Active
$224,900
3
bds
|
1
ba
|
0
sqft
|
built
1921
2115 NW 15th St, Oklahoma City, OK 73107
$-230
Cash flow
-5.3%
Cash-on-Cash Return
5.1%
Cap rate
0.7%
Rent to Value Ratio
Active
$195,000
2
bds
|
1
ba
|
0
sqft
|
built
1910
1518 NW 8th St, Oklahoma City, OK 73106
$-290
Cash flow
-7.8%
Cash-on-Cash Return
4.5%
Cap rate
0.6%
Rent to Value Ratio
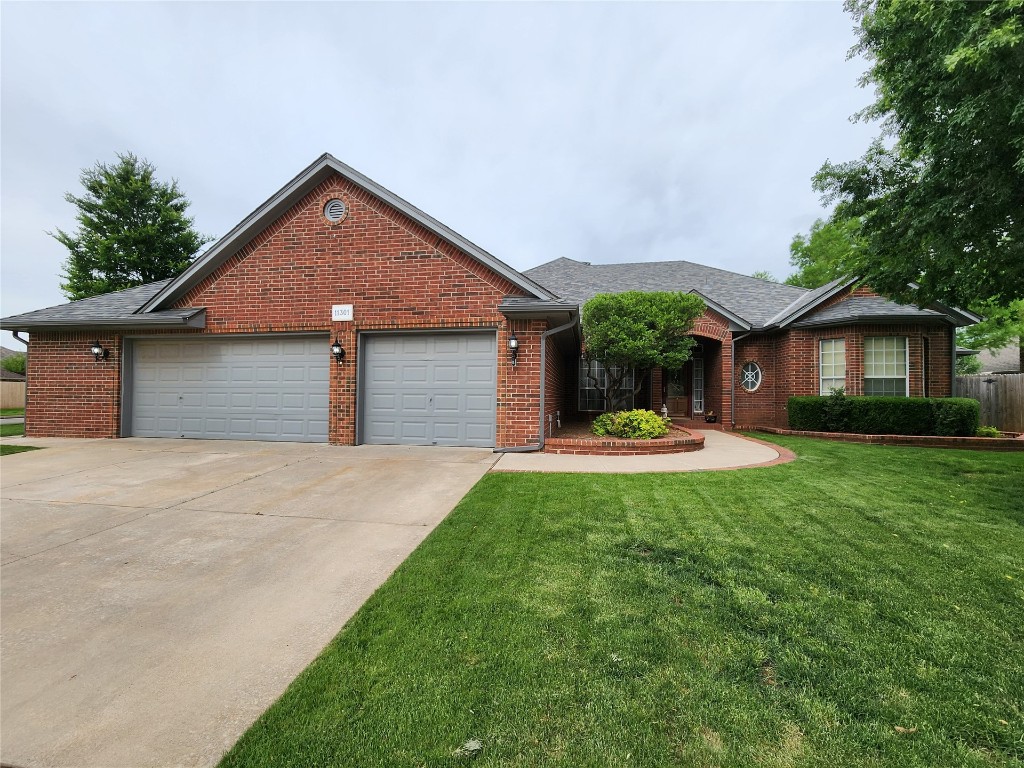
Active
$410,000
4
bds
|
3
ba
|
0
sqft
|
built
1993
11301 Brockton Pl, Oklahoma City, OK 73162
$-846
Cash flow
-10.8%
Cash-on-Cash Return
3.8%
Cap rate
0.6%
Rent to Value Ratio
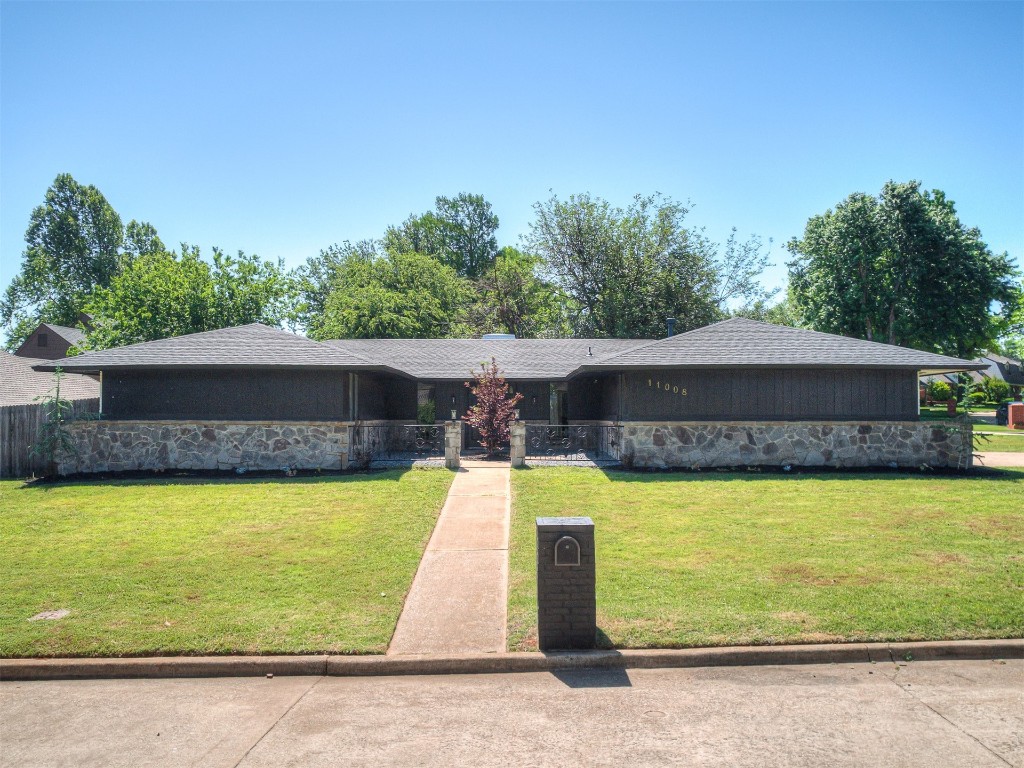
Active
$373,900
3
bds
|
2
ba
|
0
sqft
|
built
1968
11008 Blue Sage Rd, Oklahoma City, OK 73120
$-493
Cash flow
-6.9%
Cash-on-Cash Return
4.7%
Cap rate
0.7%
Rent to Value Ratio
Active
$299,000
3
bds
|
2
ba
|
0
sqft
|
built
1950
1738 Westchester Dr, Oklahoma City, OK 73120
$-446
Cash flow
-7.8%
Cash-on-Cash Return
4.5%
Cap rate
0.6%
Rent to Value Ratio
Active
$317,500
4
bds
|
2
ba
|
0
sqft
|
built
1950
4620 SE 139th St, Oklahoma City, OK 73165
$-461
Cash flow
-7.6%
Cash-on-Cash Return
4.5%
Cap rate
0.6%
Rent to Value Ratio
Active
$341,000
2
bds
|
2
ba
|
0
sqft
|
built
1955
4432 Woodland Dr, Oklahoma City, OK 73105
$-617
Cash flow
-9.4%
Cash-on-Cash Return
4.1%
Cap rate
0.6%
Rent to Value Ratio
Active
$385,000
3
bds
|
2
ba
|
0
sqft
|
built
2017
6812 NW 149th St, Oklahoma City, OK 73142
$-754
Cash flow
-10.2%
Cash-on-Cash Return
3.9%
Cap rate
0.6%
Rent to Value Ratio
Active
$275,000
4
bds
|
2
ba
|
0
sqft
|
built
1992
6613 NW 131st St, Oklahoma City, OK 73142
$-465
Cash flow
-8.8%
Cash-on-Cash Return
4.3%
Cap rate
0.7%
Rent to Value Ratio
Active
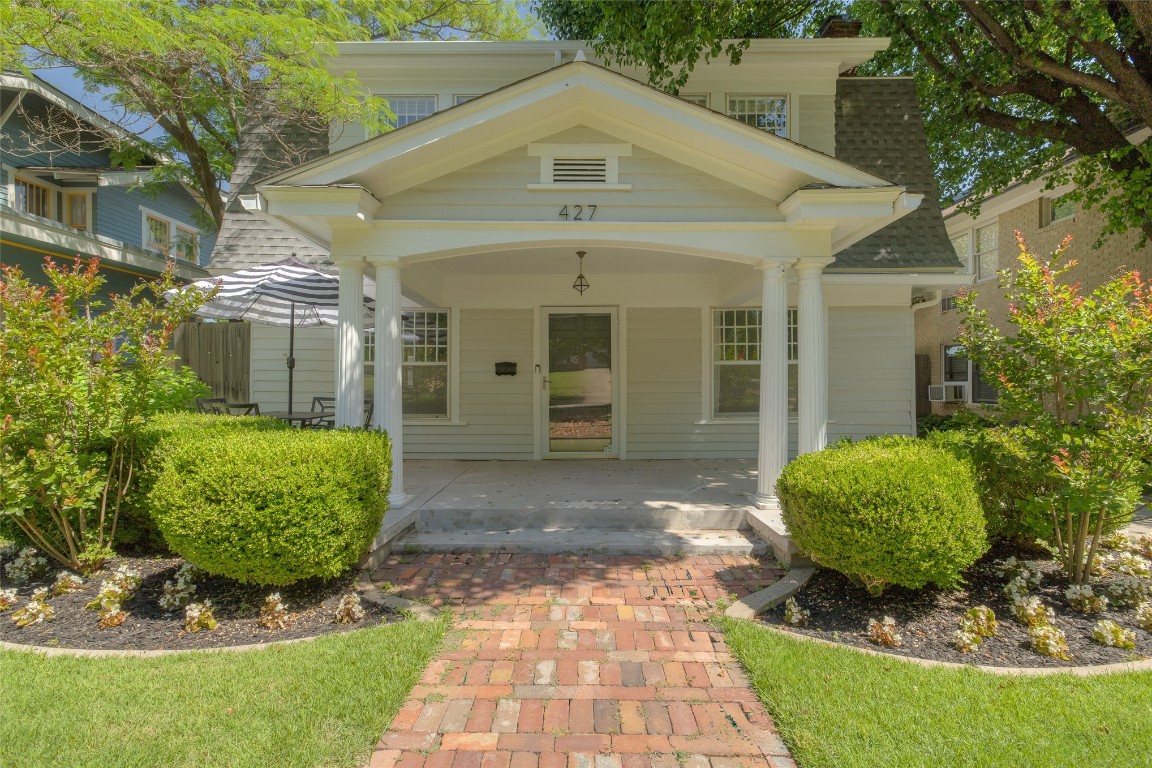
$530,000
3
bds
|
3
ba
|
0
sqft
|
built
1923
427 NW 22nd St, Oklahoma City, OK 73103
$-1,576
Cash flow
-15.5%
Cash-on-Cash Return
2.7%
Cap rate
0.4%
Rent to Value Ratio
Active
$209,000
3
bds
|
2
ba
|
0
sqft
|
built
1965
6805 Saint Marys Cir, Oklahoma City, OK 73132
$-161
Cash flow
-4.0%
Cash-on-Cash Return
5.4%
Cap rate
0.8%
Rent to Value Ratio
Active
$177,500
3
bds
|
1
ba
|
0
sqft
|
built
1952
1436 NW 97th St, Oklahoma City, OK 73114
$-185
Cash flow
-5.4%
Cash-on-Cash Return
5.0%
Cap rate
0.7%
Rent to Value Ratio
Active
$646,000
4
bds
|
3
ba
|
0
sqft
|
built
2007
11800 Pamalos Trl, Oklahoma City, OK 73173
$-1,738
Cash flow
-14.0%
Cash-on-Cash Return
3.1%
Cap rate
0.5%
Rent to Value Ratio
Active
$195,000
3
bds
|
1
ba
|
0
sqft
|
built
1950
3804 NW 19th St, Oklahoma City, OK 73107
$-239
Cash flow
-6.4%
Cash-on-Cash Return
4.8%
Cap rate
0.7%
Rent to Value Ratio

Active
$5,600,000
6
bds
|
9
ba
|
0
sqft
|
built
1931
2203 E Wilshire Blvd, Oklahoma City, OK 73111
$-30,041
Cash flow
-28.0%
Cash-on-Cash Return
-0.2%
Cap rate
0.1%
Rent to Value Ratio
Active
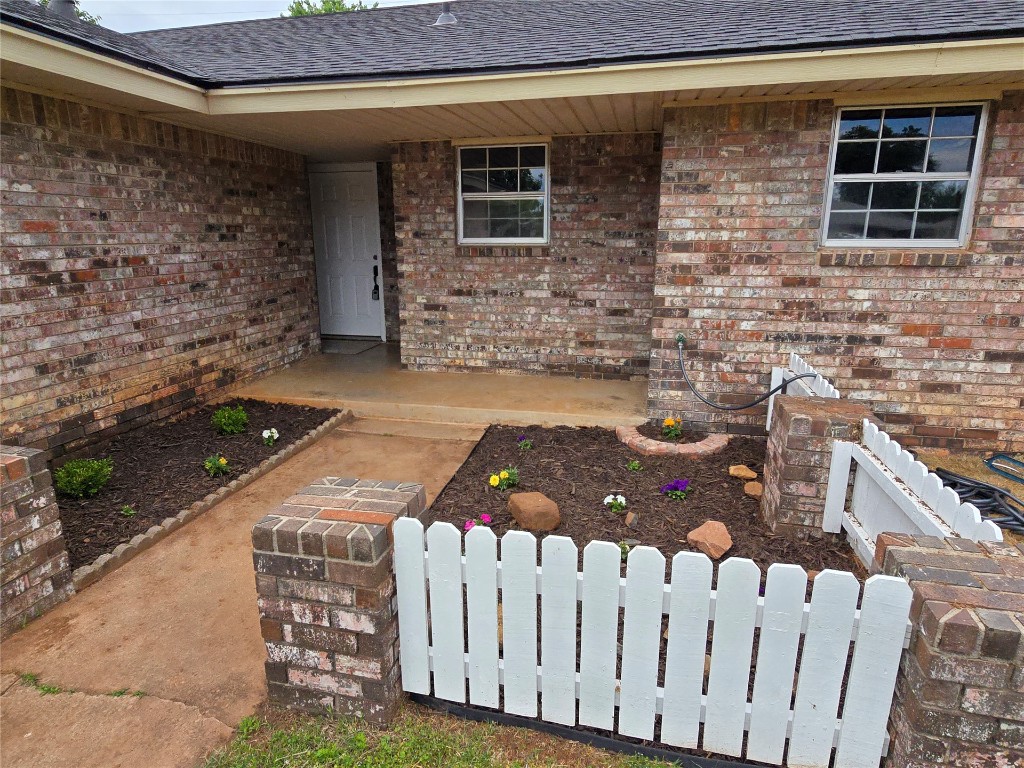
$179,900
3
bds
|
2
ba
|
0
sqft
|
built
1966
1444 N Bradley Ave, Oklahoma City, OK 73127
$-127
Cash flow
-3.7%
Cash-on-Cash Return
5.4%
Cap rate
0.8%
Rent to Value Ratio
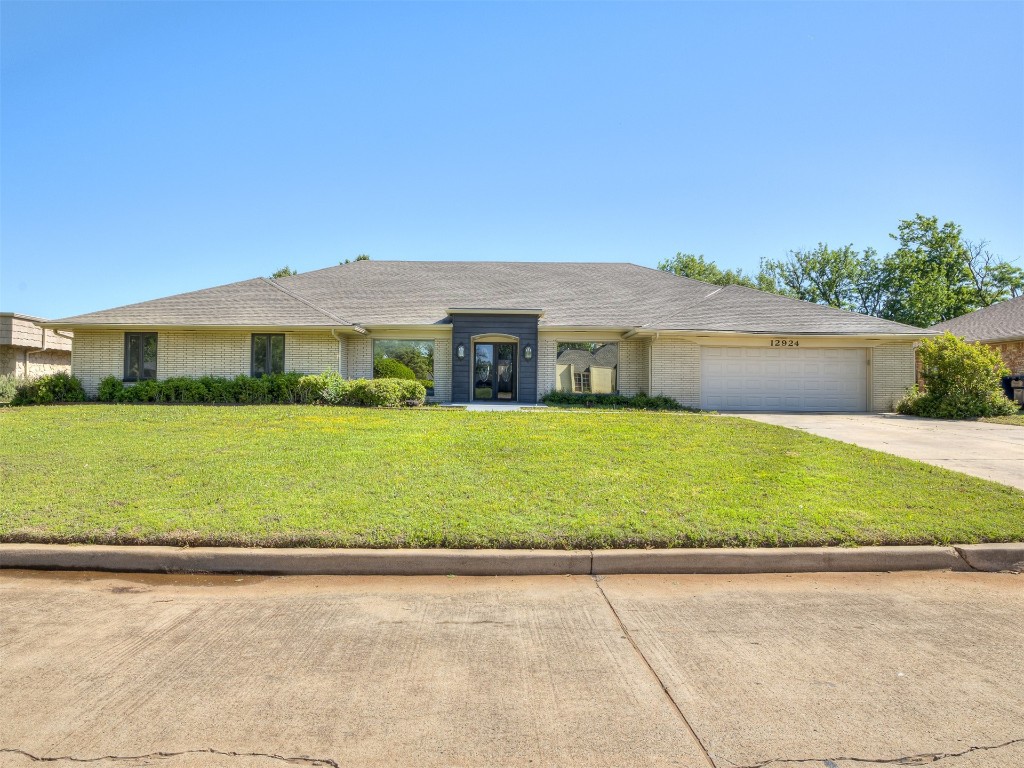
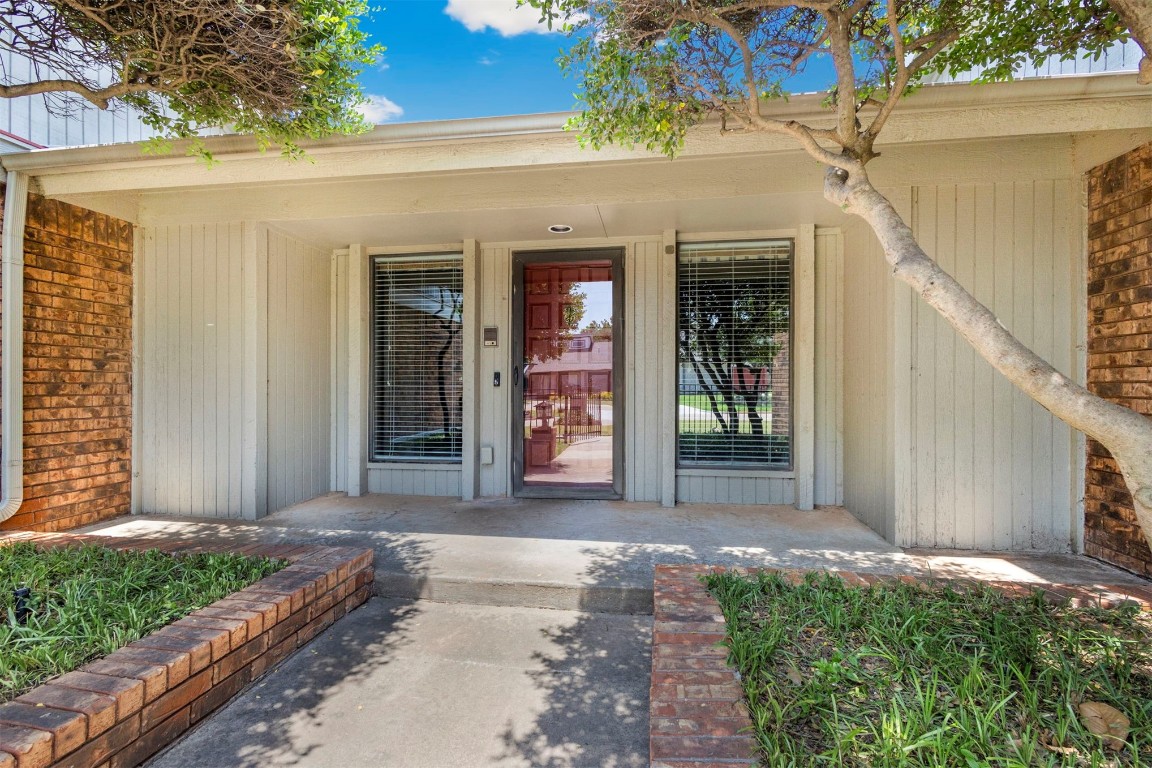
Active
$447,900
4
bds
|
3
ba
|
0
sqft
|
built
1972
12924 Green Valley Dr, Oklahoma City, OK 73120
$-461
Cash flow
-5.4%
Cash-on-Cash Return
5.1%
Cap rate
0.7%
Rent to Value Ratio
Active
$329,000
3
bds
|
3
ba
|
0
sqft
|
built
1982
12900 Burlingame Ave, Oklahoma City, OK 73120
$-294
Cash flow
-4.7%
Cash-on-Cash Return
5.2%
Cap rate
0.8%
Rent to Value Ratio
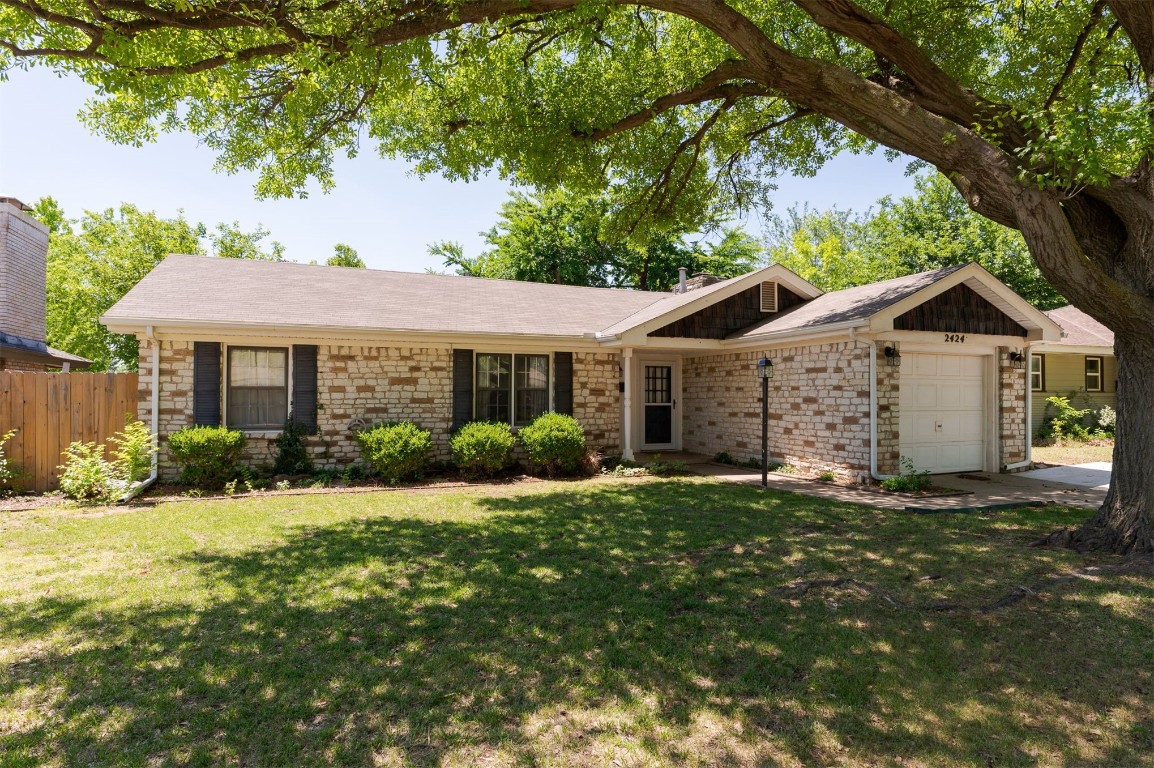
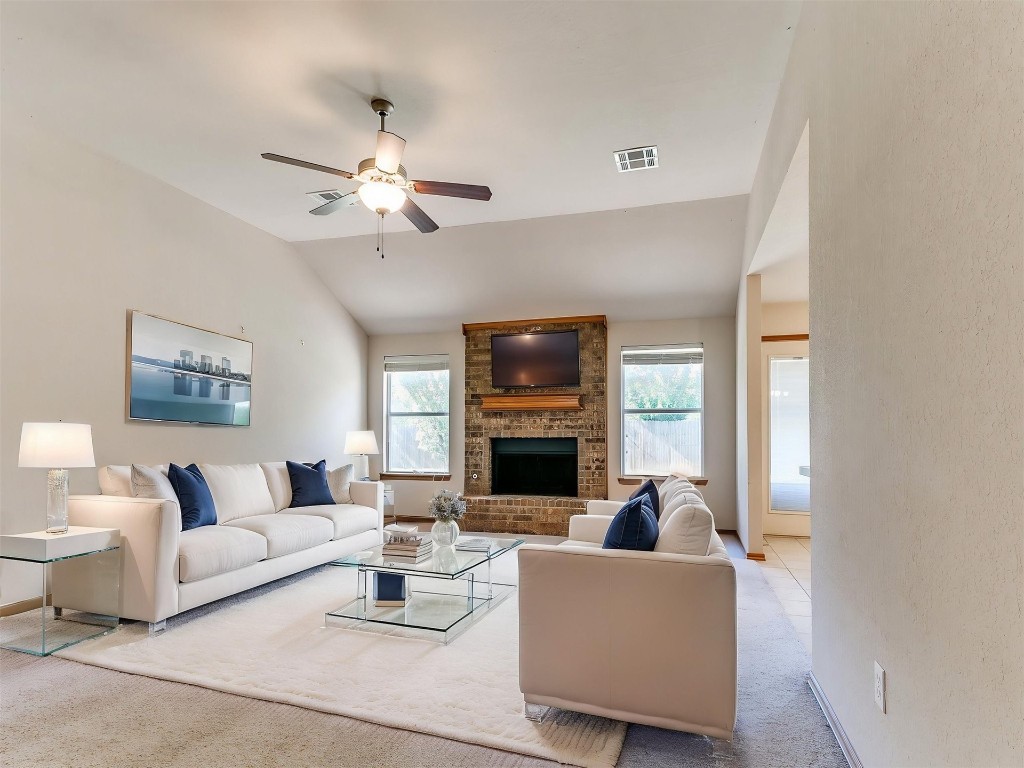
Active
$239,900
3
bds
|
1
ba
|
0
sqft
|
built
1953
2424 Ashley Dr, Oklahoma City, OK 73120
$-275
Cash flow
-6.0%
Cash-on-Cash Return
4.9%
Cap rate
0.8%
Rent to Value Ratio
Active
$280,000
3
bds
|
2
ba
|
0
sqft
|
built
2008
8233 Greer Way, Oklahoma City, OK 73132
$-460
Cash flow
-8.6%
Cash-on-Cash Return
4.3%
Cap rate
0.6%
Rent to Value Ratio
Active
$365,000
3
bds
|
3
ba
|
0
sqft
|
built
1965
6709 Reed Dr, Oklahoma City, OK 73116
$-743
Cash flow
-10.6%
Cash-on-Cash Return
3.8%
Cap rate
0.6%
Rent to Value Ratio
Active
$174,900
3
bds
|
1
ba
|
0
sqft
|
built
1917
1629 W Park Pl, Oklahoma City, OK 73106
$61
Cash flow
1.8%
Cash-on-Cash Return
6.7%
Cap rate
0.9%
Rent to Value Ratio
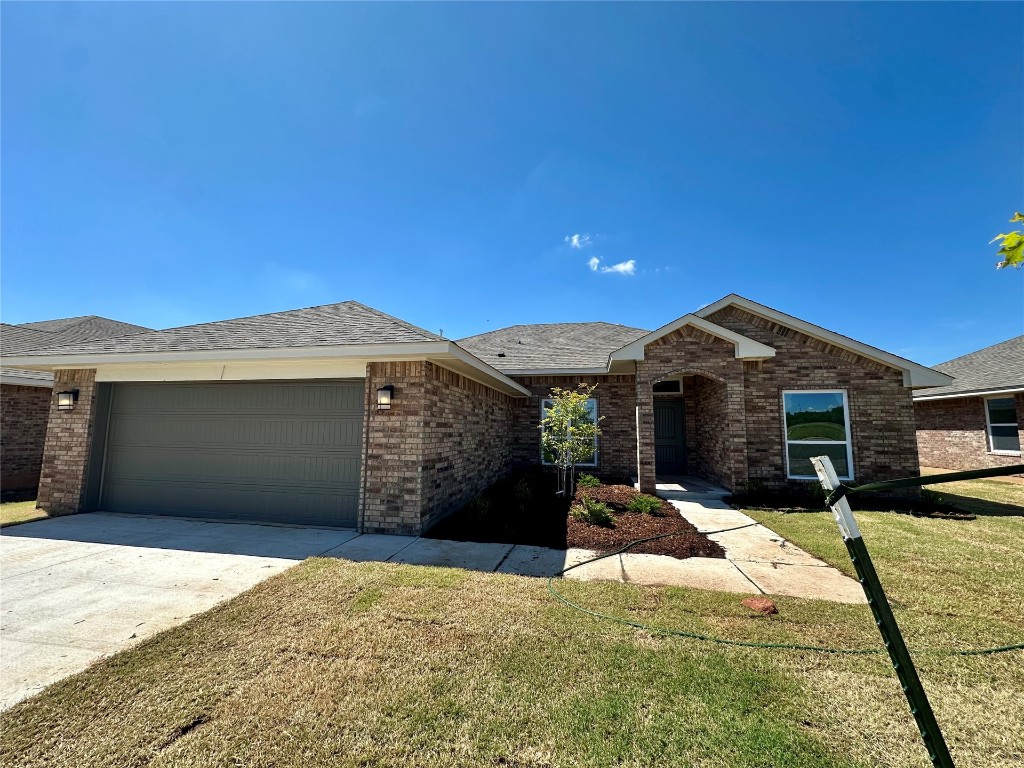
Active
$299,990
3
bds
|
2
ba
|
0
sqft
|
built
2025
8617 NW 77th Pl, Oklahoma City, OK 73132
$129
Cash flow
2.2%
Cash-on-Cash Return
6.8%
Cap rate
0.8%
Rent to Value Ratio
Active
$1,350,000
3
bds
|
4
ba
|
0
sqft
|
built
2000
15032 Gaillardia Dr, Oklahoma City, OK 73142
$-6,541
Cash flow
-25.3%
Cash-on-Cash Return
0.5%
Cap rate
0.3%
Rent to Value Ratio

Active
$261,000
3
bds
|
3
ba
|
0
sqft
|
built
1968
5708 NW 87th St, Oklahoma City, OK 73132
$-367
Cash flow
-7.3%
Cash-on-Cash Return
4.6%
Cap rate
0.7%
Rent to Value Ratio
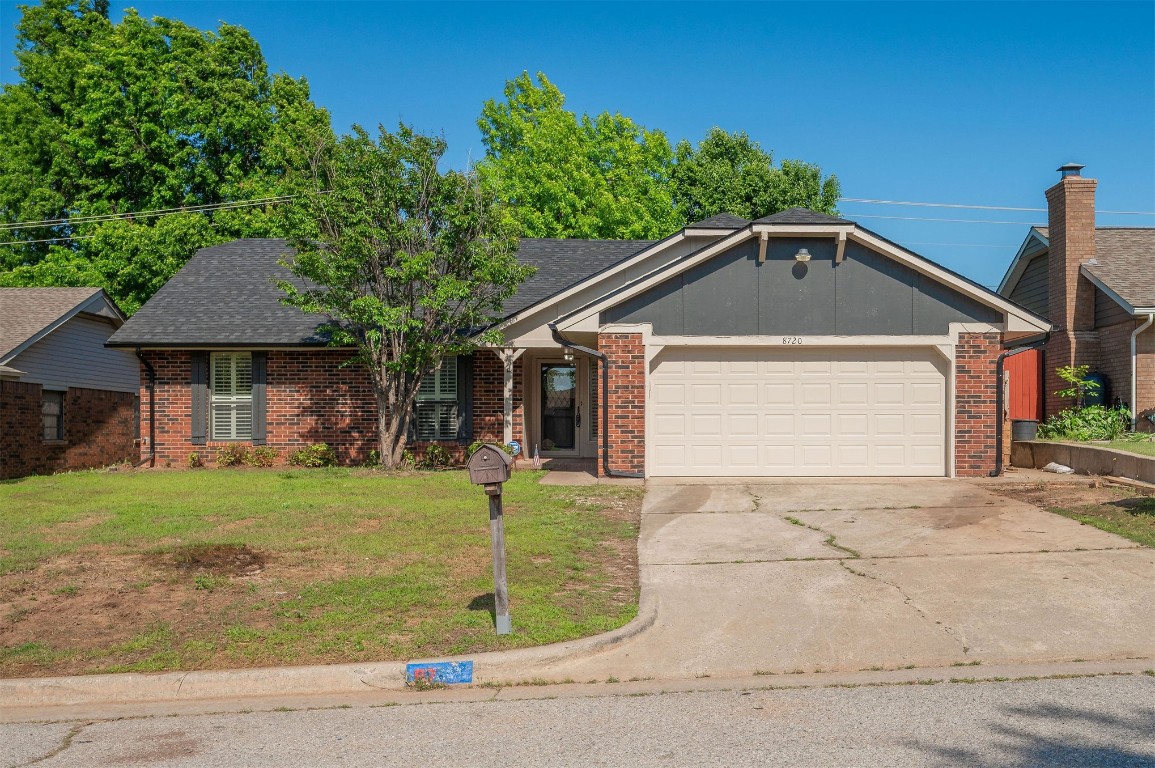
Active
$230,000
3
bds
|
2
ba
|
0
sqft
|
built
1977
8720 Raven Ave, Oklahoma City, OK 73132
$-171
Cash flow
-3.9%
Cash-on-Cash Return
5.4%
Cap rate
0.8%
Rent to Value Ratio
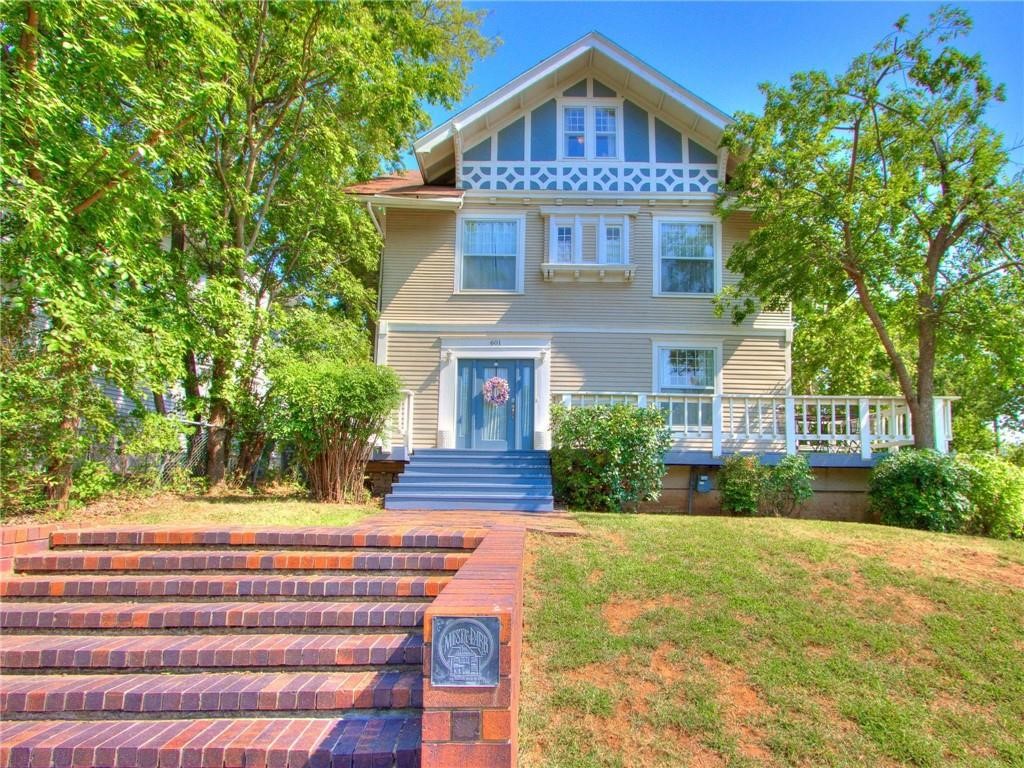
Active
$549,000
4
bds
|
4
ba
|
0
sqft
|
built
1909
601 NW 17th St, Oklahoma City, OK 73103
$-1,160
Cash flow
-11.0%
Cash-on-Cash Return
3.7%
Cap rate
0.6%
Rent to Value Ratio
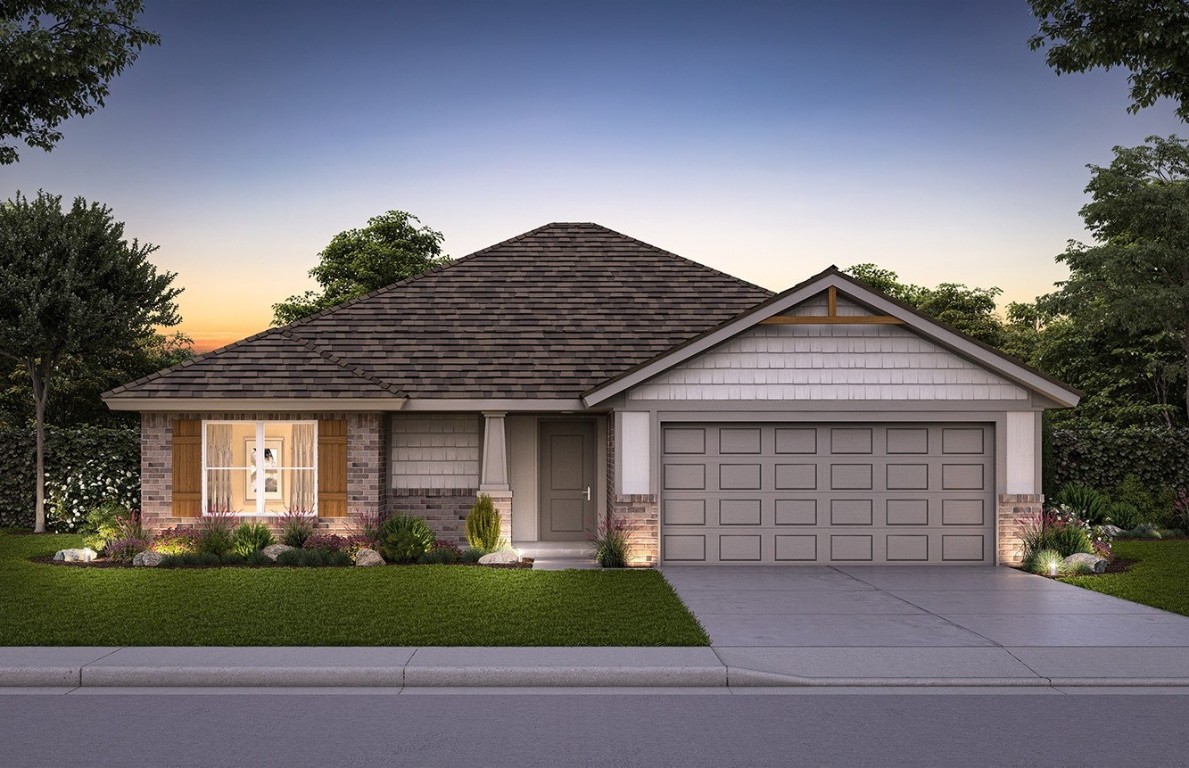
Active
$336,990
3
bds
|
2
ba
|
0
sqft
|
built
2025
8620 SW 75th St, Oklahoma City, OK 73169
$-272
Cash flow
-4.2%
Cash-on-Cash Return
5.3%
Cap rate
0.7%
Rent to Value Ratio
Active
$297,206
3
bds
|
2
ba
|
0
sqft
|
built
2025
8517 SW 76th St, Oklahoma City, OK 73169
$-201
Cash flow
-3.5%
Cash-on-Cash Return
5.5%
Cap rate
0.7%
Rent to Value Ratio
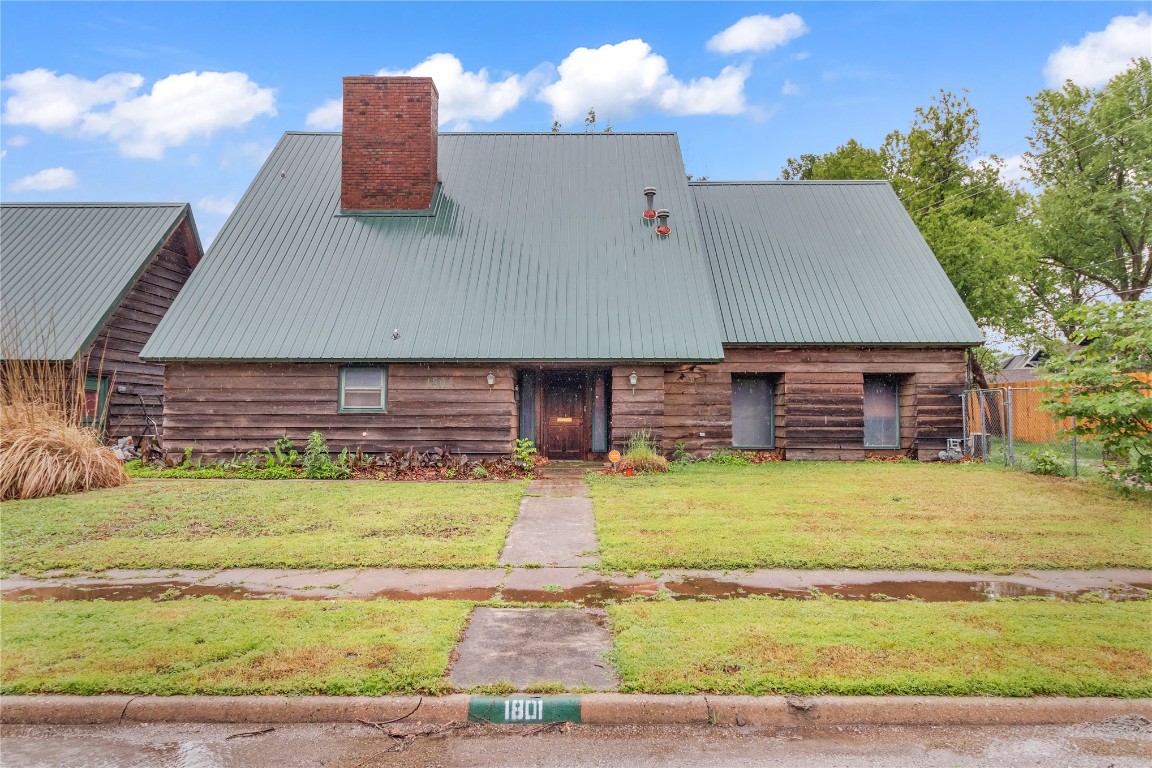
Active
$349,000
4
bds
|
2
ba
|
0
sqft
|
built
1978
1801 N Land Ave, Oklahoma City, OK 73107
$-499
Cash flow
-7.5%
Cash-on-Cash Return
4.6%
Cap rate
0.7%
Rent to Value Ratio
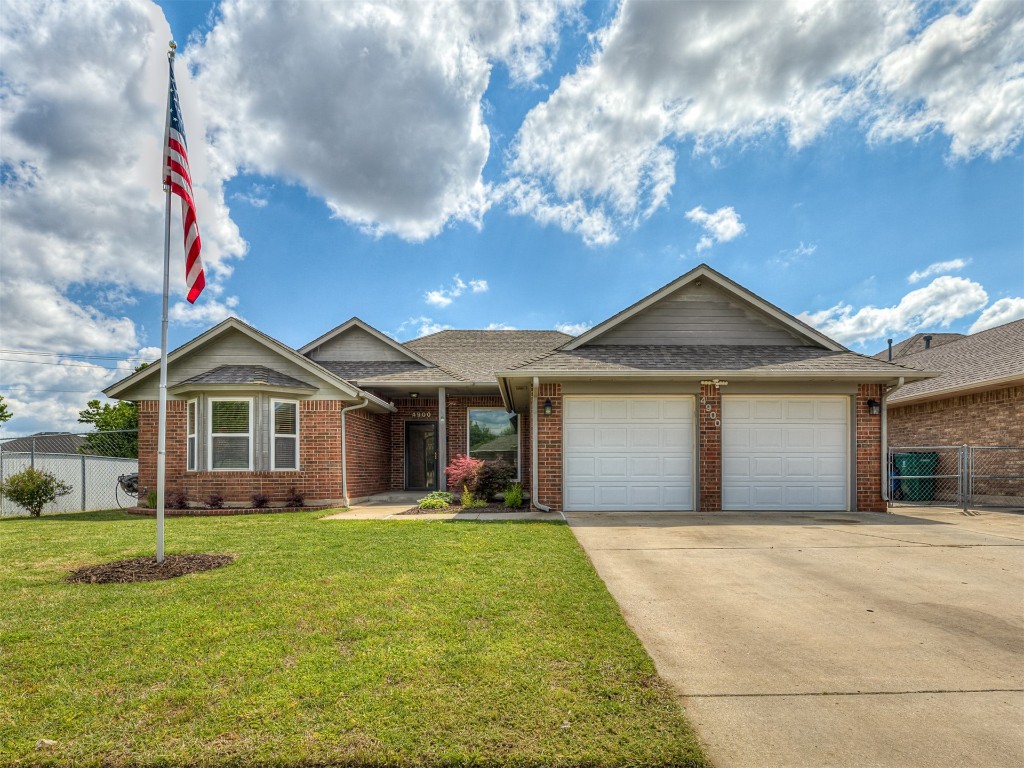
Active
$229,900
3
bds
|
2
ba
|
0
sqft
|
built
1999
4900 Republic Dr, Oklahoma City, OK 73135
$-373
Cash flow
-8.5%
Cash-on-Cash Return
4.3%
Cap rate
0.7%
Rent to Value Ratio
Active
$345,385
3
bds
|
2
ba
|
0
sqft
|
built
2025
8613 SW 76th St, Oklahoma City, OK 73169
$-730
Cash flow
-11.0%
Cash-on-Cash Return
3.7%
Cap rate
0.5%
Rent to Value Ratio
Active
$259,900
3
bds
|
2
ba
|
0
sqft
|
built
2017
8736 SW 38th St, Oklahoma City, OK 73179
$-396
Cash flow
-7.9%
Cash-on-Cash Return
4.5%
Cap rate
0.7%
Rent to Value Ratio
Active
$299,500
2
bds
|
2
ba
|
0
sqft
|
built
1996
11600 Haven Way, Oklahoma City, OK 73120
$-421
Cash flow
-7.3%
Cash-on-Cash Return
4.6%
Cap rate
0.7%
Rent to Value Ratio
Active
$198,999
3
bds
|
1
ba
|
0
sqft
|
built
1955
3708 NW 59th St, Oklahoma City, OK 73112
$-113
Cash flow
-3.0%
Cash-on-Cash Return
5.6%
Cap rate
0.8%
Rent to Value Ratio
Active
$253,500
4
bds
|
3
ba
|
0
sqft
|
built
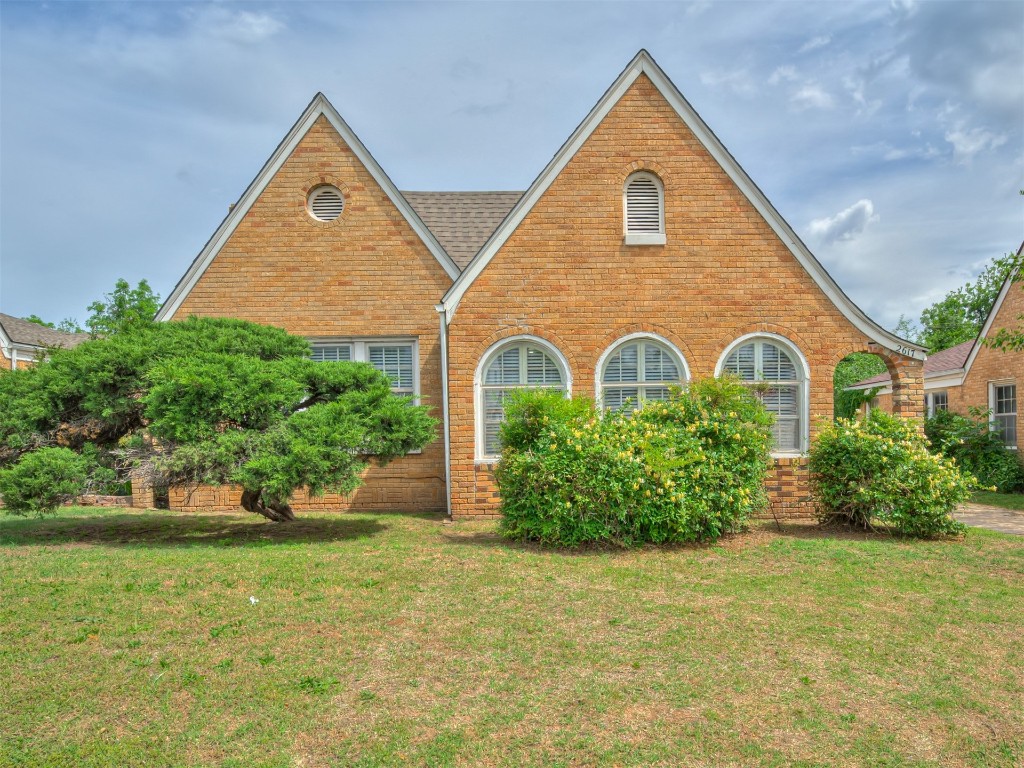
1933
2617 NW 23rd St, Oklahoma City, OK 73107
$-283
Cash flow
-5.8%
Cash-on-Cash Return
4.9%
Cap rate
0.7%
Rent to Value Ratio
Pending
$205,000
2
bds
|
1
ba
|
0
sqft
|
built
1932
3405 NW 22nd St, Oklahoma City, OK 73107
$-129
Cash flow
-3.3%
Cash-on-Cash Return
5.5%
Cap rate
0.7%
Rent to Value Ratio