Oklahoma City, OK Investment Properties for Sale
Browse homes for sale and investment properties in Oklahoma City, OK. Refine your search by price, property type, or more.
Best cash flowing properties in Oklahoma City, OK

Active
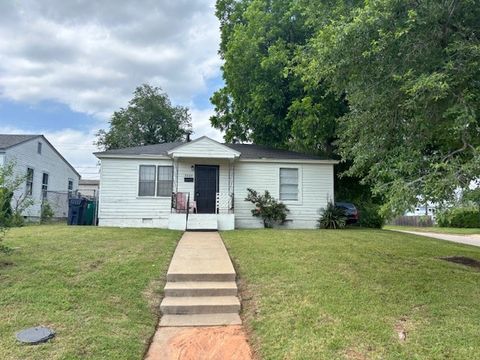
$70,000
2
bds
|
1
ba
|
0
sqft
|
built
1940
516 SW 46th St, Oklahoma City, OK 73109
$702
Cash flow
11.7%
Cash-on-Cash Return
12.0%
Cap rate
1.6%
Rent to Value Ratio

Active
$149,999
3
bds
|
1
ba
|
0
sqft
|
built
1954
1619 SE 63rd St, Oklahoma City, OK 73149
$276
Cash flow
9.6%
Cash-on-Cash Return
7.9%
Cap rate
1.0%
Rent to Value Ratio
1,430 out of 1,810 properties for sale in Oklahoma City, OK
Limited Results Shown
Create a free account, or log in to reveal all property listings and enjoy the complete experience.
Active
$97,000
3
bds
|
1
ba
|
0
sqft
|
built
1953
3229 NE 14th Pl, Oklahoma City, OK 73117
$198
Cash flow
10.6%
Cash-on-Cash Return
8.1%
Cap rate
1.0%
Rent to Value Ratio
Active
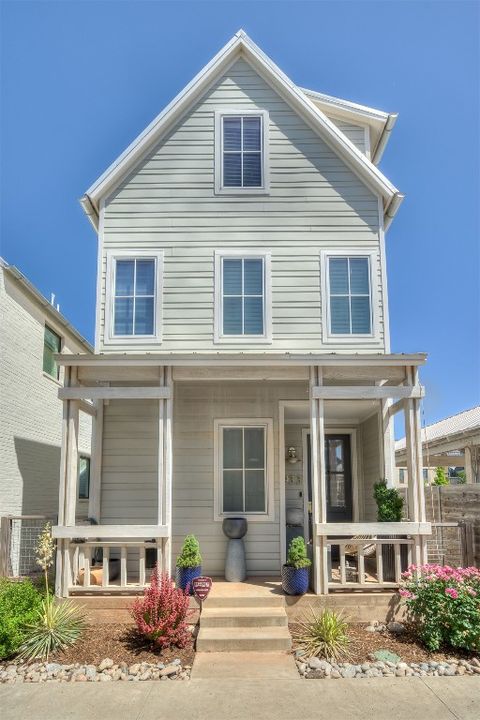
$422,499
4
bds
|
2
ba
|
0
sqft
|
built
2019
933 Pedalers Ln, Oklahoma City, OK 73108
$-1,069
Cash flow
-13.2%
Cash-on-Cash Return
2.6%
Cap rate
0.5%
Rent to Value Ratio
Active
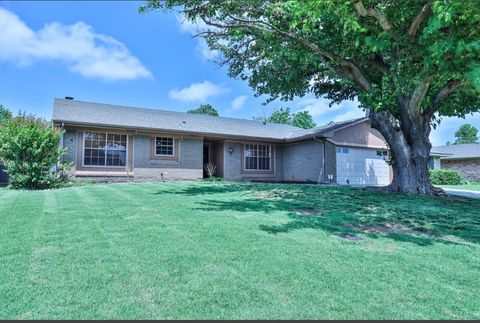
$265,000
4
bds
|
2
ba
|
0
sqft
|
built
1975
11621 Kings Cir, Oklahoma City, OK 73162
$-113
Cash flow
-2.2%
Cash-on-Cash Return
5.2%
Cap rate
0.8%
Rent to Value Ratio
Active
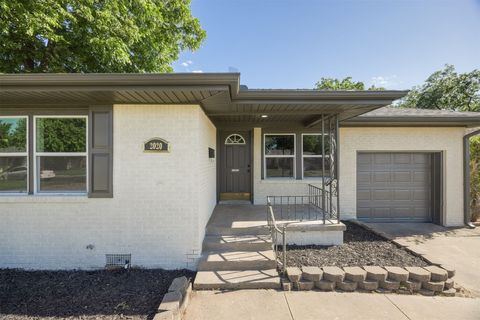
$299,900
4
bds
|
2
ba
|
0
sqft
|
built
1950
2020 Hasley Dr, Oklahoma City, OK 73120
$-598
Cash flow
-10.4%
Cash-on-Cash Return
3.3%
Cap rate
0.5%
Rent to Value Ratio
Active
$315,000
3
bds
|
2
ba
|
0
sqft
|
built
2004
17009 Picasso Dr, Oklahoma City, OK 73170
$-459
Cash flow
-7.6%
Cash-on-Cash Return
3.9%
Cap rate
0.6%
Rent to Value Ratio
Active
$330,900
3
bds
|
3
ba
|
0
sqft
|
built
1961
1908 NW 56th Ter, Oklahoma City, OK 73118
$-466
Cash flow
-7.3%
Cash-on-Cash Return
4.0%
Cap rate
0.6%
Rent to Value Ratio
Active
$199,900
2
bds
|
1
ba
|
0
sqft
|
built
1949
2748 Lancaster Ln, Oklahoma City, OK 73116
$-173
Cash flow
-4.5%
Cash-on-Cash Return
4.6%
Cap rate
0.7%
Rent to Value Ratio
Active
$139,000
3
bds
|
1
ba
|
0
sqft
|
built
1954
2921 SW 48th St, Oklahoma City, OK 73119
$77
Cash flow
2.9%
Cash-on-Cash Return
6.3%
Cap rate
0.9%
Rent to Value Ratio
Active
$275,000
4
bds
|
2
ba
|
0
sqft
|
built
1979
8116 NW 82nd St, Oklahoma City, OK 73132
$-174
Cash flow
-3.3%
Cash-on-Cash Return
4.9%
Cap rate
0.7%
Rent to Value Ratio
Active
$275,000
3
bds
|
2
ba
|
0
sqft
|
built
1982
8201 Canna Ln, Oklahoma City, OK 73132
$-245
Cash flow
-4.6%
Cash-on-Cash Return
4.6%
Cap rate
0.7%
Rent to Value Ratio

Active
$135,000
2
bds
|
2
ba
|
0
sqft
|
built
1982
1202 SW 77th Ter, Oklahoma City, OK 73139
$34
Cash flow
1.3%
Cash-on-Cash Return
6.0%
Cap rate
0.8%
Rent to Value Ratio

Active
$289,000
4
bds
|
2
ba
|
0
sqft
|
built
1982
7905 Debar Cir, Oklahoma City, OK 73132
$-494
Cash flow
-8.9%
Cash-on-Cash Return
3.6%
Cap rate
0.6%
Rent to Value Ratio

Active
$289,000
4
bds
|
4
ba
|
0
sqft
|
built
1981
7909 Harvest Moon Rd, Oklahoma City, OK 73132
$-498
Cash flow
-9.0%
Cash-on-Cash Return
3.6%
Cap rate
0.6%
Rent to Value Ratio
Active
$415,000
3
bds
|
3
ba
|
0
sqft
|
built
2022
6504 NW 148th St, Oklahoma City, OK 73142
$-518
Cash flow
-6.5%
Cash-on-Cash Return
4.2%
Cap rate
0.7%
Rent to Value Ratio

Active
$289,000
4
bds
|
4
ba
|
0
sqft
|
built
1982
7905 Harvest Moon Rd, Oklahoma City, OK 73132
$-505
Cash flow
-9.1%
Cash-on-Cash Return
3.6%
Cap rate
0.6%
Rent to Value Ratio
Active
$265,000
4
bds
|
2
ba
|
0
sqft
|
built
1977
8813 Aaron Dr, Oklahoma City, OK 73132
$-166
Cash flow
-3.3%
Cash-on-Cash Return
4.9%
Cap rate
0.7%
Rent to Value Ratio

Active
$289,000
4
bds
|
4
ba
|
0
sqft
|
built
1981
7913 Harvest Moon Rd, Oklahoma City, OK 73132
$-500
Cash flow
-9.0%
Cash-on-Cash Return
3.6%
Cap rate
0.6%
Rent to Value Ratio
Active
$245,000
3
bds
|
2
ba
|
0
sqft
|
built
2020
616 SW 23rd St, Oklahoma City, OK 73109
$-229
Cash flow
-4.9%
Cash-on-Cash Return
4.6%
Cap rate
0.7%
Rent to Value Ratio

Active
$289,000
4
bds
|
4
ba
|
0
sqft
|
built
1982
7903 Debar Cir, Oklahoma City, OK 73132
$-503
Cash flow
-9.1%
Cash-on-Cash Return
3.6%
Cap rate
0.6%
Rent to Value Ratio

Active
$239,900
3
bds
|
2
ba
|
0
sqft
|
built
1950
2100 Hasley Dr, Oklahoma City, OK 73120
$-162
Cash flow
-3.5%
Cash-on-Cash Return
4.9%
Cap rate
0.8%
Rent to Value Ratio
Active
$475,000
3
bds
|
3
ba
|
0
sqft
|
built
2018
10716 Quail Reserve Rd, Oklahoma City, OK 73173
$-621
Cash flow
-6.8%
Cash-on-Cash Return
4.1%
Cap rate
0.7%
Rent to Value Ratio
Active
$148,000
2
bds
|
3
ba
|
0
sqft
|
built
1982
4400 Hemingway Dr, Oklahoma City, OK 73118
$-220
Cash flow
-7.8%
Cash-on-Cash Return
3.9%
Cap rate
0.9%
Rent to Value Ratio
Active
$399,000
3
bds
|
2
ba
|
0
sqft
|
built
1962
3205 NW 54th Cir, Oklahoma City, OK 73112
$-654
Cash flow
-8.6%
Cash-on-Cash Return
3.7%
Cap rate
0.6%
Rent to Value Ratio
Active
$275,000
3
bds
|
2
ba
|
0
sqft
|
built
1936
2321 NW 25th St, Oklahoma City, OK 73107
$-310
Cash flow
-5.9%
Cash-on-Cash Return
4.3%
Cap rate
0.7%
Rent to Value Ratio
Active
$749,500
3
bds
|
3
ba
|
0
sqft
|
built
1994
1101 Mc Laughlin Dr, Oklahoma City, OK 73170
$-1,668
Cash flow
-11.6%
Cash-on-Cash Return
3.0%
Cap rate
0.5%
Rent to Value Ratio

Active
$258,900
5
bds
|
3
ba
|
0
sqft
|
built
1961
1321 SW 62nd St, Oklahoma City, OK 73159
$-27
Cash flow
-0.5%
Cash-on-Cash Return
5.6%
Cap rate
0.8%
Rent to Value Ratio

Active
$228,000
3
bds
|
2
ba
|
0
sqft
|
built
1949
2109 Brighton Ave, Oklahoma City, OK 73120
$-63
Cash flow
-1.4%
Cash-on-Cash Return
5.3%
Cap rate
0.8%
Rent to Value Ratio

Active
$244,900
3
bds
|
2
ba
|
0
sqft
|
built
1983
11008 Davis St, Oklahoma City, OK 73162
$-227
Cash flow
-4.8%
Cash-on-Cash Return
4.6%
Cap rate
0.7%
Rent to Value Ratio

Active
$405,000
3
bds
|
3
ba
|
0
sqft
|
built
2004
1017 SW 107th St, Oklahoma City, OK 73170
$-3,645
Cash flow
-47.0%
Cash-on-Cash Return
-5.1%
Cap rate
0.6%
Rent to Value Ratio
Active
$1,245,000
4
bds
|
4
ba
|
0
sqft
|
built
2022
15012 Annecy Blvd, Oklahoma City, OK 73142
$-4,598
Cash flow
-19.3%
Cash-on-Cash Return
1.2%
Cap rate
0.3%
Rent to Value Ratio
Active
$2,100,000
3
bds
|
4
ba
|
0
sqft
|
built
2022
5816 Oliver Ct, Oklahoma City, OK 73142
$-7,805
Cash flow
-19.4%
Cash-on-Cash Return
1.2%
Cap rate
0.2%
Rent to Value Ratio
Active
$524,900
4
bds
|
3
ba
|
0
sqft
|
built
1955
1609 Westchester Dr, Oklahoma City, OK 73120
$-1,268
Cash flow
-12.6%
Cash-on-Cash Return
2.8%
Cap rate
0.4%
Rent to Value Ratio

Active
$189,900
3
bds
|
2
ba
|
0
sqft
|
built
1954
3032 NW 67th St, Oklahoma City, OK 73116
$-72
Cash flow
-2.0%
Cash-on-Cash Return
5.2%
Cap rate
0.8%
Rent to Value Ratio

Active
$210,000
4
bds
|
3
ba
|
0
sqft
|
built
1987
8409 Bigwood Dr, Oklahoma City, OK 73135
$-93
Cash flow
-2.3%
Cash-on-Cash Return
5.1%
Cap rate
0.8%
Rent to Value Ratio
Active
$70,000
2
bds
|
1
ba
|
0
sqft
|
built
1940
516 SW 46th St, Oklahoma City, OK 73109
$702
Cash flow
11.7%
Cash-on-Cash Return
12.0%
Cap rate
1.6%
Rent to Value Ratio

Active
$220,000
3
bds
|
3
ba
|
0
sqft
|
built
1960
1126 SW 19th St, Oklahoma City, OK 73108
$-18
Cash flow
-0.4%
Cash-on-Cash Return
5.6%
Cap rate
0.7%
Rent to Value Ratio

Active
$199,000
3
bds
|
2
ba
|
0
sqft
|
built
1951
2600 NW 34th St, Oklahoma City, OK 73112
$-1
Cash flow
0.0%
Cash-on-Cash Return
5.7%
Cap rate
0.8%
Rent to Value Ratio

Active
$219,900
3
bds
|
2
ba
|
0
sqft
|
built
1963
5737 NW 31st St, Oklahoma City, OK 73122
$-118
Cash flow
-2.8%
Cash-on-Cash Return
5.0%
Cap rate
0.7%
Rent to Value Ratio

Active
$220,000
3
bds
|
2
ba
|
0
sqft
|
built
1980
809 Wandering Way, Oklahoma City, OK 73170
$-22
Cash flow
-0.5%
Cash-on-Cash Return
5.6%
Cap rate
0.8%
Rent to Value Ratio
Active
$149,999
3
bds
|
1
ba
|
0
sqft
|
built
1954
1619 SE 63rd St, Oklahoma City, OK 73149
$276
Cash flow
9.6%
Cash-on-Cash Return
7.9%
Cap rate
1.0%
Rent to Value Ratio