Olive Branch, MS Investment Properties for Sale
Browse homes for sale and investment properties in Olive Branch, MS. Refine your search by price, property type, or more.
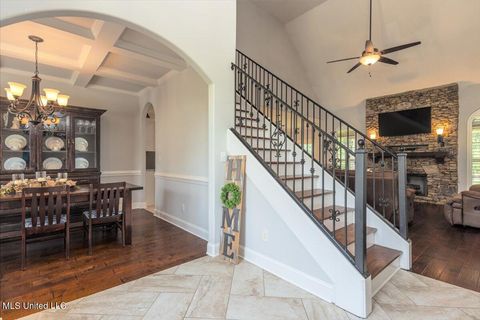
Best cash flowing properties in Olive Branch, MS

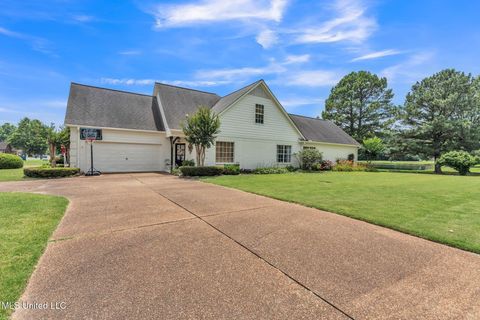
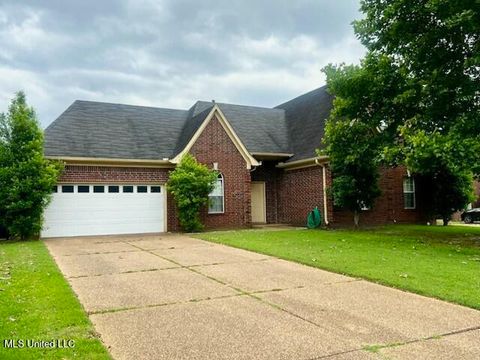
Active
$270,000
4
bds
|
3
ba
|
0
sqft
|
built
1977
6800 Whippoorwill Rd, Olive Branch, MS 38654
$307
Cash flow
5.9%
Cash-on-Cash Return
7.0%
Cap rate
0.9%
Rent to Value Ratio

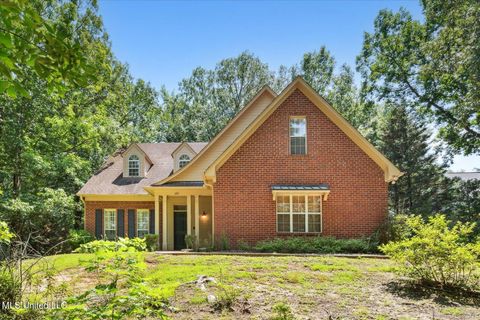
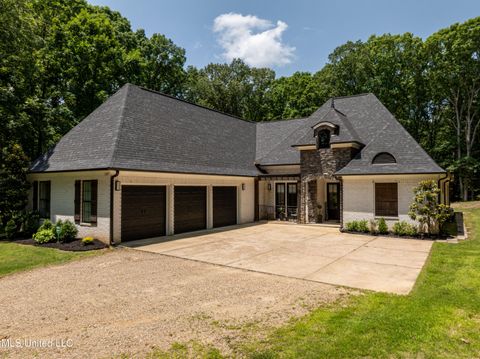
Active
$300,000
5
bds
|
3
ba
|
0
sqft
|
built
2001
9091 Hunters Ridge Dr, Olive Branch, MS 38654
$232
Cash flow
4.0%
Cash-on-Cash Return
6.6%
Cap rate
0.8%
Rent to Value Ratio
174 out of 183 properties for sale in Olive Branch, MS
Limited Results Shown
Create a free account, or log in to reveal all property listings and enjoy the complete experience.
Active
$400,000
4
bds
|
4
ba
|
0
sqft
|
built
1997
3831 Lake Village Cv, Olive Branch, MS 38654
$-304
Cash flow
-4.0%
Cash-on-Cash Return
4.8%
Cap rate
0.7%
Rent to Value Ratio
Active
$515,000
5
bds
|
3
ba
|
0
sqft
|
built
2018
3485 Iron Bridge Rd, Olive Branch, MS 38654
$-500
Cash flow
-5.1%
Cash-on-Cash Return
4.5%
Cap rate
0.6%
Rent to Value Ratio
Active
$380,000
4
bds
|
3
ba
|
0
sqft
|
built
1997
6193 Spring Hill Dr, Olive Branch, MS 38654
$-212
Cash flow
-2.9%
Cash-on-Cash Return
5.0%
Cap rate
0.7%
Rent to Value Ratio
Active
$197,500
3
bds
|
3
ba
|
0
sqft
|
built
1991
10101 Stephenson Ln, Olive Branch, MS 38654
$47
Cash flow
1.2%
Cash-on-Cash Return
6.0%
Cap rate
0.8%
Rent to Value Ratio
Active
$280,000
4
bds
|
3
ba
|
0
sqft
|
built
2005
9064 Kyle Duran Ln, Olive Branch, MS 38654
$33
Cash flow
0.6%
Cash-on-Cash Return
5.8%
Cap rate
0.8%
Rent to Value Ratio
Active
$745,000
5
bds
|
3
ba
|
0
sqft
|
built
2021
5205 Polk Ln, Olive Branch, MS 38654
$-356
Cash flow
-2.5%
Cash-on-Cash Return
5.1%
Cap rate
0.7%
Rent to Value Ratio
Active
$319,900
2
bds
|
2
ba
|
0
sqft
|
built
2007
8911 Oak Branch Ln, Olive Branch, MS 38654
$-465
Cash flow
-7.6%
Cash-on-Cash Return
3.9%
Cap rate
0.7%
Rent to Value Ratio
Active
$269,900
3
bds
|
2
ba
|
0
sqft
|
built
2002
6190 Braybourne Main, Olive Branch, MS 38654
$-27
Cash flow
-0.5%
Cash-on-Cash Return
5.6%
Cap rate
0.7%
Rent to Value Ratio
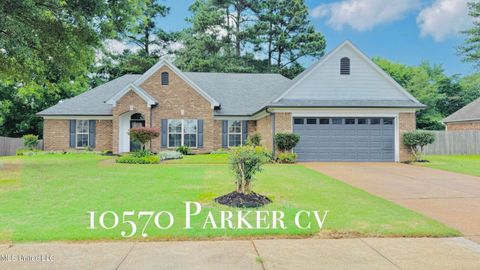
Active
$329,500
4
bds
|
2
ba
|
0
sqft
|
built
2006
10570 Parker Cv, Olive Branch, MS 38654
$-138
Cash flow
-2.2%
Cash-on-Cash Return
5.2%
Cap rate
0.7%
Rent to Value Ratio

Active
$459,900
4
bds
|
3
ba
|
0
sqft
|
built
1998
6280 Spring Hill Dr, Olive Branch, MS 38654
$-542
Cash flow
-6.1%
Cash-on-Cash Return
4.3%
Cap rate
0.6%
Rent to Value Ratio

Active
$324,900
3
bds
|
3
ba
|
0
sqft
|
built
1996
5348 Tournament Dr, Olive Branch, MS 38654
$151
Cash flow
2.4%
Cash-on-Cash Return
6.2%
Cap rate
0.8%
Rent to Value Ratio

Active
$329,900
4
bds
|
2
ba
|
0
sqft
|
built
1999
9884 Victor Dr, Olive Branch, MS 38654
$-190
Cash flow
-3.0%
Cash-on-Cash Return
5.0%
Cap rate
0.7%
Rent to Value Ratio
Active
$175,000
3
bds
|
1
ba
|
0
sqft
|
built
1939
9816 Goodman Rd, Olive Branch, MS 38654
$71
Cash flow
2.1%
Cash-on-Cash Return
6.2%
Cap rate
0.8%
Rent to Value Ratio
Active
$499,900
5
bds
|
4
ba
|
0
sqft
|
built
2008
14185 Chapel Ridge Trl, Olive Branch, MS 38654
$-541
Cash flow
-5.6%
Cash-on-Cash Return
4.4%
Cap rate
0.6%
Rent to Value Ratio
Active
$345,000
4
bds
|
2
ba
|
0
sqft
|
built
2020
6743 Jessie Hoyt Dr, Olive Branch, MS 38654
$-278
Cash flow
-4.2%
Cash-on-Cash Return
4.7%
Cap rate
0.7%
Rent to Value Ratio

Active
$281,900
3
bds
|
3
ba
|
0
sqft
|
built
2001
7669 Meadow Ridge Ln, Olive Branch, MS 38654
$57
Cash flow
1.1%
Cash-on-Cash Return
5.9%
Cap rate
0.8%
Rent to Value Ratio

Active
$445,900
4
bds
|
3
ba
|
0
sqft
|
built
2021
8619 Williamson Dr, Olive Branch, MS 38654
$-353
Cash flow
-4.1%
Cash-on-Cash Return
4.7%
Cap rate
0.7%
Rent to Value Ratio

Active
$375,000
5
bds
|
4
ba
|
0
sqft
|
built
2008
7427 Lauren Ln, Olive Branch, MS 38654
$-133
Cash flow
-1.9%
Cash-on-Cash Return
5.3%
Cap rate
0.7%
Rent to Value Ratio

Active
$400,000
3
bds
|
3
ba
|
0
sqft
|
built
1995
7860 Windersgate Cir, Olive Branch, MS 38654
$-283
Cash flow
-3.7%
Cash-on-Cash Return
4.8%
Cap rate
0.6%
Rent to Value Ratio

Active
$350,000
4
bds
|
3
ba
|
0
sqft
|
built
1985
7465 Davidson Rd, Olive Branch, MS 38654
$-201
Cash flow
-3.0%
Cash-on-Cash Return
5.0%
Cap rate
0.7%
Rent to Value Ratio

Active
$450,000
4
bds
|
4
ba
|
0
sqft
|
built
2002
4872 Bobo Pl, Olive Branch, MS 38654
$-419
Cash flow
-4.9%
Cash-on-Cash Return
4.6%
Cap rate
0.6%
Rent to Value Ratio

Active
$458,900
4
bds
|
3
ba
|
0
sqft
|
built
2004
7672 Rigmoore Pt N, Olive Branch, MS 38654
$-442
Cash flow
-5.0%
Cash-on-Cash Return
4.5%
Cap rate
0.6%
Rent to Value Ratio

Active
$394,999
5
bds
|
3
ba
|
0
sqft
|
built
1990
4100 Redwood Dr, Olive Branch, MS 38654
$-51
Cash flow
-0.7%
Cash-on-Cash Return
5.5%
Cap rate
0.7%
Rent to Value Ratio

Active
$799,900
5
bds
|
5
ba
|
0
sqft
|
built
2008
4050 Robinson Xing, Olive Branch, MS 38654
$-1,156
Cash flow
-7.5%
Cash-on-Cash Return
3.9%
Cap rate
0.6%
Rent to Value Ratio

Active
$349,900
4
bds
|
2
ba
|
0
sqft
|
built
1998
9948 Victor Dr, Olive Branch, MS 38654
$-311
Cash flow
-4.6%
Cash-on-Cash Return
4.6%
Cap rate
0.6%
Rent to Value Ratio

Active
$395,000
4
bds
|
4
ba
|
0
sqft
|
built
2006
7428 Wallingford Dr, Olive Branch, MS 38654
$-2
Cash flow
0.0%
Cash-on-Cash Return
5.7%
Cap rate
0.8%
Rent to Value Ratio

Active
$1,050,000
4
bds
|
5
ba
|
0
sqft
|
built
1997
12821 Whispering Pines Dr, Olive Branch, MS 38654
$-3,010
Cash flow
-15.0%
Cash-on-Cash Return
2.2%
Cap rate
0.3%
Rent to Value Ratio
Active
$270,000
4
bds
|
3
ba
|
0
sqft
|
built
1977
6800 Whippoorwill Rd, Olive Branch, MS 38654
$307
Cash flow
5.9%
Cash-on-Cash Return
7.0%
Cap rate
0.9%
Rent to Value Ratio

Active
$489,000
5
bds
|
3
ba
|
0
sqft
|
built
2007
8061 Falcon Dr, Olive Branch, MS 38654
$-644
Cash flow
-6.9%
Cash-on-Cash Return
4.1%
Cap rate
0.6%
Rent to Value Ratio

Active
$329,000
5
bds
|
2
ba
|
0
sqft
|
built
1996
7188 Larkfield Cv, Olive Branch, MS 38654
$182
Cash flow
2.9%
Cash-on-Cash Return
6.3%
Cap rate
0.8%
Rent to Value Ratio

Active
$549,900
6
bds
|
3
ba
|
0
sqft
|
built
2006
14377 Santa Fe Dr, Olive Branch, MS 38654
$-429
Cash flow
-4.1%
Cash-on-Cash Return
4.7%
Cap rate
0.6%
Rent to Value Ratio
Active
$300,000
5
bds
|
3
ba
|
0
sqft
|
built
2001
9091 Hunters Ridge Dr, Olive Branch, MS 38654
$232
Cash flow
4.0%
Cash-on-Cash Return
6.6%
Cap rate
0.8%
Rent to Value Ratio

Active
$378,500
3
bds
|
3
ba
|
0
sqft
|
built
1986
8140 Hunters Hill Cv, Olive Branch, MS 38654
$-137
Cash flow
-1.9%
Cash-on-Cash Return
5.2%
Cap rate
0.7%
Rent to Value Ratio

Active
$459,000
4
bds
|
3
ba
|
0
sqft
|
built
2022
4183 Bolivar Trl S, Olive Branch, MS 38654
$-122
Cash flow
-1.4%
Cash-on-Cash Return
5.4%
Cap rate
0.7%
Rent to Value Ratio

Active
$424,900
4
bds
|
3
ba
|
0
sqft
|
built
1947
7300 Shahkoka Dr, Olive Branch, MS 38654
$-774
Cash flow
-9.5%
Cash-on-Cash Return
3.5%
Cap rate
0.5%
Rent to Value Ratio

Active
$750,000
5
bds
|
4
ba
|
0
sqft
|
built
2007
9030 Sandy Dr, Olive Branch, MS 38654
$-1,621
Cash flow
-11.3%
Cash-on-Cash Return
3.1%
Cap rate
0.4%
Rent to Value Ratio

Active
$539,000
5
bds
|
3
ba
|
0
sqft
|
built
2010
14291 Buttercup Dr, Olive Branch, MS 38654
$-605
Cash flow
-5.9%
Cash-on-Cash Return
4.3%
Cap rate
0.6%
Rent to Value Ratio
Active
$425,000
5
bds
|
5
ba
|
0
sqft
|
built
2002
8939 Youngblood Rd, Olive Branch, MS 38654
$-256
Cash flow
-3.1%
Cash-on-Cash Return
5.0%
Cap rate
0.7%
Rent to Value Ratio
Active
$695,900
4
bds
|
4
ba
|
0
sqft
|
built
2000
4424 Rebekah Dr, Olive Branch, MS 38654
$-596
Cash flow
-4.5%
Cash-on-Cash Return
4.7%
Cap rate
0.6%
Rent to Value Ratio

Active
$499,000
3
bds
|
2
ba
|
0
sqft
|
built
1999
6821 Autumn Oaks Dr, Olive Branch, MS 38654
$-589
Cash flow
-6.2%
Cash-on-Cash Return
4.3%
Cap rate
0.6%
Rent to Value Ratio