Olive Branch, MS Investment Properties for Sale
Browse homes for sale and investment properties in Olive Branch, MS. Refine your search by price, property type, or more.
Best cash flowing properties in Olive Branch, MS

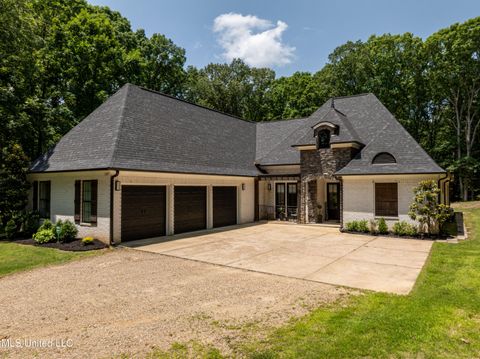
Active
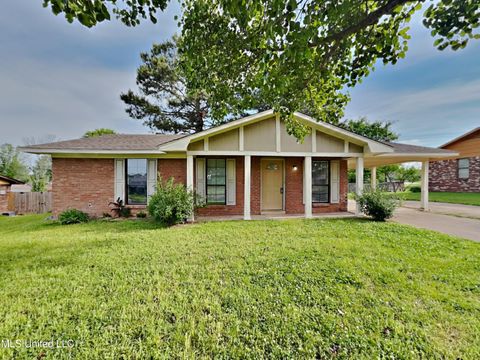
$265,000
4
bds
|
3
ba
|
0
sqft
|
built
1977
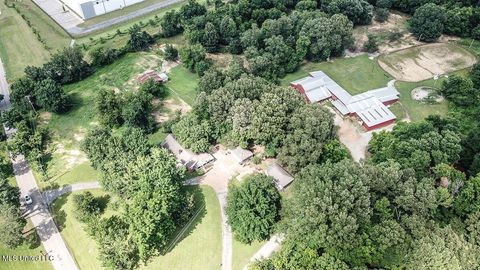
6800 Whippoorwill Rd, Olive Branch, MS 38654
$331
Cash flow
6.5%
Cash-on-Cash Return
7.2%
Cap rate
0.9%
Rent to Value Ratio

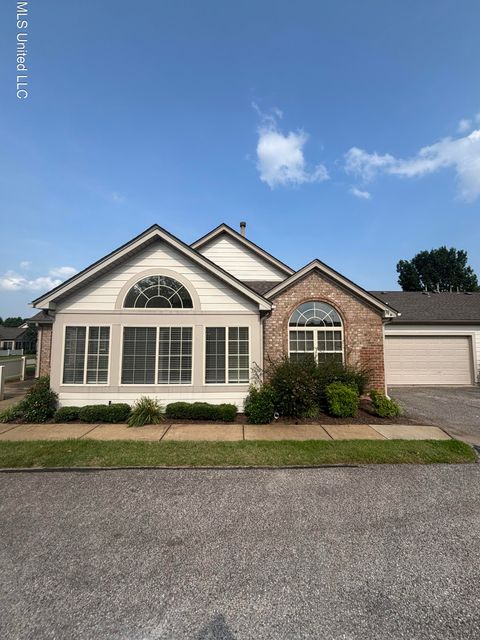
Active
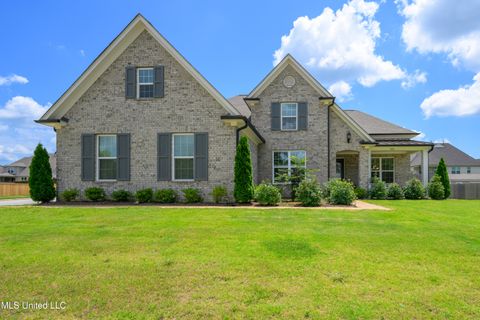
$375,000
4
bds
|
4
ba
|
0
sqft
|
built
2006
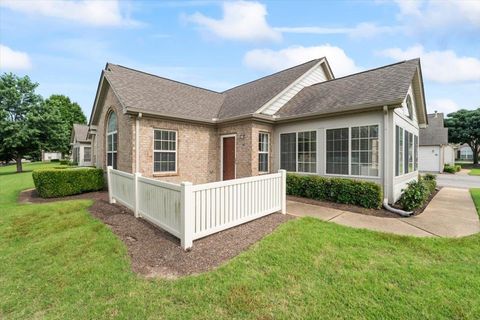
7428 Wallingford Dr, Olive Branch, MS 38654
$92
Cash flow
1.3%
Cash-on-Cash Return
6.0%
Cap rate
0.8%
Rent to Value Ratio
147 out of 162 properties for sale in Olive Branch, MS
Limited Results Shown
Create a free account, or log in to reveal all property listings and enjoy the complete experience.

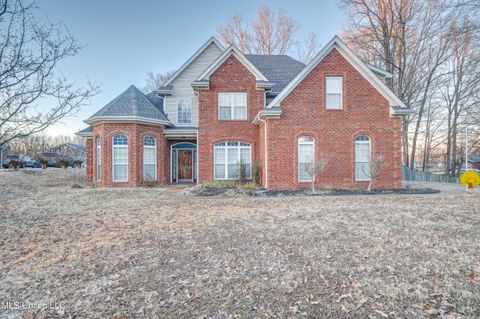
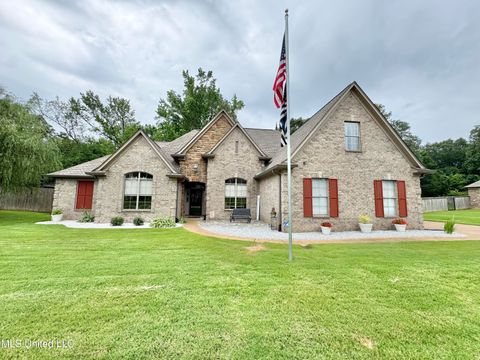
Active
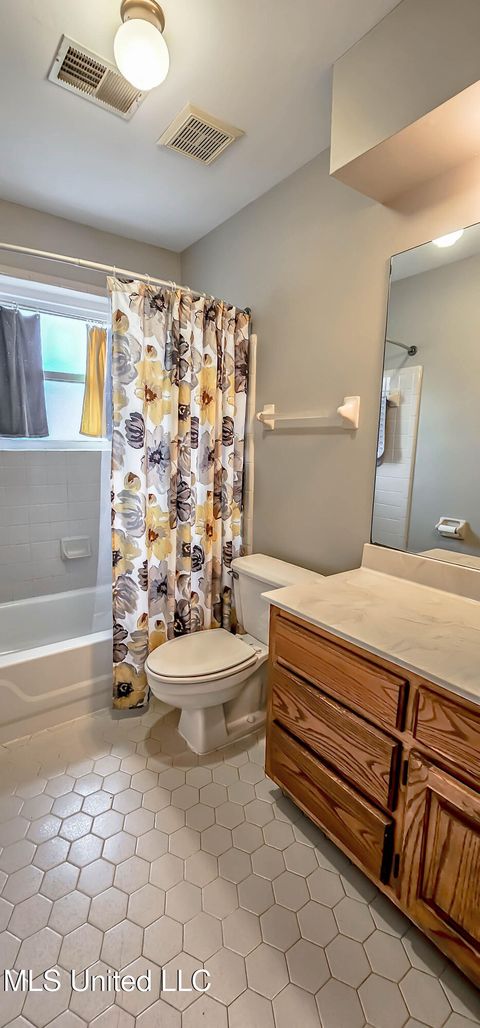
$425,000
4
bds
|
3
ba
|
0
sqft
|
built
1993
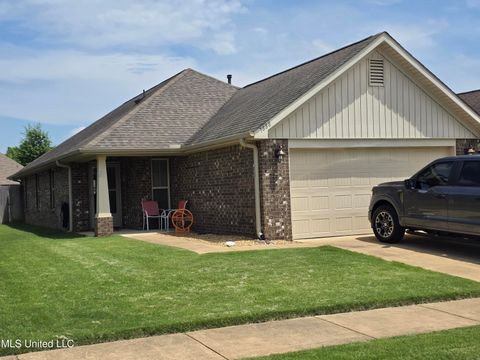
7906 Kirkwood Cv, Olive Branch, MS 38654
$-528
Cash flow
-6.5%
Cash-on-Cash Return
4.2%
Cap rate
0.6%
Rent to Value Ratio

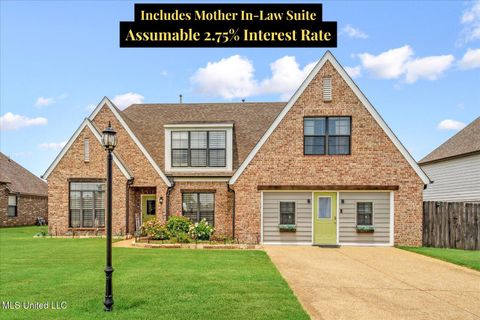
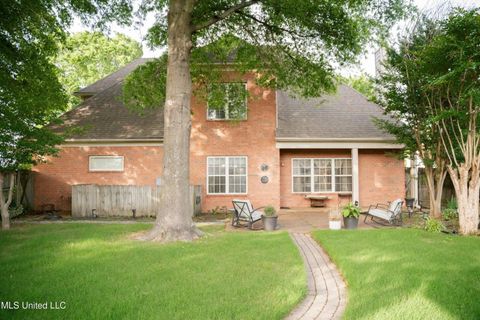
Active
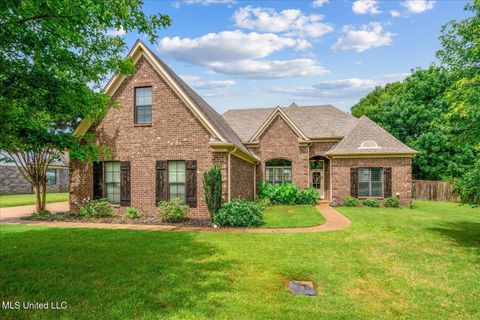
$484,900
4
bds
|
3
ba
|
0
sqft
|
built
2023
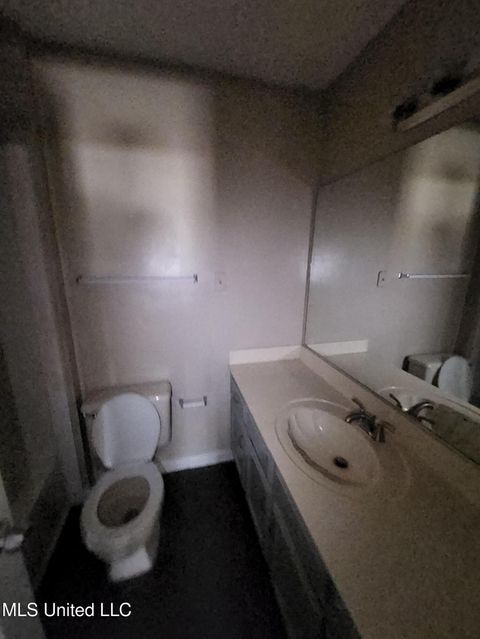
3972 Fieldstream Dr N, Olive Branch, MS 38654
$-149
Cash flow
-1.6%
Cash-on-Cash Return
5.3%
Cap rate
0.7%
Rent to Value Ratio
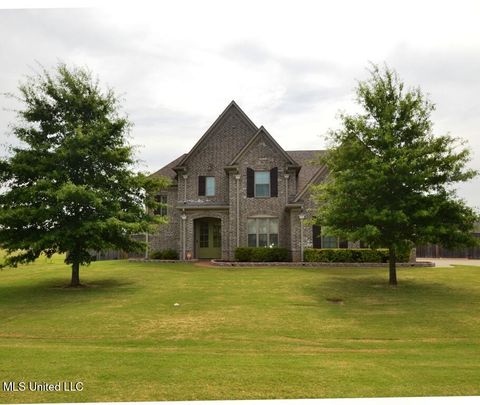
Active
$415,000
5
bds
|
3
ba
|
0
sqft
|
built
2002
9480 Miranda Dr, Olive Branch, MS 38654
$-146
Cash flow
-1.8%
Cash-on-Cash Return
5.3%
Cap rate
0.7%
Rent to Value Ratio
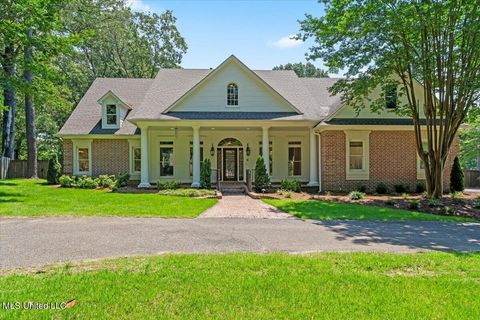
Active
$409,500
5
bds
|
4
ba
|
0
sqft
|
built
2014
13530 Lapstone Ln, Olive Branch, MS 38654
$-97
Cash flow
-1.2%
Cash-on-Cash Return
5.4%
Cap rate
0.7%
Rent to Value Ratio
Active
$465,000
4
bds
|
3
ba
|
0
sqft
|
built
2017
8146 Wisteria Dr, Olive Branch, MS 38654
$-339
Cash flow
-3.8%
Cash-on-Cash Return
4.8%
Cap rate
0.7%
Rent to Value Ratio

Active
$493,900
5
bds
|
3
ba
|
0
sqft
|
built
2022
4406 John Wood Ln, Olive Branch, MS 38654
$-202
Cash flow
-2.1%
Cash-on-Cash Return
5.2%
Cap rate
0.7%
Rent to Value Ratio

Active
$485,000
4
bds
|
3
ba
|
0
sqft
|
built
2013
9105 Mitchells Corner Rd S, Olive Branch, MS 38654
$-501
Cash flow
-5.4%
Cash-on-Cash Return
4.4%
Cap rate
0.6%
Rent to Value Ratio

Active
$699,000
3
bds
|
5
ba
|
0
sqft
|
built
2003
8316 Saddlebrook Trl, Olive Branch, MS 38654
$-1,547
Cash flow
-11.5%
Cash-on-Cash Return
3.0%
Cap rate
0.5%
Rent to Value Ratio
Active
$600,000
4
bds
|
5
ba
|
0
sqft
|
built
1996
6290 Autumn Oaks Dr, Olive Branch, MS 38654
$-1,153
Cash flow
-10.0%
Cash-on-Cash Return
3.4%
Cap rate
0.5%
Rent to Value Ratio
Active
$213,180
3
bds
|
2
ba
|
0
sqft
|
built
1987
10482 Lafayette Dr, Olive Branch, MS 38654
$-30
Cash flow
-0.7%
Cash-on-Cash Return
5.5%
Cap rate
0.8%
Rent to Value Ratio
Active
$475,000
4
bds
|
3
ba
|
0
sqft
|
built
2022
4432 John Wood Ln, Olive Branch, MS 38654
$-359
Cash flow
-3.9%
Cash-on-Cash Return
4.8%
Cap rate
0.7%
Rent to Value Ratio
Active
$589,000
5
bds
|
3
ba
|
0
sqft
|
built
1992
5900 Paloma Dr, Olive Branch, MS 38654
$-769
Cash flow
-6.8%
Cash-on-Cash Return
4.1%
Cap rate
0.5%
Rent to Value Ratio

Active
$649,900
4
bds
|
3
ba
|
0
sqft
|
built
2018
2275 Highway 305 N, Olive Branch, MS 38654
$-1,149
Cash flow
-9.2%
Cash-on-Cash Return
3.6%
Cap rate
0.5%
Rent to Value Ratio

Active
$330,000
4
bds
|
3
ba
|
0
sqft
|
built
2008
7309 Gerralyn Cv, Olive Branch, MS 38654
$5
Cash flow
0.1%
Cash-on-Cash Return
5.7%
Cap rate
0.8%
Rent to Value Ratio
Active
$400,000
4
bds
|
3
ba
|
0
sqft
|
built
2013
6865 Payne Ln, Olive Branch, MS 38654
$-180
Cash flow
-2.3%
Cash-on-Cash Return
5.1%
Cap rate
0.7%
Rent to Value Ratio
Active
$749,000
3
bds
|
2
ba
|
0
sqft
|
built
1951
9142 Mineral Wells Rd, Olive Branch, MS 38654
$-1,976
Cash flow
-13.8%
Cash-on-Cash Return
2.5%
Cap rate
0.3%
Rent to Value Ratio

Active
$578,900
4
bds
|
4
ba
|
0
sqft
|
built
2008
7247 Eastern Rd, Olive Branch, MS 38654
$-1,215
Cash flow
-11.0%
Cash-on-Cash Return
3.2%
Cap rate
0.4%
Rent to Value Ratio

Active
$430,000
4
bds
|
4
ba
|
0
sqft
|
built
1998
6375 Darren Dr, Olive Branch, MS 38654
$-260
Cash flow
-3.2%
Cash-on-Cash Return
5.0%
Cap rate
0.7%
Rent to Value Ratio

Active
$389,900
4
bds
|
3
ba
|
0
sqft
|
built
2015
13573 Lapstone Ln, Olive Branch, MS 38654
$-213
Cash flow
-2.9%
Cash-on-Cash Return
5.0%
Cap rate
0.7%
Rent to Value Ratio
Active
$289,000
2
bds
|
2
ba
|
0
sqft
|
built
2008
8897 Parkview Oaks Cir, Olive Branch, MS 38654
$12
Cash flow
0.2%
Cash-on-Cash Return
5.7%
Cap rate
0.7%
Rent to Value Ratio
Active
$285,000
3
bds
|
2
ba
|
0
sqft
|
built
2017
7888 Allenwood Ln, Olive Branch, MS 38654
$-107
Cash flow
-2.0%
Cash-on-Cash Return
5.2%
Cap rate
0.6%
Rent to Value Ratio
Active
$197,500
3
bds
|
3
ba
|
0
sqft
|
built
1991
10101 Stephenson Ln, Olive Branch, MS 38654
$47
Cash flow
1.2%
Cash-on-Cash Return
6.0%
Cap rate
0.8%
Rent to Value Ratio
Active
$715,000
5
bds
|
3
ba
|
0
sqft
|
built
2021
5205 Polk Ln, Olive Branch, MS 38654
$-214
Cash flow
-1.6%
Cash-on-Cash Return
5.3%
Cap rate
0.7%
Rent to Value Ratio
Active
$314,900
2
bds
|
2
ba
|
0
sqft
|
built
2007
8911 Oak Branch Ln, Olive Branch, MS 38654
$-441
Cash flow
-7.3%
Cash-on-Cash Return
4.0%
Cap rate
0.7%
Rent to Value Ratio
Active
$494,900
5
bds
|
4
ba
|
0
sqft
|
built
2008
14185 Chapel Ridge Trl, Olive Branch, MS 38654
$-517
Cash flow
-5.5%
Cash-on-Cash Return
4.4%
Cap rate
0.6%
Rent to Value Ratio

Active
$279,000
3
bds
|
3
ba
|
0
sqft
|
built
2001
7669 Meadow Ridge Ln, Olive Branch, MS 38654
$71
Cash flow
1.3%
Cash-on-Cash Return
6.0%
Cap rate
0.8%
Rent to Value Ratio
Active
$450,000
3
bds
|
2
ba
|
0
sqft
|
built
2000
9387 Joe Lyon Blvd, Olive Branch, MS 38654
$-662
Cash flow
-7.7%
Cash-on-Cash Return
3.9%
Cap rate
0.6%
Rent to Value Ratio

Active
$458,900
4
bds
|
3
ba
|
0
sqft
|
built
2004
7672 Rigmoore Pt N, Olive Branch, MS 38654
$-442
Cash flow
-5.0%
Cash-on-Cash Return
4.5%
Cap rate
0.6%
Rent to Value Ratio

Active
$1,050,000
4
bds
|
5
ba
|
0
sqft
|
built
1997
12821 Whispering Pines Dr, Olive Branch, MS 38654
$-3,010
Cash flow
-15.0%
Cash-on-Cash Return
2.2%
Cap rate
0.3%
Rent to Value Ratio
Active
$475,000
5
bds
|
3
ba
|
0
sqft
|
built
2007
8061 Falcon Dr, Olive Branch, MS 38654
$-578
Cash flow
-6.3%
Cash-on-Cash Return
4.2%
Cap rate
0.6%
Rent to Value Ratio

Active
$369,000
3
bds
|
3
ba
|
0
sqft
|
built
1986
8140 Hunters Hill Cv, Olive Branch, MS 38654
$-92
Cash flow
-1.3%
Cash-on-Cash Return
5.4%
Cap rate
0.7%
Rent to Value Ratio

Active
$750,000
5
bds
|
4
ba
|
0
sqft
|
built
2007
9030 Sandy Dr, Olive Branch, MS 38654
$-1,621
Cash flow
-11.3%
Cash-on-Cash Return
3.1%
Cap rate
0.4%
Rent to Value Ratio

Active
$660,000
4
bds
|
4
ba
|
0
sqft
|
built
2000
4424 Rebekah Dr, Olive Branch, MS 38654
$-426
Cash flow
-3.4%
Cash-on-Cash Return
4.9%
Cap rate
0.7%
Rent to Value Ratio

Active
$375,000
3
bds
|
3
ba
|
0
sqft
|
built
1993
7925 Kirkwood Cv, Olive Branch, MS 38654
$-258
Cash flow
-3.6%
Cash-on-Cash Return
4.9%
Cap rate
0.7%
Rent to Value Ratio

Active
$465,000
4
bds
|
4
ba
|
0
sqft
|
built
2022
13604 Live Oak Loop, Olive Branch, MS 38654
$-260
Cash flow
-2.9%
Cash-on-Cash Return
5.0%
Cap rate
0.7%
Rent to Value Ratio

Active
$639,900
5
bds
|
4
ba
|
0
sqft
|
built
2017
10515 Long Bridge Rd S, Olive Branch, MS 38654
$-1,120
Cash flow
-9.1%
Cash-on-Cash Return
3.6%
Cap rate
0.5%
Rent to Value Ratio

Active
$457,900
5
bds
|
3
ba
|
0
sqft
|
built
2007
4350 Abele Cv, Olive Branch, MS 38654
$-340
Cash flow
-3.9%
Cash-on-Cash Return
4.8%
Cap rate
0.6%
Rent to Value Ratio

Active
$459,900
6
bds
|
4
ba
|
0
sqft
|
built
1996
4630 Alexander Rd, Olive Branch, MS 38654
$-387
Cash flow
-4.4%
Cash-on-Cash Return
4.7%
Cap rate
0.6%
Rent to Value Ratio