Orland Park, IL Investment Properties for Sale
Browse homes for sale and investment properties in Orland Park, IL. Refine your search by price, property type, or more.
Best cash flowing properties in Orland Park, IL
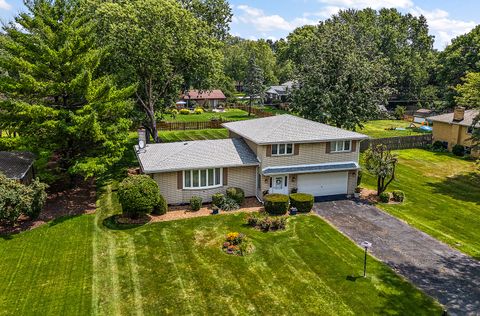
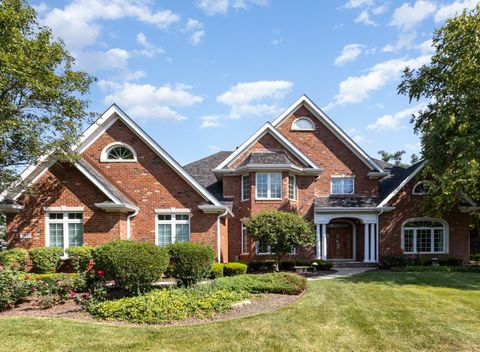
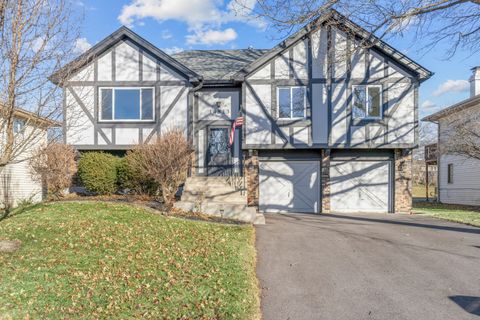
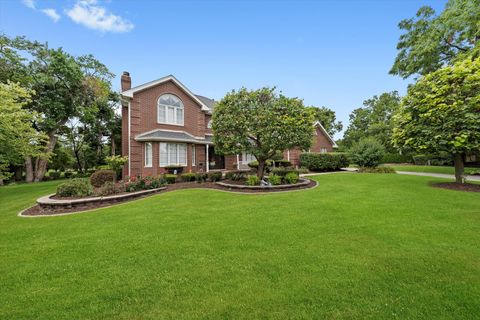
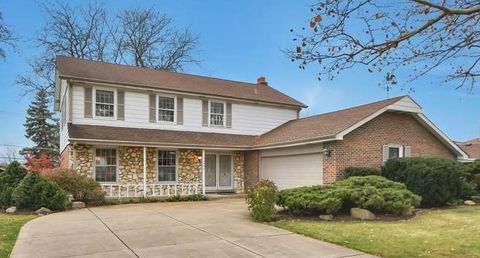
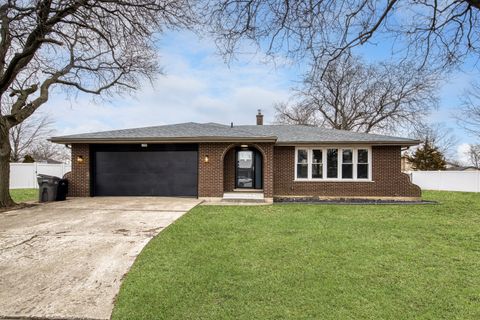
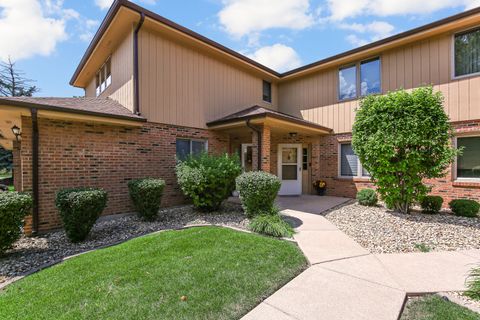
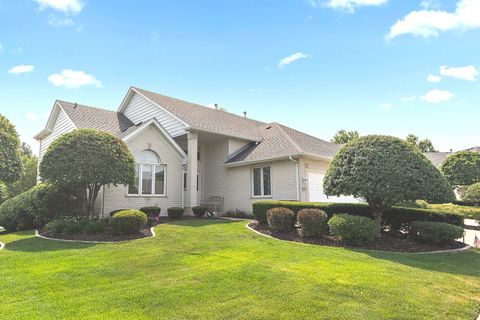
Active
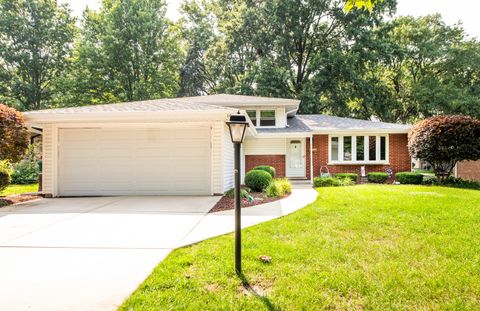
$399,000
3
bds
|
3
ba
|
2,542
sqft
|
built
1967
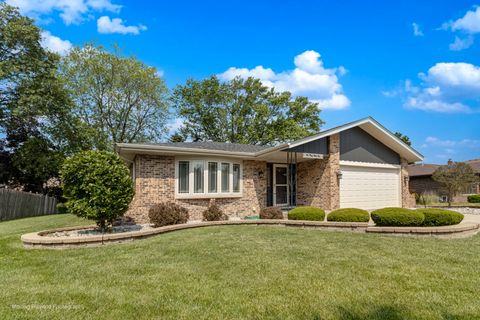
14939 S 81st Ct, Orland Park, IL 60462
$85
Cash flow
1.1%
Cash-on-Cash Return
5.9%
Cap rate
0.8%
Rent to Value Ratio
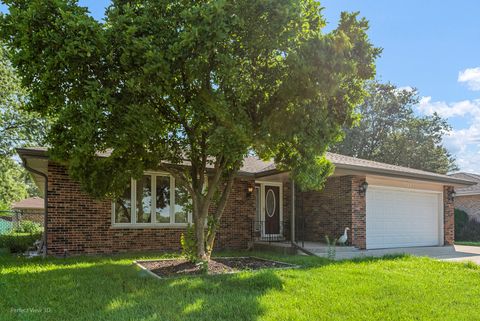
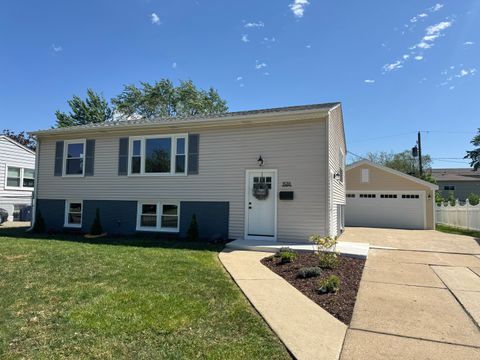
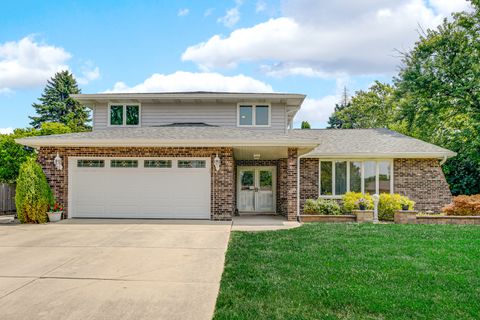
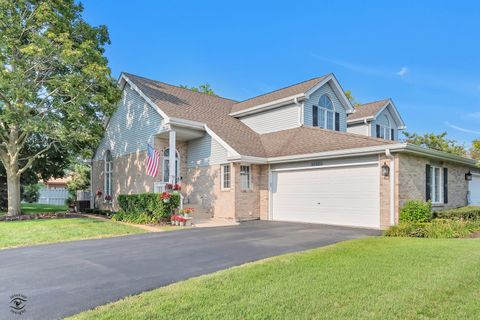
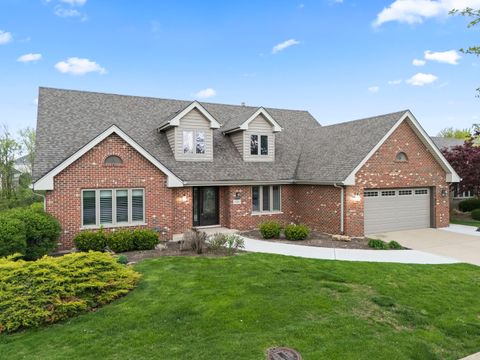
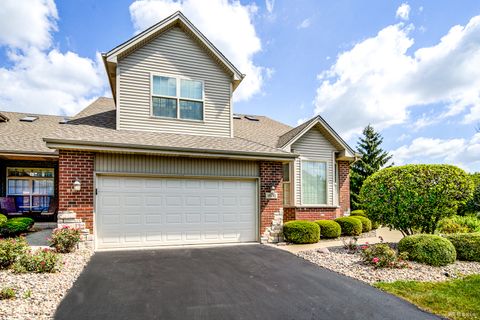
Active
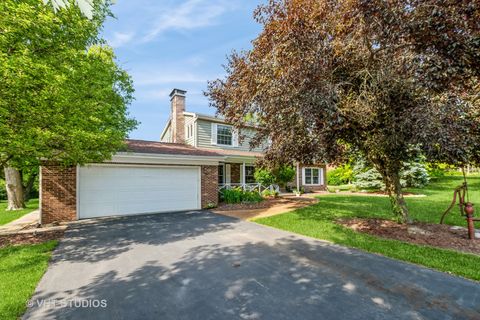
$385,000
3
bds
|
2
ba
|
1,746
sqft
|
built
1977
7738 Wheeler Dr, Orland Park, IL 60462
$52
Cash flow
0.7%
Cash-on-Cash Return
5.8%
Cap rate
0.8%
Rent to Value Ratio
56 out of 63 properties for sale in Orland Park, IL
Limited Results Shown
Create a free account, or log in to reveal all property listings and enjoy the complete experience.
Active
$624,999
3
bds
|
3
ba
|
2,598
sqft
|
built
2002
18242 Breckenridge Blvd, Orland Park, IL 60467
$-1,199
Cash flow
-10.0%
Cash-on-Cash Return
3.4%
Cap rate
0.6%
Rent to Value Ratio
Active
$549,900
4
bds
|
3
ba
|
2,673
sqft
|
built
1990
14225 Mallard Dr, Orland Park, IL 60467
$-849
Cash flow
-8.1%
Cash-on-Cash Return
3.8%
Cap rate
0.7%
Rent to Value Ratio
Active
$435,000
3
bds
|
2
ba
|
1,832
sqft
|
built
1974
14034 S 84th Ave, Orland Park, IL 60462
$-602
Cash flow
-7.2%
Cash-on-Cash Return
4.0%
Cap rate
0.7%
Rent to Value Ratio
Active
$569,999
4
bds
|
4
ba
|
3,780
sqft
|
built
1976
14739 Maple Ave, Orland Park, IL 60462
$-758
Cash flow
-6.9%
Cash-on-Cash Return
4.1%
Cap rate
0.6%
Rent to Value Ratio
Active
$365,000
3
bds
|
2
ba
|
1,834
sqft
|
built
1985
7718 W 157th Pl, Orland Park, IL 60462
$-314
Cash flow
-4.5%
Cash-on-Cash Return
4.6%
Cap rate
0.9%
Rent to Value Ratio
Active
$699,950
4
bds
|
4
ba
|
4,128
sqft
|
built
2016
16829 Sheridans Trl, Orland Park, IL 60467
$-1,906
Cash flow
-14.2%
Cash-on-Cash Return
2.4%
Cap rate
0.5%
Rent to Value Ratio
Active
$1,459,000
5
bds
|
6
ba
|
5,500
sqft
|
built
1999
10924 Crystal Springs Ln, Orland Park, IL 60467
$-4,476
Cash flow
-16.0%
Cash-on-Cash Return
2.0%
Cap rate
0.4%
Rent to Value Ratio
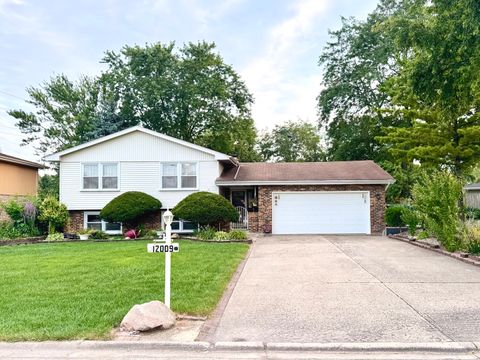
Active
$419,900
3
bds
|
2
ba
|
2,506
sqft
|
built
1973
12009 Venetian Way, Orland Park, IL 60467
$-320
Cash flow
-4.0%
Cash-on-Cash Return
4.8%
Cap rate
0.7%
Rent to Value Ratio
Active
$1,250,000
6
bds
|
4
ba
|
4,005
sqft
|
built
2000
11711 Juanita Dr, Orland Park, IL 60467
$-2,209
Cash flow
-9.2%
Cash-on-Cash Return
3.6%
Cap rate
0.6%
Rent to Value Ratio
Active
$399,000
3
bds
|
3
ba
|
2,605
sqft
|
built
1998
8735 Golden Rose Dr, Orland Park, IL 60462
$-466
Cash flow
-6.1%
Cash-on-Cash Return
4.3%
Cap rate
0.8%
Rent to Value Ratio
Active
$399,000
3
bds
|
2
ba
|
1,950
sqft
|
built
1970
14813 Holly Ct, Orland Park, IL 60462
$47
Cash flow
0.6%
Cash-on-Cash Return
5.8%
Cap rate
0.9%
Rent to Value Ratio
Active
$409,500
3
bds
|
2
ba
|
2,028
sqft
|
built
1963
9055 Fairway Dr, Orland Park, IL 60462
$-728
Cash flow
-9.3%
Cash-on-Cash Return
3.5%
Cap rate
0.6%
Rent to Value Ratio
Active
$570,000
4
bds
|
4
ba
|
3,000
sqft
|
built
1986
14467 Creekview Dr, Orland Park, IL 60467
$-567
Cash flow
-5.2%
Cash-on-Cash Return
4.5%
Cap rate
0.7%
Rent to Value Ratio
Active
$499,900
3
bds
|
3
ba
|
2,000
sqft
|
built
1974
7747 Cashew Dr, Orland Park, IL 60462
$-889
Cash flow
-9.3%
Cash-on-Cash Return
3.5%
Cap rate
0.6%
Rent to Value Ratio
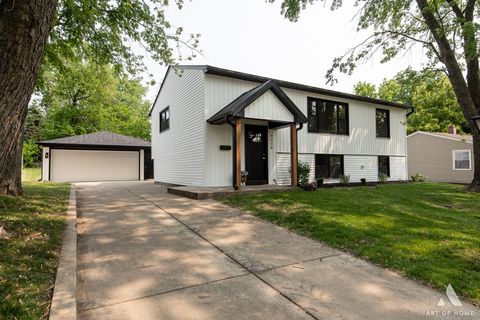
Active
$764,900
5
bds
|
5
ba
|
3,633
sqft
|
built
1995
10956 Persimmon Ct, Orland Park, IL 60467
$-1,809
Cash flow
-12.3%
Cash-on-Cash Return
2.8%
Cap rate
0.6%
Rent to Value Ratio
Active
$419,900
4
bds
|
2
ba
|
1,870
sqft
|
built
1963
9058 Caddy Ct, Orland Park, IL 60462
$-1,032
Cash flow
-12.8%
Cash-on-Cash Return
2.7%
Cap rate
0.5%
Rent to Value Ratio
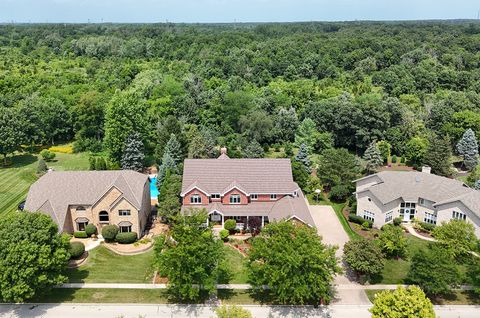
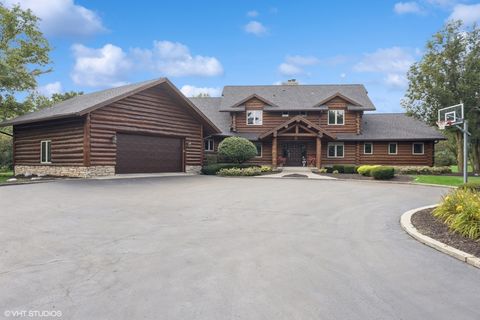
Active
$1,099,000
5
bds
|
6
ba
|
11,334
sqft
|
built
1989
12444 Lake View Dr, Orland Park, IL 60467
$-4,514
Cash flow
-21.4%
Cash-on-Cash Return
0.8%
Cap rate
0.4%
Rent to Value Ratio
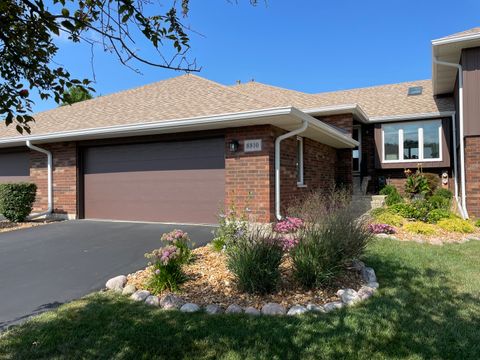
Active
$425,000
3
bds
|
3
ba
|
2,500
sqft
|
built
1989
8810 Clearview Dr, Orland Park, IL 60462
$-1,269
Cash flow
-15.6%
Cash-on-Cash Return
2.1%
Cap rate
0.5%
Rent to Value Ratio
Active
$429,900
4
bds
|
3
ba
|
2,220
sqft
|
built
1974
14508 Maycliff Dr, Orland Park, IL 60462
$-308
Cash flow
-3.7%
Cash-on-Cash Return
4.8%
Cap rate
0.8%
Rent to Value Ratio
Active
$329,900
2
bds
|
3
ba
|
1,753
sqft
|
built
1994
11905 Cormoy Ln, Orland Park, IL 60467
$-166
Cash flow
-2.6%
Cash-on-Cash Return
5.1%
Cap rate
0.9%
Rent to Value Ratio
Active
$749,900
4
bds
|
3
ba
|
3,000
sqft
|
built
1987
64 Silo Ridge Rd S, Orland Park, IL 60467
$-1,341
Cash flow
-9.3%
Cash-on-Cash Return
3.5%
Cap rate
0.7%
Rent to Value Ratio
Active
$482,000
3
bds
|
3
ba
|
2,492
sqft
|
built
1979
14125 Trenton Ave, Orland Park, IL 60462
$-554
Cash flow
-6.0%
Cash-on-Cash Return
4.3%
Cap rate
0.7%
Rent to Value Ratio
Active
$485,000
6
bds
|
3
ba
|
1,817
sqft
|
built
1973
15245 Narcissus Ct, Orland Park, IL 60462
$-842
Cash flow
-9.1%
Cash-on-Cash Return
3.6%
Cap rate
0.7%
Rent to Value Ratio
Active
$390,000
2
bds
|
3
ba
|
2,076
sqft
|
built
1998
15301 Wilshire Dr, Orland Park, IL 60462
$-460
Cash flow
-6.2%
Cash-on-Cash Return
4.3%
Cap rate
0.8%
Rent to Value Ratio
Active
$419,900
3
bds
|
3
ba
|
1,773
sqft
|
built
1974
8226 Bob O Link Rd, Orland Park, IL 60462
$-343
Cash flow
-4.3%
Cash-on-Cash Return
4.7%
Cap rate
0.8%
Rent to Value Ratio
Active
$439,900
2
bds
|
4
ba
|
1,988
sqft
|
built
2013
16516 Timber Trl, Orland Park, IL 60467
$-718
Cash flow
-8.5%
Cash-on-Cash Return
3.7%
Cap rate
0.7%
Rent to Value Ratio
Active
$359,900
3
bds
|
2
ba
|
1,635
sqft
|
built
1968
14440 Brentwood St, Orland Park, IL 60462
$-328
Cash flow
-4.8%
Cash-on-Cash Return
4.6%
Cap rate
0.8%
Rent to Value Ratio
Active
$599,900
4
bds
|
3
ba
|
2,235
sqft
|
built
1963
7820 Forestview Dr, Orland Park, IL 60462
$-587
Cash flow
-5.1%
Cash-on-Cash Return
4.5%
Cap rate
0.7%
Rent to Value Ratio
Active
$1,365,000
5
bds
|
6
ba
|
4,090
sqft
|
built
1988
87 Windmill Rd, Orland Park, IL 60467
$-1,309
Cash flow
-5.0%
Cash-on-Cash Return
4.5%
Cap rate
0.7%
Rent to Value Ratio
Active
$362,000
3
bds
|
2
ba
|
1,242
sqft
|
built
1960
16151 Laurel Dr, Orland Park, IL 60462
$-231
Cash flow
-3.3%
Cash-on-Cash Return
4.9%
Cap rate
0.8%
Rent to Value Ratio
Active
$289,900
2
bds
|
2
ba
|
1,600
sqft
|
built
1991
8966 Silverdale Dr, Orland Park, IL 60462
$-383
Cash flow
-6.9%
Cash-on-Cash Return
4.1%
Cap rate
0.9%
Rent to Value Ratio
Active
$569,900
4
bds
|
3
ba
|
2,679
sqft
|
built
1996
10900 Beth Dr, Orland Park, IL 60467
$-593
Cash flow
-5.4%
Cash-on-Cash Return
4.4%
Cap rate
0.8%
Rent to Value Ratio
Active
$375,000
4
bds
|
2
ba
|
2,028
sqft
|
built
1963
14610 Birch St, Orland Park, IL 60462
$-448
Cash flow
-6.2%
Cash-on-Cash Return
4.2%
Cap rate
0.7%
Rent to Value Ratio
Active
$539,000
4
bds
|
3
ba
|
2,719
sqft
|
built
1985
11811 Old Spanish Trl, Orland Park, IL 60467
$-864
Cash flow
-8.4%
Cash-on-Cash Return
3.8%
Cap rate
0.7%
Rent to Value Ratio
Active
$485,000
3
bds
|
3
ba
|
2,503
sqft
|
built
2001
16313 Bob White Cir, Orland Park, IL 60467
$-977
Cash flow
-10.5%
Cash-on-Cash Return
3.3%
Cap rate
0.7%
Rent to Value Ratio
Active
$799,000
3
bds
|
2
ba
|
2,600
sqft
|
built
1958
16705 Wolf Rd, Orland Park, IL 60467
$-2,261
Cash flow
-14.8%
Cash-on-Cash Return
2.3%
Cap rate
0.4%
Rent to Value Ratio
Active
$456,000
3
bds
|
3
ba
|
2,145
sqft
|
built
1978
13520 Idlewild Dr, Orland Park, IL 60462
$-411
Cash flow
-4.7%
Cash-on-Cash Return
4.6%
Cap rate
0.8%
Rent to Value Ratio
Active
$587,000
4
bds
|
4
ba
|
3,167
sqft
|
built
2004
18011 Breckenridge Blvd, Orland Park, IL 60467
$-947
Cash flow
-8.4%
Cash-on-Cash Return
3.7%
Cap rate
0.6%
Rent to Value Ratio