Park City, UT Investment Properties for Sale
Browse homes for sale and investment properties in Park City, UT. Refine your search by price, property type, or more.
Best cash flowing properties in Park City, UT
Active
$475,000
1
bds
|
1
ba
|
634
sqft
|
built
1976
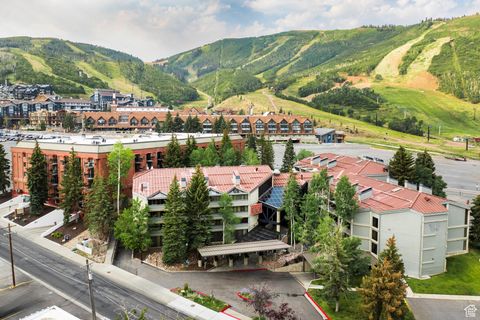
1150 Deer Valley Dr, Park City, UT 84060
$-903
Cash flow
-9.9%
Cash-on-Cash Return
3.4%
Cap rate
0.5%
Rent to Value Ratio
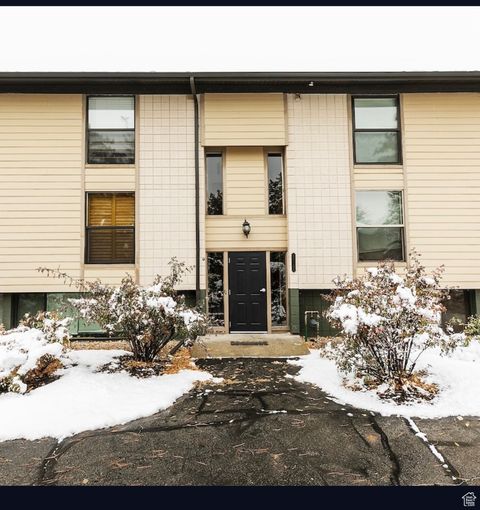
Active
$325,000
bds
|
1
ba
|
354
sqft
|
built
1978
2325 Sidewinder Dr, Park City, UT 84060
$-1,083
Cash flow
-17.4%
Cash-on-Cash Return
1.7%
Cap rate
0.6%
Rent to Value Ratio
320 out of 422 properties for sale in Park City, UT
Limited Results Shown
Create a free account, or log in to reveal all property listings and enjoy the complete experience.
Active
$3,325,000
4
bds
|
4
ba
|
3,452
sqft
|
built
1980
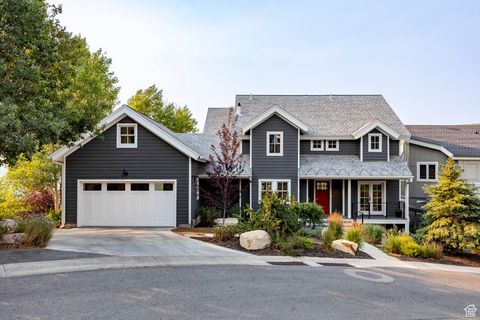
2903 Sunny Slopes Ct, Park City, UT 84060
$-12,449
Cash flow
-19.5%
Cash-on-Cash Return
1.2%
Cap rate
0.2%
Rent to Value Ratio
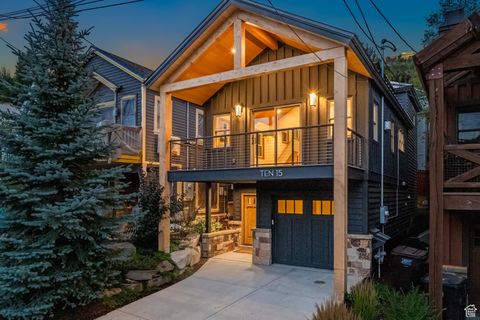
Active
$4,190,000
3
bds
|
3
ba
|
2,231
sqft
|
built
2004
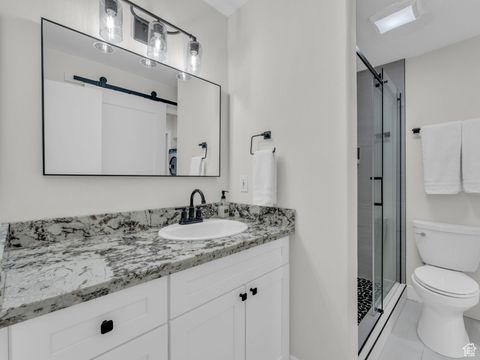
1015 Norfolk Ave, Park City, UT 84060
$-15,964
Cash flow
-19.9%
Cash-on-Cash Return
1.1%
Cap rate
0.2%
Rent to Value Ratio
Active
$7,450,000
6
bds
|
6
ba
|
7,768
sqft
|
built
1982
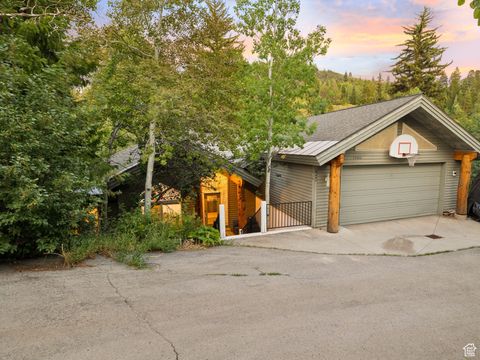
7545 Sterling Dr, Park City, UT 84060
$-32,606
Cash flow
-22.8%
Cash-on-Cash Return
0.4%
Cap rate
0.1%
Rent to Value Ratio
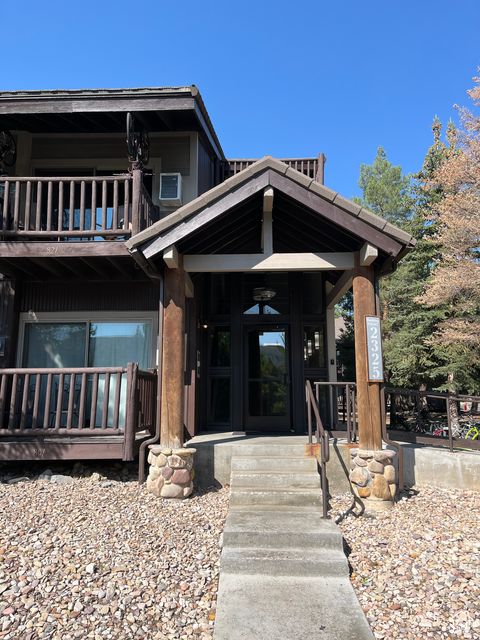
Active
$550,000
1
bds
|
1
ba
|
650
sqft
|
built
1979
2025 Canyons Resort Dr, Park City, UT 84098
$-1,674
Cash flow
-15.9%
Cash-on-Cash Return
2.0%
Cap rate
0.5%
Rent to Value Ratio
Active
$4,800,000
3
bds
|
3
ba
|
3,093
sqft
|
built
2018
158 Ridge Ave, Park City, UT 84060
$-18,942
Cash flow
-20.6%
Cash-on-Cash Return
0.9%
Cap rate
0.2%
Rent to Value Ratio
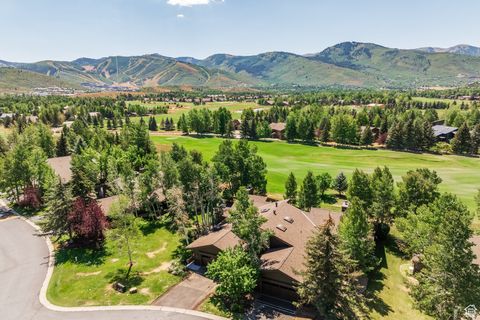
Active
$1,295,000
3
bds
|
2
ba
|
3,167
sqft
|
built
1980
485 Upper Evergreen Dr, Park City, UT 84098
$-3,012
Cash flow
-12.1%
Cash-on-Cash Return
2.9%
Cap rate
0.4%
Rent to Value Ratio
Active
$998,000
2
bds
|
2
ba
|
1,296
sqft
|
built
1976
40 Spaulding Ct, Park City, UT 84060
$-3,177
Cash flow
-16.6%
Cash-on-Cash Return
1.9%
Cap rate
0.4%
Rent to Value Ratio
Active
$780,000
1
bds
|
2
ba
|
870
sqft
|
built
1982
1485 Empire Ave, Park City, UT 84060
$-2,910
Cash flow
-19.5%
Cash-on-Cash Return
1.2%
Cap rate
0.4%
Rent to Value Ratio
Active
$3,250,000
4
bds
|
4
ba
|
2,905
sqft
|
built
2017
6458 Golden Bear Loop W, Park City, UT 84098
$-12,879
Cash flow
-20.7%
Cash-on-Cash Return
0.9%
Cap rate
0.2%
Rent to Value Ratio
Active
$17,900,000
5
bds
|
8
ba
|
11,242
sqft
|
built
2001
22 White Pine Canyon Rd, Park City, UT 84060
$-86,487
Cash flow
-25.2%
Cash-on-Cash Return
-0.1%
Cap rate
0.0%
Rent to Value Ratio
Active
$4,995,000
4
bds
|
6
ba
|
4,538
sqft
|
built
2004
2510 Queen Esther Dr, Park City, UT 84060
$-20,207
Cash flow
-21.1%
Cash-on-Cash Return
0.8%
Cap rate
0.2%
Rent to Value Ratio
Active
$4,500,000
4
bds
|
4
ba
|
4,809
sqft
|
built
2004
2054 Paddington Dr, Park City, UT 84060
$-17,949
Cash flow
-20.8%
Cash-on-Cash Return
0.9%
Cap rate
0.2%
Rent to Value Ratio
Active
$4,650,000
5
bds
|
5
ba
|
4,329
sqft
|
built
2018
2755 E Bitter Brush Dr, Park City, UT 84098
$-18,152
Cash flow
-20.4%
Cash-on-Cash Return
1.0%
Cap rate
0.2%
Rent to Value Ratio
Active
$4,695,000
4
bds
|
5
ba
|
4,724
sqft
|
built
2013
6537 Lookout Dr, Park City, UT 84060
$-20,416
Cash flow
-22.7%
Cash-on-Cash Return
0.5%
Cap rate
0.2%
Rent to Value Ratio
Active
$4,000,000
5
bds
|
4
ba
|
4,763
sqft
|
built
2015
836 E Canyon Gate Rd, Park City, UT 84098
$-14,349
Cash flow
-18.7%
Cash-on-Cash Return
1.4%
Cap rate
0.2%
Rent to Value Ratio
Active
$5,250,000
5
bds
|
6
ba
|
6,142
sqft
|
built
2007
8267 N Ranch Garden Rd, Park City, UT 84098
$-22,348
Cash flow
-22.2%
Cash-on-Cash Return
0.6%
Cap rate
0.1%
Rent to Value Ratio
Active
$1,350,000
2
bds
|
3
ba
|
1,089
sqft
|
built
2018
3793 Blackstone Dr, Park City, UT 84098
$-4,466
Cash flow
-17.3%
Cash-on-Cash Return
1.7%
Cap rate
0.4%
Rent to Value Ratio
Active
$875,000
2
bds
|
2
ba
|
1,385
sqft
|
built
2015
6169 Park Ln S, Park City, UT 84098
$-2,412
Cash flow
-14.4%
Cash-on-Cash Return
2.4%
Cap rate
0.4%
Rent to Value Ratio
Active
$519,999
2
bds
|
2
ba
|
854
sqft
|
built
1983
6935 N 2200 W, Park City, UT 84098
$-1,347
Cash flow
-13.5%
Cash-on-Cash Return
2.6%
Cap rate
0.5%
Rent to Value Ratio
Active
$1,999,000
3
bds
|
3
ba
|
1,588
sqft
|
built
1972
1467 Crescent Rd, Park City, UT 84060
$-7,933
Cash flow
-20.7%
Cash-on-Cash Return
0.9%
Cap rate
0.2%
Rent to Value Ratio
Active
$17,700,000
7
bds
|
9
ba
|
13,835
sqft
|
built
2001
23 Sandstone Cv, Park City, UT 84060
$-81,441
Cash flow
-24.0%
Cash-on-Cash Return
0.2%
Cap rate
0.0%
Rent to Value Ratio
Active
$14,800,000
4
bds
|
7
ba
|
7,647
sqft
|
built
2021
1358 Mellow Mountain Rd, Park City, UT 84060
$-68,389
Cash flow
-24.1%
Cash-on-Cash Return
0.1%
Cap rate
0.0%
Rent to Value Ratio
Active
$489,950
2
bds
|
2
ba
|
854
sqft
|
built
1984
6905 N 2200 W, Park City, UT 84098
$-1,516
Cash flow
-16.1%
Cash-on-Cash Return
2.0%
Cap rate
0.4%
Rent to Value Ratio
Active
$3,990,000
6
bds
|
7
ba
|
6,874
sqft
|
built
2004
1978 Kidd Cir, Park City, UT 84098
$-14,820
Cash flow
-19.4%
Cash-on-Cash Return
1.2%
Cap rate
0.2%
Rent to Value Ratio
Active
$2,800,000
4
bds
|
4
ba
|
2,460
sqft
|
built
2006
8052 Western Sky, Park City, UT 84098
$-9,733
Cash flow
-18.1%
Cash-on-Cash Return
1.5%
Cap rate
0.3%
Rent to Value Ratio
Active
$2,200,000
5
bds
|
5
ba
|
4,524
sqft
|
built
2005
3239 Creek Rd, Park City, UT 84098
$-5,571
Cash flow
-13.2%
Cash-on-Cash Return
2.6%
Cap rate
0.4%
Rent to Value Ratio
Active
$1,150,000
2
bds
|
2
ba
|
1,153
sqft
|
built
1983
1485 Empire Ave, Park City, UT 84060
$-5,222
Cash flow
-23.7%
Cash-on-Cash Return
0.2%
Cap rate
0.3%
Rent to Value Ratio
Active
$6,075,000
5
bds
|
6
ba
|
4,461
sqft
|
built
1994
347 Mc Henry Ave, Park City, UT 84060
$-24,548
Cash flow
-21.1%
Cash-on-Cash Return
0.8%
Cap rate
0.1%
Rent to Value Ratio
Active
$600,000
1
bds
|
1
ba
|
650
sqft
|
built
1979
2025 Canyons Resort Dr, Park City, UT 84098
$-2,048
Cash flow
-17.8%
Cash-on-Cash Return
1.6%
Cap rate
0.4%
Rent to Value Ratio
Active
$1,500,000
6
bds
|
3
ba
|
4,601
sqft
|
built
1992
7850 Cedar Way, Park City, UT 84098
$-3,170
Cash flow
-11.0%
Cash-on-Cash Return
3.1%
Cap rate
0.4%
Rent to Value Ratio
Active
$6,500,000
5
bds
|
4
ba
|
4,205
sqft
|
built
2007
4746 Old Meadow Ln, Park City, UT 84098
$-26,234
Cash flow
-21.1%
Cash-on-Cash Return
0.8%
Cap rate
0.1%
Rent to Value Ratio
Active
$948,000
4
bds
|
4
ba
|
1,943
sqft
|
built
1995
2708 Cottage Loop, Park City, UT 84098
$-2,631
Cash flow
-14.5%
Cash-on-Cash Return
2.3%
Cap rate
0.4%
Rent to Value Ratio
Active
$1,595,000
2
bds
|
3
ba
|
1,160
sqft
|
built
2019
3703 Blackstone Dr, Park City, UT 84098
$-5,726
Cash flow
-18.7%
Cash-on-Cash Return
1.4%
Cap rate
0.3%
Rent to Value Ratio
Active
$525,000
2
bds
|
2
ba
|
854
sqft
|
built
1983
6821 N 2200 W, Park City, UT 84098
$-1,585
Cash flow
-15.8%
Cash-on-Cash Return
2.1%
Cap rate
0.5%
Rent to Value Ratio
Active
$3,795,000
2
bds
|
4
ba
|
2,998
sqft
|
built
2001
4830 Bear View Dr, Park City, UT 84098
$-15,262
Cash flow
-21.0%
Cash-on-Cash Return
0.9%
Cap rate
0.1%
Rent to Value Ratio
Active
$435,000
bds
|
1
ba
|
335
sqft
|
built
2008
3000 Canyons Resort Dr, Park City, UT 84098
$-2,008
Cash flow
-24.1%
Cash-on-Cash Return
0.1%
Cap rate
0.4%
Rent to Value Ratio
Active
$5,950,000
5
bds
|
6
ba
|
5,977
sqft
|
built
2015
3428 Westview Trl, Park City, UT 84098
$-24,113
Cash flow
-21.1%
Cash-on-Cash Return
0.8%
Cap rate
0.1%
Rent to Value Ratio
Active
$5,900,000
6
bds
|
7
ba
|
3,906
sqft
|
built
2017
80 Daly Ave, Park City, UT 84060
$-24,130
Cash flow
-21.3%
Cash-on-Cash Return
0.8%
Cap rate
0.1%
Rent to Value Ratio