Parkland, FL Investment Properties for Sale
Browse homes for sale and investment properties in Parkland, FL. Refine your search by price, property type, or more.
Best cash flowing properties in Parkland, FL

Active
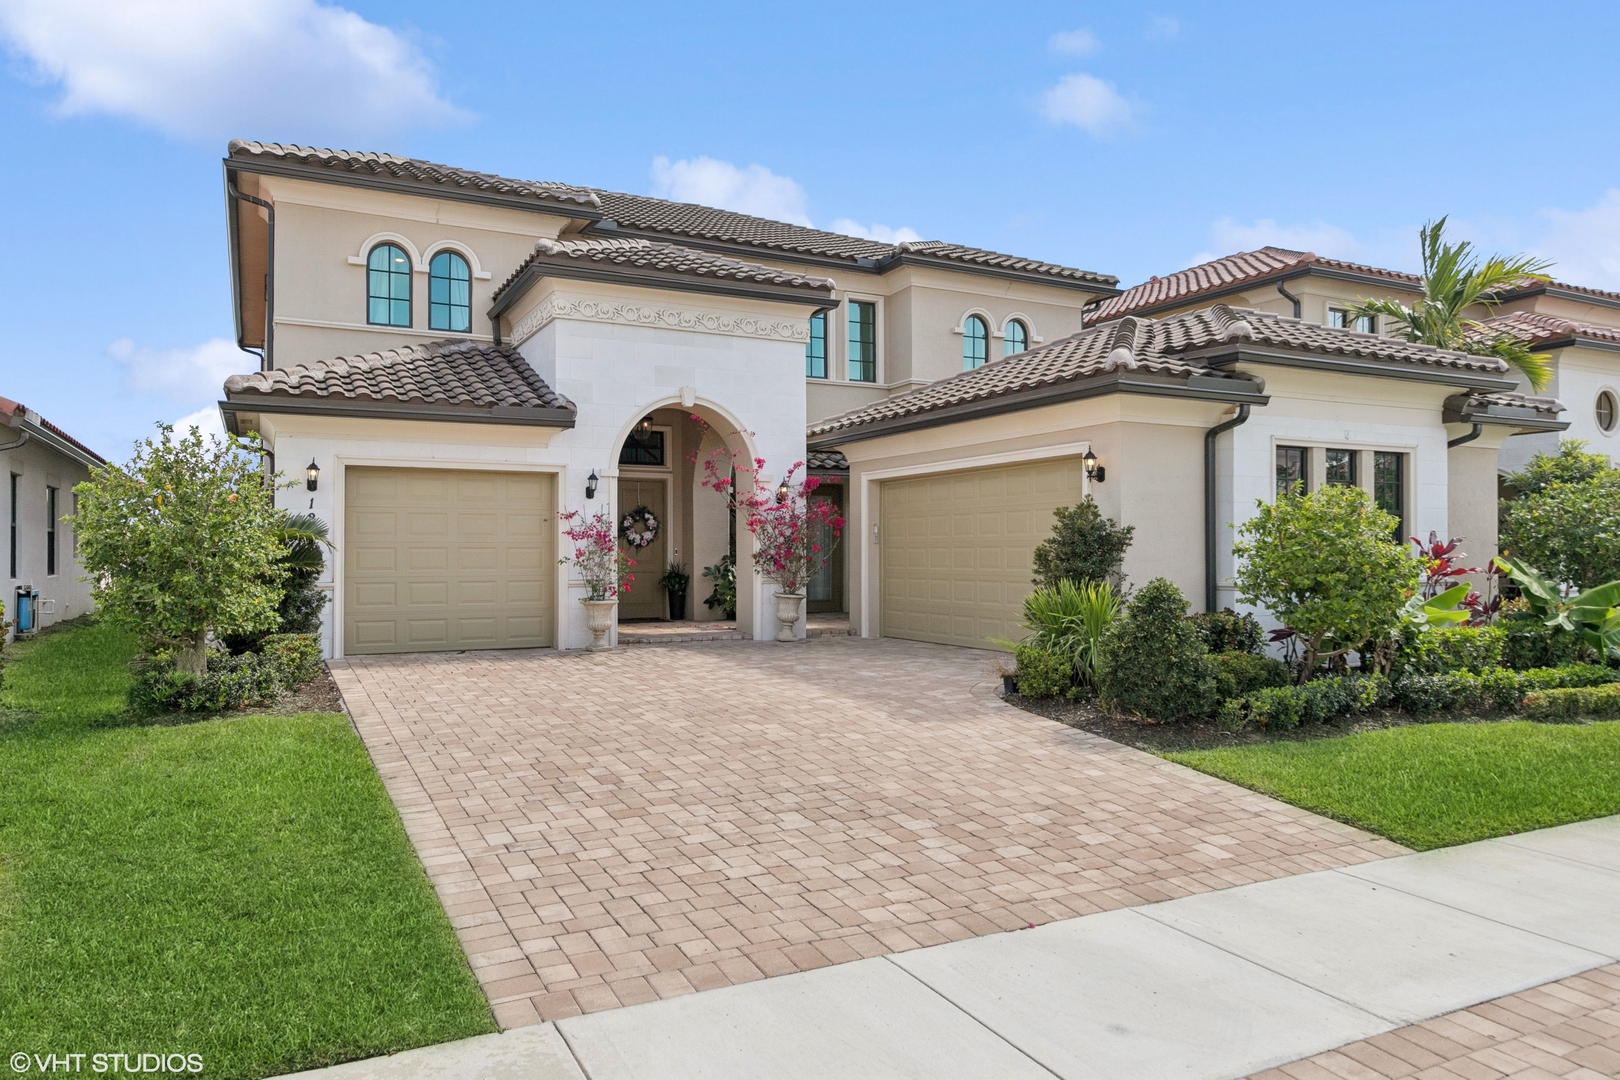
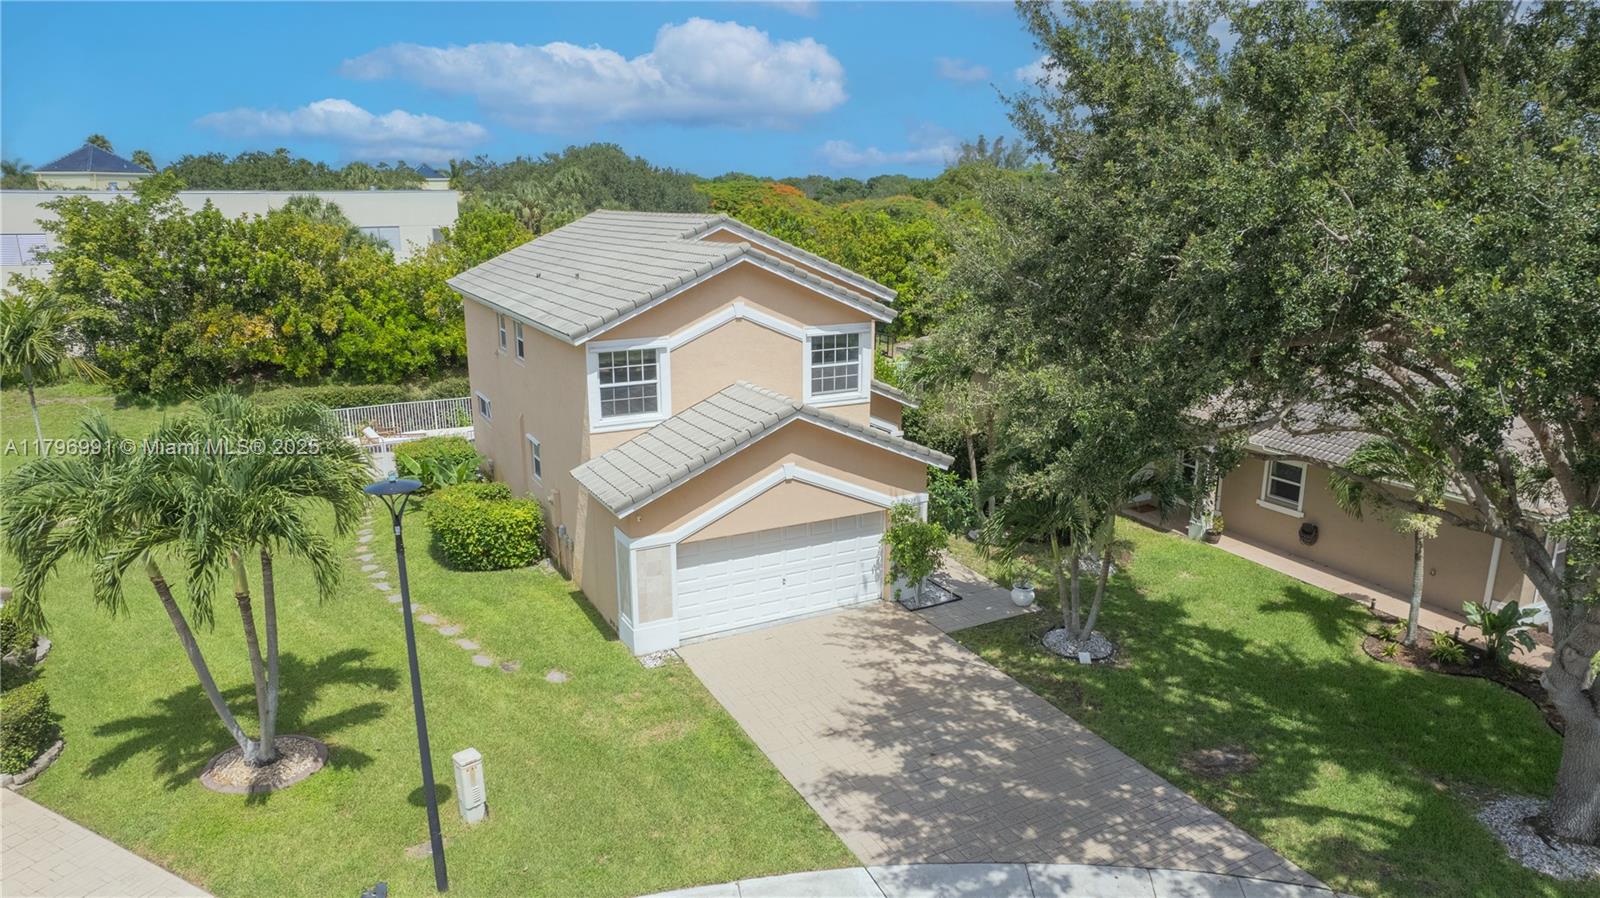
$1,125,000
4
bds
|
3
ba
|
3,133
sqft
|
built
1994
6533 NW 99th Ln, Parkland, FL 33076
$-1,165
Cash flow
-5.4%
Cash-on-Cash Return
5.0%
Cap rate
0.8%
Rent to Value Ratio

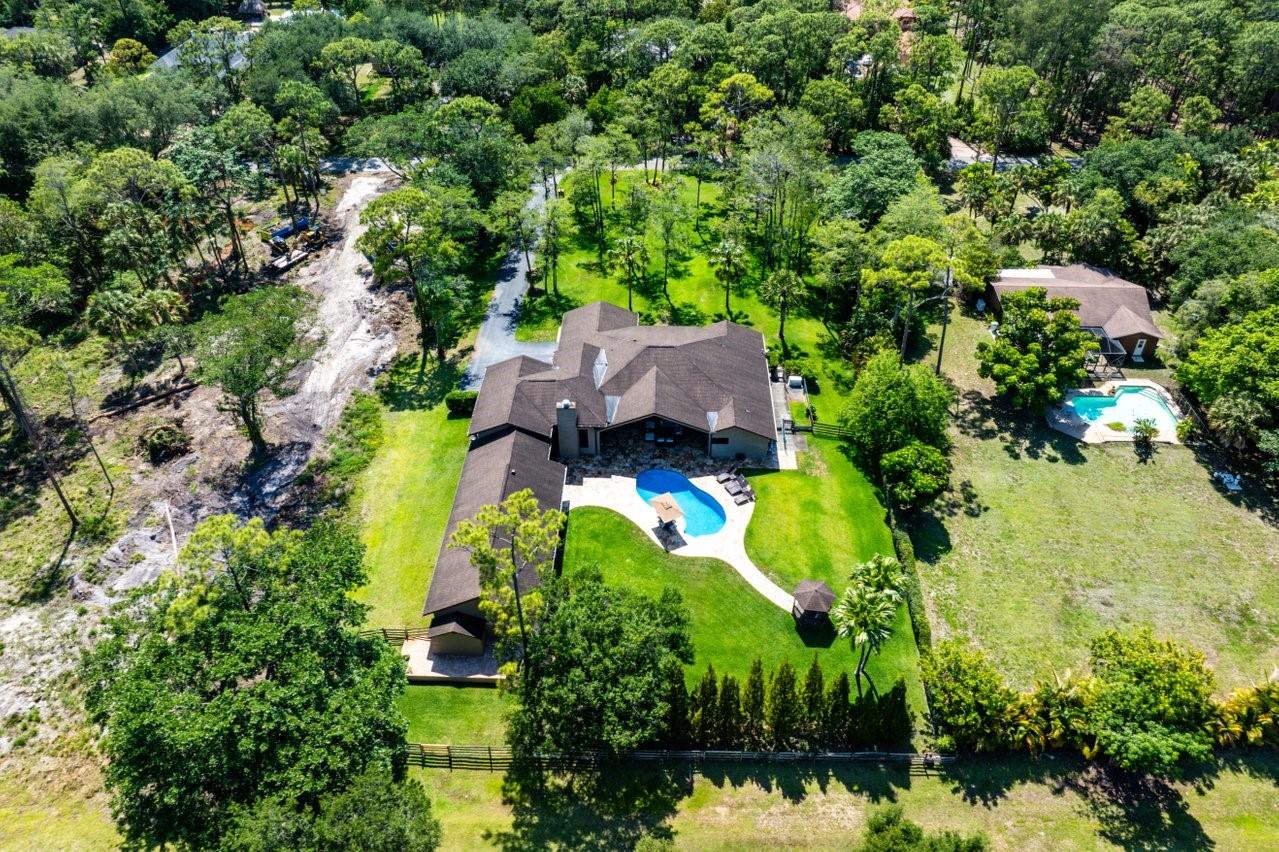
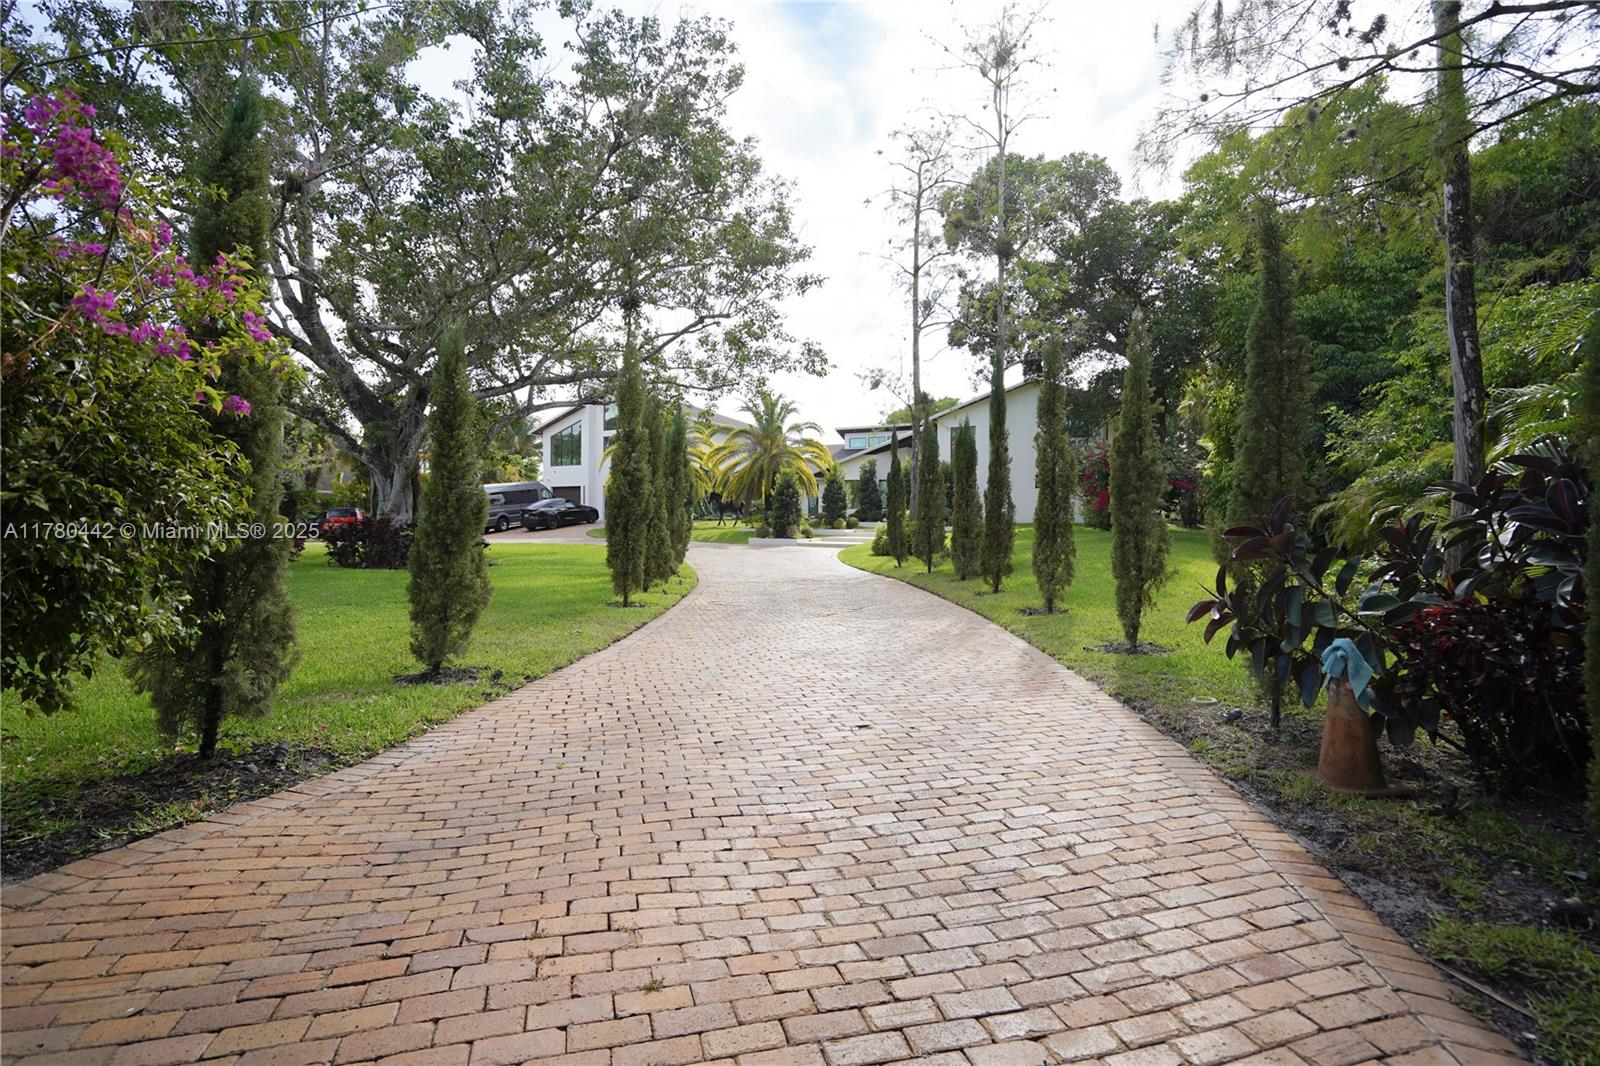
Active
$850,000
4
bds
|
3
ba
|
2,426
sqft
|
built
2007
12520 NW 79th Mnr, Parkland, FL 33076
$-1,170
Cash flow
-7.2%
Cash-on-Cash Return
4.6%
Cap rate
0.8%
Rent to Value Ratio
147 out of 154 properties for sale in Parkland, FL
Limited Results Shown
Create a free account, or log in to reveal all property listings and enjoy the complete experience.

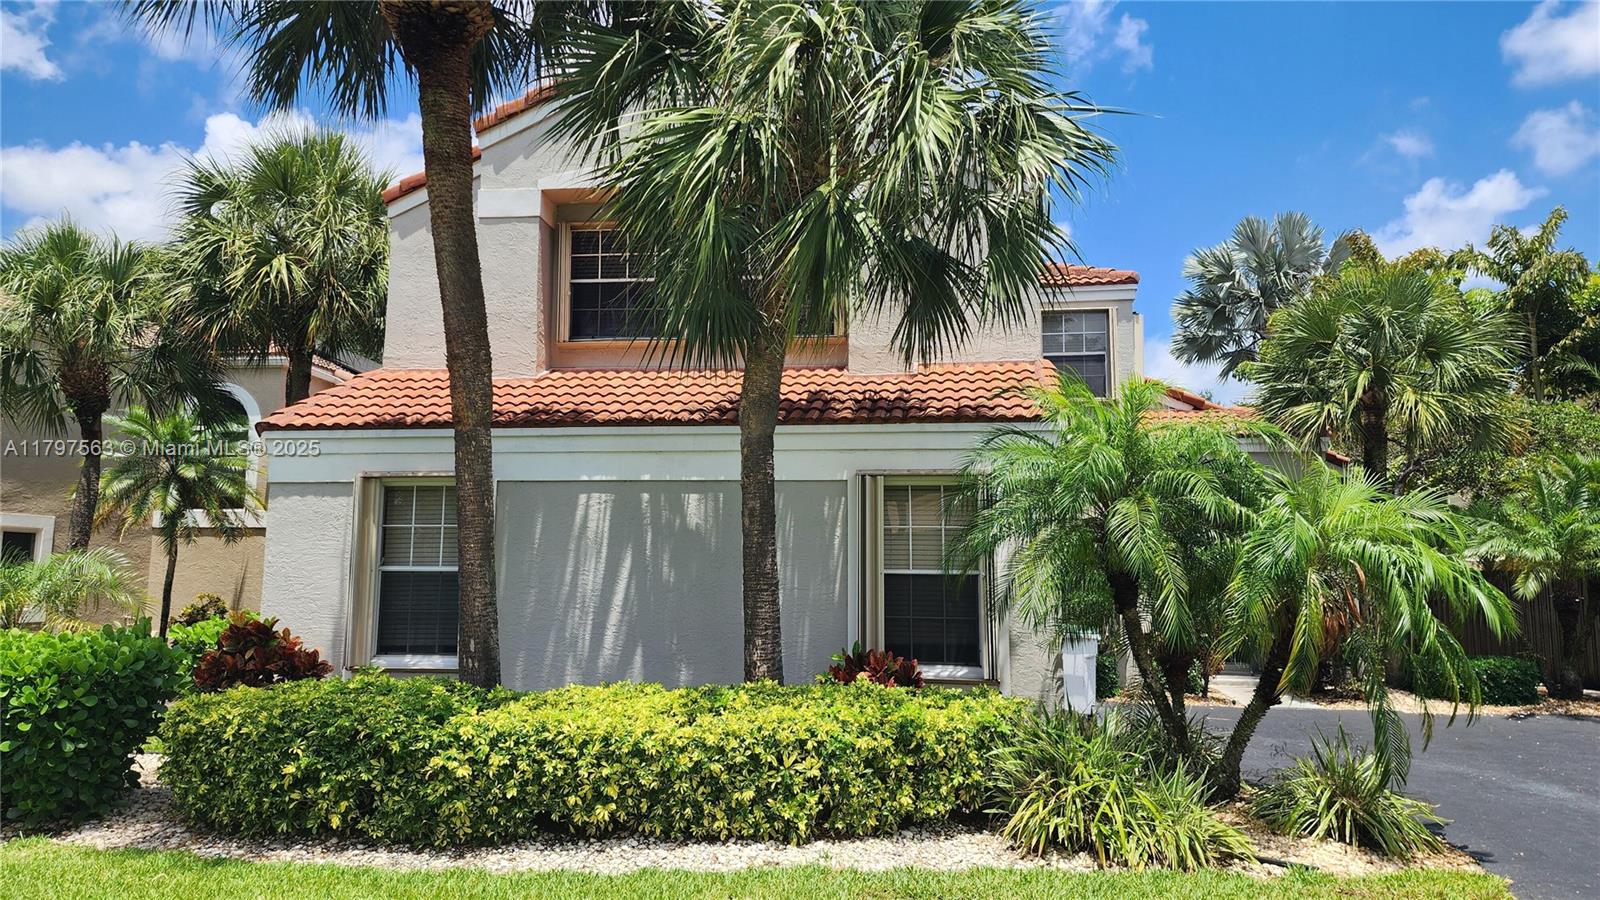
Active
$1,229,900
5
bds
|
3
ba
|
2,876
sqft
|
built
2006
9549 Kenley Ct, Parkland, FL 33076
$-1,701
Cash flow
-7.2%
Cash-on-Cash Return
4.6%
Cap rate
0.8%
Rent to Value Ratio

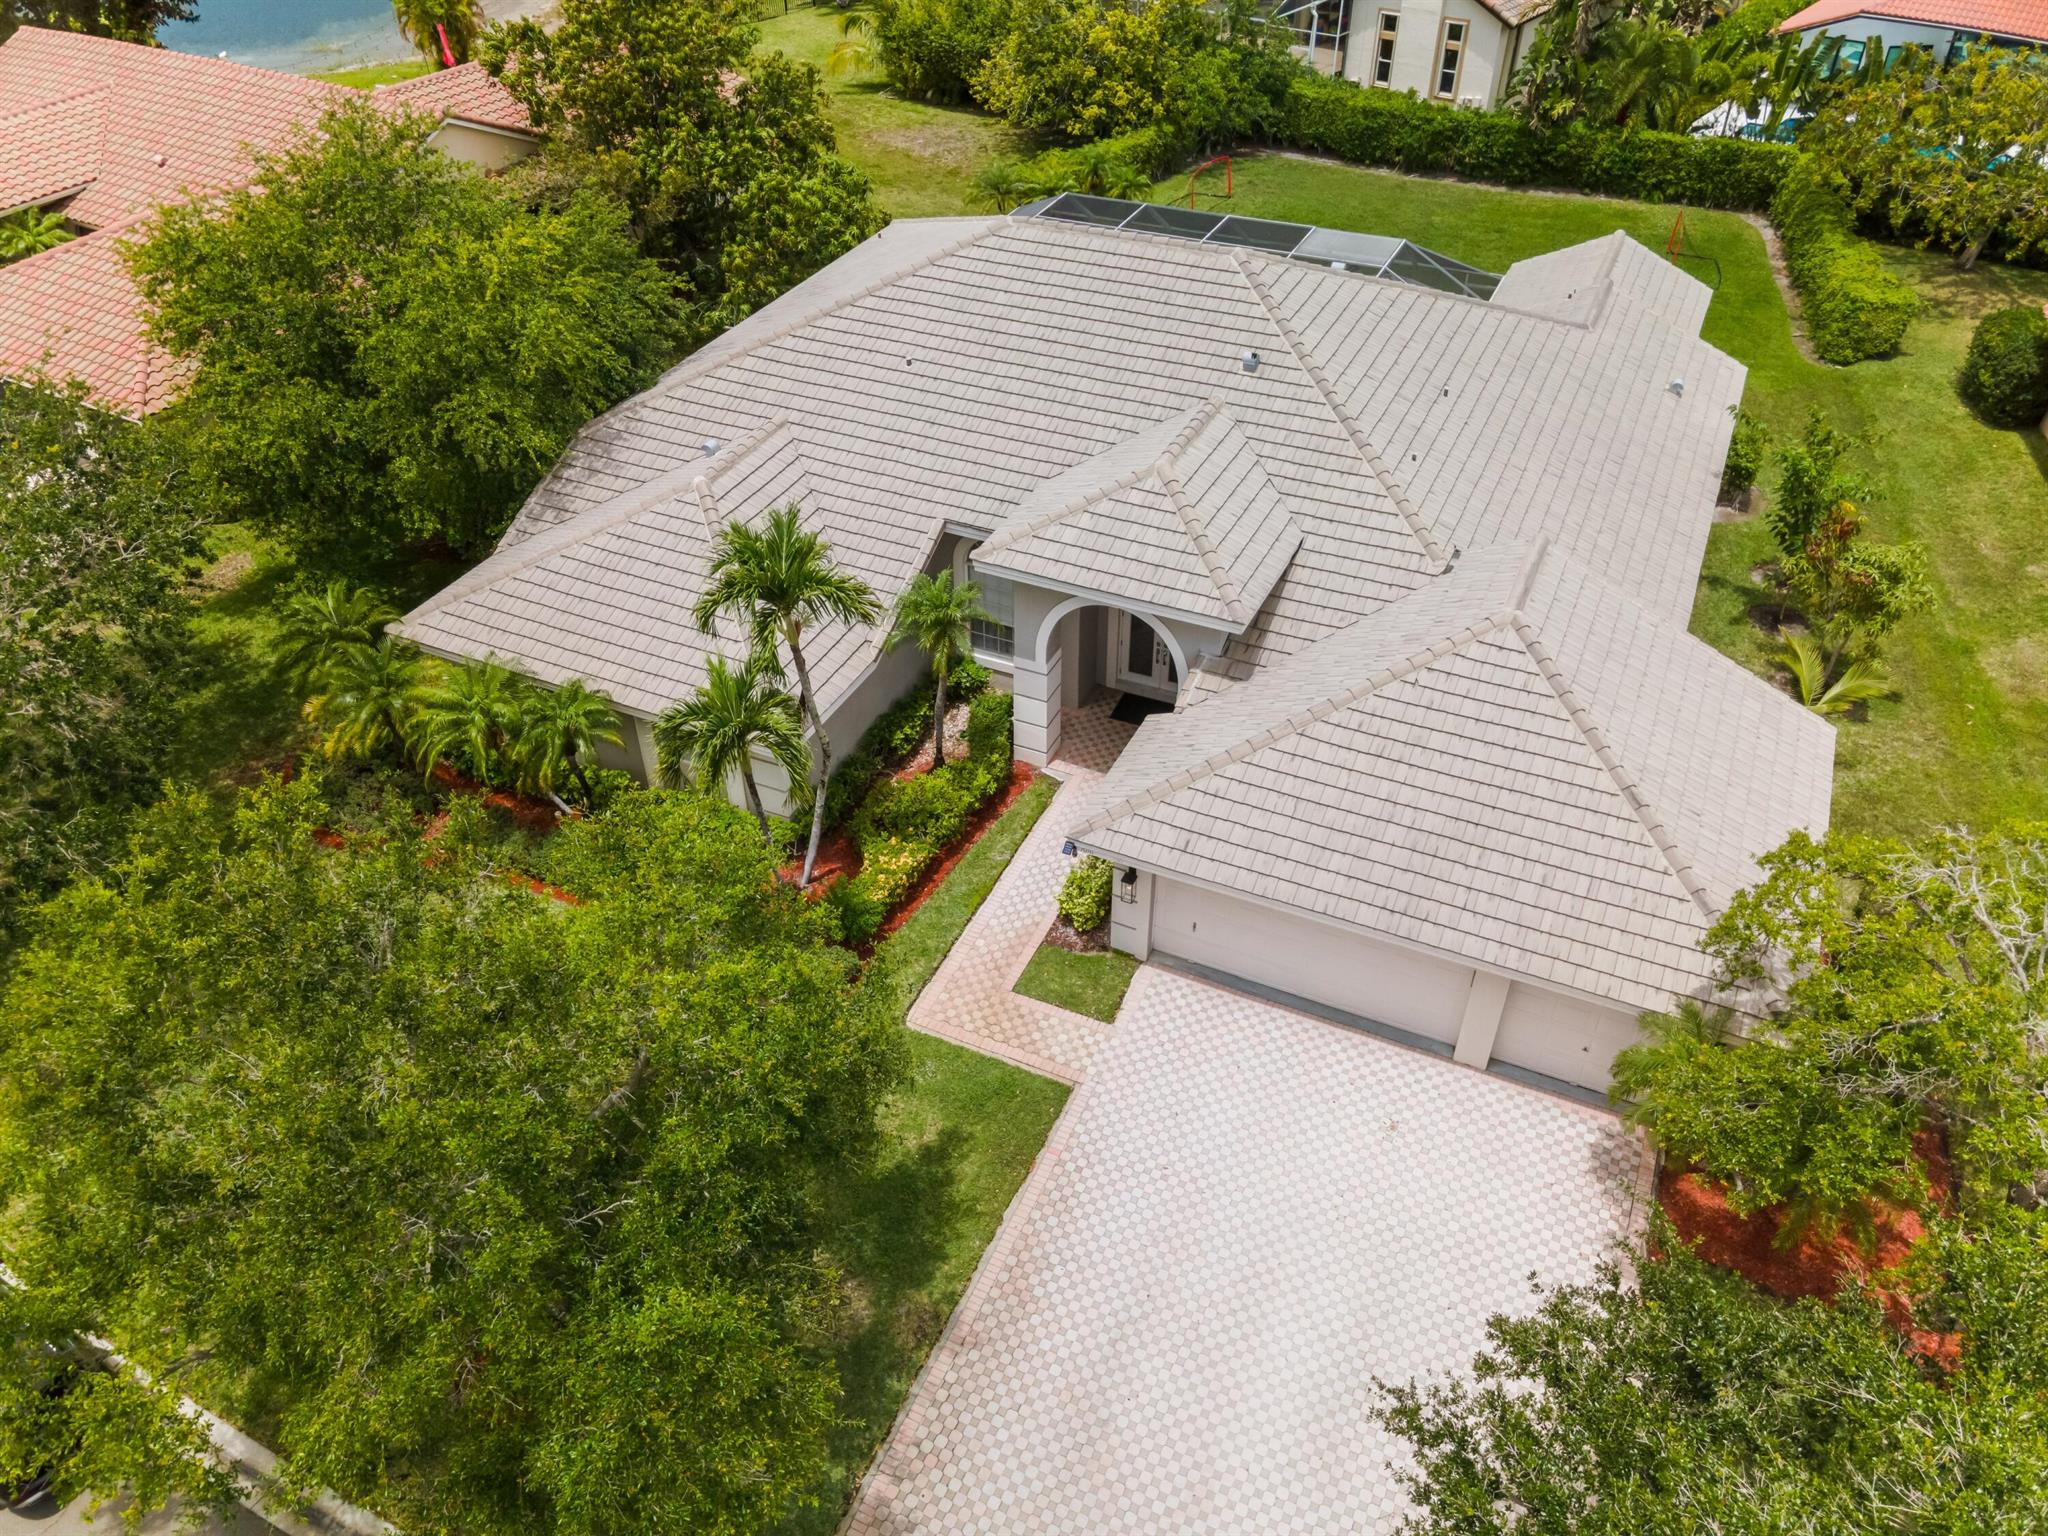
Active
$1,199,000
4
bds
|
5
ba
|
3,388
sqft
|
built
2016
8970 Watercrest Cir W, Parkland, FL 33076
$-4,454
Cash flow
-19.4%
Cash-on-Cash Return
1.8%
Cap rate
0.5%
Rent to Value Ratio

Active
$1,379,000
5
bds
|
4
ba
|
3,508
sqft
|
built
2008
8172 Canopy Ter, Parkland, FL 33076
$-4,071
Cash flow
-15.4%
Cash-on-Cash Return
2.7%
Cap rate
0.6%
Rent to Value Ratio

Active
$1,750,000
5
bds
|
6
ba
|
4,112
sqft
|
built
2022
9015 W Parkland Bay Trl, Parkland, FL 33076
$-8,316
Cash flow
-24.8%
Cash-on-Cash Return
0.6%
Cap rate
0.3%
Rent to Value Ratio
Active
$1,359,000
6
bds
|
4
ba
|
3,734
sqft
|
built
2001
12668 NW 74th Pl, Parkland, FL 33076
$-4,552
Cash flow
-17.5%
Cash-on-Cash Return
2.3%
Cap rate
0.4%
Rent to Value Ratio
Active
$1,240,000
5
bds
|
5
ba
|
3,959
sqft
|
built
2016
11073 Meridian Dr N, Parkland, FL 33076
$-3,091
Cash flow
-13.0%
Cash-on-Cash Return
3.3%
Cap rate
0.7%
Rent to Value Ratio

Active
$982,500
3
bds
|
3
ba
|
2,287
sqft
|
built
2020
11730 Waters Edge Ct, Parkland, FL 33076
$-3,372
Cash flow
-17.9%
Cash-on-Cash Return
2.2%
Cap rate
0.5%
Rent to Value Ratio
Active
$1,099,000
5
bds
|
4
ba
|
3,572
sqft
|
built
2010
7604 NW 113th Ave, Parkland, FL 33076
$-2,248
Cash flow
-10.7%
Cash-on-Cash Return
3.8%
Cap rate
0.6%
Rent to Value Ratio

Active
$1,025,000
4
bds
|
3
ba
|
2,972
sqft
|
built
2014
8971 Edgewater Bnd, Parkland, FL 33076
$-2,637
Cash flow
-13.4%
Cash-on-Cash Return
3.2%
Cap rate
0.7%
Rent to Value Ratio
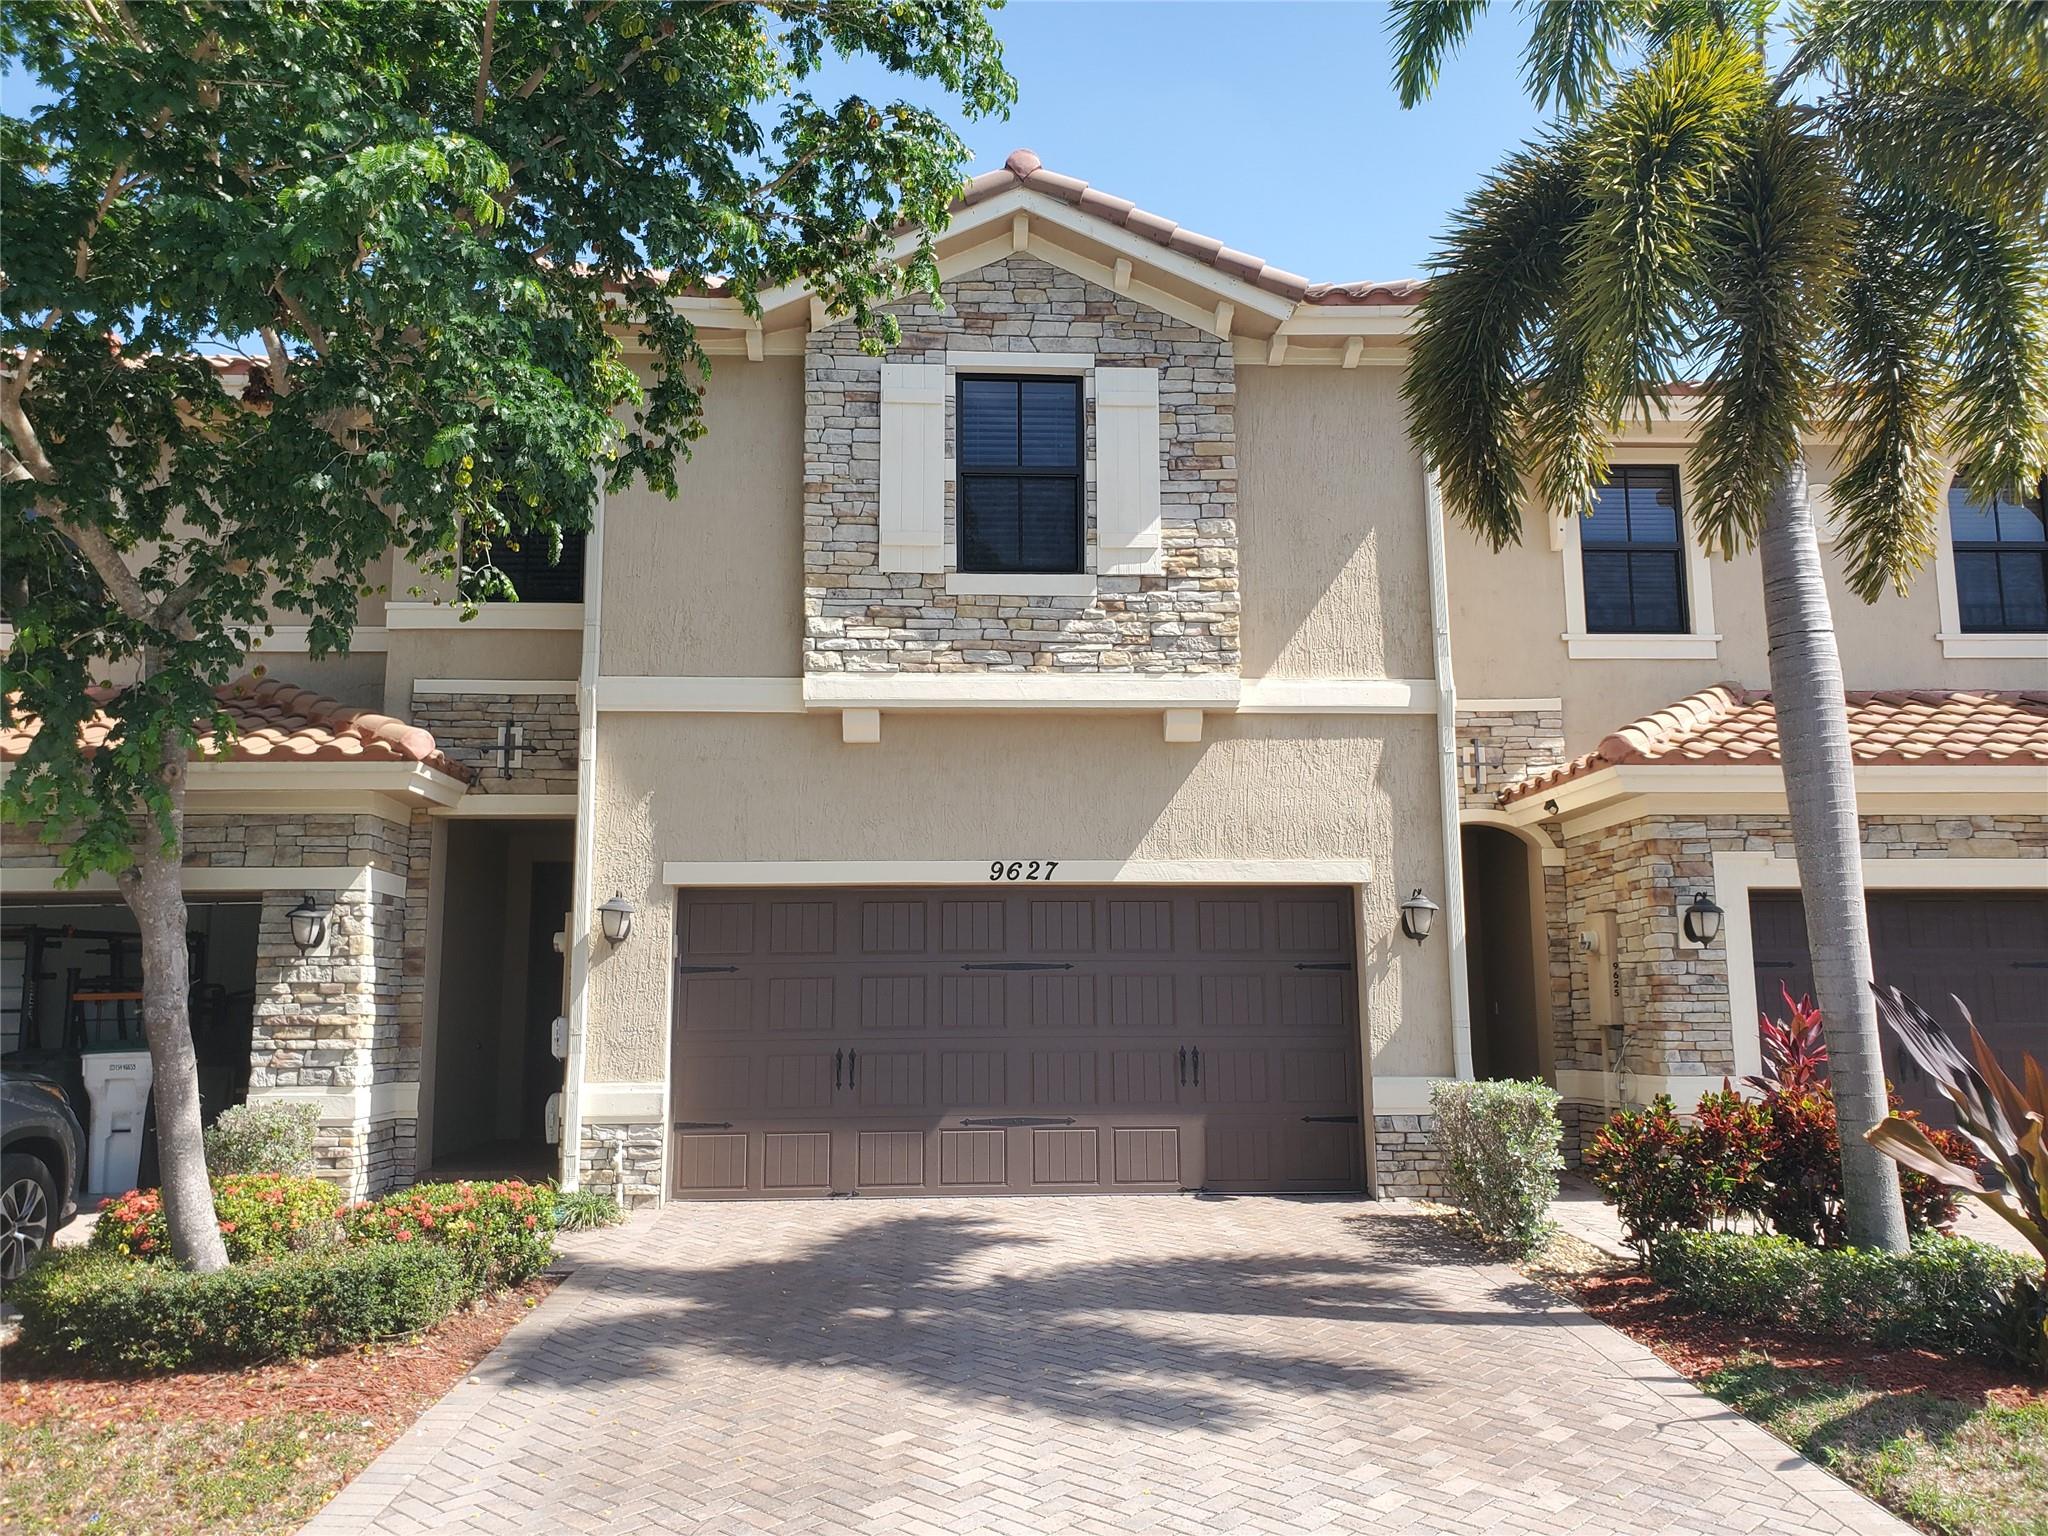
Active
$620,000
4
bds
|
4
ba
|
1,714
sqft
|
built
2015
9627 Watercrest Isle, Parkland, FL 33076
$-1,850
Cash flow
-15.6%
Cash-on-Cash Return
2.7%
Cap rate
0.7%
Rent to Value Ratio

Active
$1,900,000
6
bds
|
5
ba
|
5,211
sqft
|
built
2002
7460 NW 127th Ter, Parkland, FL 33076
$-7,314
Cash flow
-20.1%
Cash-on-Cash Return
1.7%
Cap rate
0.3%
Rent to Value Ratio

Active
$2,799,000
6
bds
|
5
ba
|
5,889
sqft
|
built
1988
7722 Schooner Ct, Parkland, FL 33067
$-12,734
Cash flow
-23.7%
Cash-on-Cash Return
0.8%
Cap rate
0.3%
Rent to Value Ratio

Active
$1,620,000
4
bds
|
4
ba
|
4,091
sqft
|
built
1984
6298 NW 62nd Ter, Parkland, FL 33067
$-4,172
Cash flow
-13.4%
Cash-on-Cash Return
3.2%
Cap rate
0.6%
Rent to Value Ratio
Active
$1,649,000
5
bds
|
6
ba
|
3,959
sqft
|
built
2021
12060 Lake Trail Ln, Parkland, FL 33076
$-6,461
Cash flow
-20.4%
Cash-on-Cash Return
1.6%
Cap rate
0.4%
Rent to Value Ratio
Active
$1,850,000
5
bds
|
4
ba
|
4,236
sqft
|
built
1986
5840 NW 66th Ave, Parkland, FL 33067
$-7,077
Cash flow
-20.0%
Cash-on-Cash Return
1.7%
Cap rate
0.3%
Rent to Value Ratio
Active
$834,000
5
bds
|
3
ba
|
2,681
sqft
|
built
1990
6365 NW 77th Pl, Parkland, FL 33067
$-2,168
Cash flow
-13.6%
Cash-on-Cash Return
3.2%
Cap rate
0.6%
Rent to Value Ratio
Active
$1,390,000
6
bds
|
4
ba
|
3,207
sqft
|
built
1992
10111 NW 58th Ct, Parkland, FL 33076
$-4,685
Cash flow
-17.6%
Cash-on-Cash Return
2.2%
Cap rate
0.4%
Rent to Value Ratio
Active
$719,000
4
bds
|
3
ba
|
2,036
sqft
|
built
2001
7423 NW 70th Ave, Parkland, FL 33067
$-1,370
Cash flow
-9.9%
Cash-on-Cash Return
4.0%
Cap rate
0.6%
Rent to Value Ratio

Active
$939,000
4
bds
|
3
ba
|
2,676
sqft
|
built
2007
12415 NW 81st St, Parkland, FL 33076
$-2,672
Cash flow
-14.8%
Cash-on-Cash Return
2.9%
Cap rate
0.6%
Rent to Value Ratio

Active
$775,000
4
bds
|
2
ba
|
2,071
sqft
|
built
1995
7535 NW 71st Ter, Parkland, FL 33067
$-1,875
Cash flow
-12.6%
Cash-on-Cash Return
3.4%
Cap rate
0.5%
Rent to Value Ratio
Active
$850,000
4
bds
|
3
ba
|
2,426
sqft
|
built
2007
12520 NW 79th Mnr, Parkland, FL 33076
$-1,170
Cash flow
-7.2%
Cash-on-Cash Return
4.6%
Cap rate
0.8%
Rent to Value Ratio
Active
$3,750,000
5
bds
|
5
ba
|
6,419
sqft
|
built
1986
5251 NW 80th Ter, Parkland, FL 33067
$-19,800
Cash flow
-27.5%
Cash-on-Cash Return
-0.1%
Cap rate
0.1%
Rent to Value Ratio
Active
$725,000
4
bds
|
2
ba
|
2,149
sqft
|
built
1995
7868 NW 71st Way, Parkland, FL 33067
$-1,815
Cash flow
-13.1%
Cash-on-Cash Return
3.3%
Cap rate
0.6%
Rent to Value Ratio
Active
$649,999
3
bds
|
2
ba
|
1,663
sqft
|
built
2004
7581 Old Thyme Ct, Parkland, FL 33076
$-1,746
Cash flow
-14.0%
Cash-on-Cash Return
3.1%
Cap rate
0.8%
Rent to Value Ratio
Active
$549,000
3
bds
|
3
ba
|
1,616
sqft
|
built
2010
10850 NW 74th Dr, Parkland, FL 33076
$-1,236
Cash flow
-11.7%
Cash-on-Cash Return
3.6%
Cap rate
0.7%
Rent to Value Ratio

Active
$765,000
4
bds
|
3
ba
|
2,340
sqft
|
built
1991
5731 NW 62nd Mnr, Parkland, FL 33067
$-1,307
Cash flow
-8.9%
Cash-on-Cash Return
4.2%
Cap rate
0.6%
Rent to Value Ratio

Active
$1,199,000
4
bds
|
3
ba
|
4,756
sqft
|
built
2020
10865 Oceano Way, Parkland, FL 33076
$-4,685
Cash flow
-20.4%
Cash-on-Cash Return
1.6%
Cap rate
0.5%
Rent to Value Ratio

Active
$939,000
4
bds
|
3
ba
|
2,547
sqft
|
built
2001
7501 NW 115th Ter, Parkland, FL 33076
$-2,308
Cash flow
-12.8%
Cash-on-Cash Return
3.3%
Cap rate
0.6%
Rent to Value Ratio

Active
$894,900
4
bds
|
3
ba
|
2,316
sqft
|
built
1992
6805 NW 75th Pl, Parkland, FL 33067
$-2,643
Cash flow
-15.4%
Cash-on-Cash Return
2.7%
Cap rate
0.4%
Rent to Value Ratio

Active
$2,595,000
6
bds
|
6
ba
|
5,228
sqft
|
built
2018
8691 Waterview Ter, Parkland, FL 33076
$-9,134
Cash flow
-18.4%
Cash-on-Cash Return
2.1%
Cap rate
0.4%
Rent to Value Ratio

Pending
$1,170,000
3
bds
|
3
ba
|
2,287
sqft
|
built
2021
12170 N Baypoint Cir, Parkland, FL 33076
$-2,933
Cash flow
-13.1%
Cash-on-Cash Return
3.3%
Cap rate
0.7%
Rent to Value Ratio
Active under contract
$1,299,000
5
bds
|
3
ba
|
3,265
sqft
|
built
2005
8274 NW 107th Ter, Parkland, FL 33076
$-4,102
Cash flow
-16.5%
Cash-on-Cash Return
2.5%
Cap rate
0.4%
Rent to Value Ratio

Active
$1,249,900
5
bds
|
3
ba
|
3,613
sqft
|
built
2003
12169 NW 75th Pl, Parkland, FL 33076
$-2,534
Cash flow
-10.6%
Cash-on-Cash Return
3.9%
Cap rate
0.7%
Rent to Value Ratio

Active
$700,000
3
bds
|
3
ba
|
2,196
sqft
|
built
2002
11655 NW 71st Pl, Parkland, FL 33076
$-1,596
Cash flow
-11.9%
Cash-on-Cash Return
3.5%
Cap rate
0.7%
Rent to Value Ratio

Active
$924,900
4
bds
|
3
ba
|
2,834
sqft
|
built
2001
6842 NW 108th Ave, Parkland, FL 33076
$-1,936
Cash flow
-10.9%
Cash-on-Cash Return
3.8%
Cap rate
0.7%
Rent to Value Ratio
Active
$1,125,000
4
bds
|
3
ba
|
3,133
sqft
|
built
1994
6533 NW 99th Ln, Parkland, FL 33076
$-1,165
Cash flow
-5.4%
Cash-on-Cash Return
5.0%
Cap rate
0.8%
Rent to Value Ratio

Active
$1,140,000
5
bds
|
4
ba
|
3,161
sqft
|
built
1999
10645 NW 69th Pl, Parkland, FL 33076
$-3,202
Cash flow
-14.7%
Cash-on-Cash Return
2.9%
Cap rate
0.5%
Rent to Value Ratio

Active
$3,499,000
5
bds
|
7
ba
|
6,358
sqft
|
built
2019
10343 S Barnsley Dr, Parkland, FL 33076
$-17,126
Cash flow
-25.5%
Cash-on-Cash Return
0.4%
Cap rate
0.2%
Rent to Value Ratio

Active
$1,250,000
4
bds
|
4
ba
|
3,392
sqft
|
built
1990
6901 NW 61st Ave, Parkland, FL 33067
$-3,213
Cash flow
-13.4%
Cash-on-Cash Return
3.2%
Cap rate
0.5%
Rent to Value Ratio

Active
$1,250,000
4
bds
|
3
ba
|
2,374
sqft
|
built
1971
5617 NW 79th Way, Parkland, FL 33067
$-4,460
Cash flow
-18.6%
Cash-on-Cash Return
2.0%
Cap rate
0.4%
Rent to Value Ratio