Parkland, FL Investment Properties for Sale
Browse homes for sale and investment properties in Parkland, FL. Refine your search by price, property type, or more.
Best cash flowing properties in Parkland, FL
Active
$799,000
4
bds
|
3
ba
|
2,611
sqft
|
built
1996
6713 NW 80th Mnr, Parkland, FL 33067
$-1,360
Cash flow
-8.9%
Cash-on-Cash Return
4.2%
Cap rate
0.6%
Rent to Value Ratio
Active
$760,000
3
bds
|
3
ba
|
2,378
sqft
|
built
1992
5900 NW 58th Ter, Parkland, FL 33067
$-1,532
Cash flow
-10.5%
Cash-on-Cash Return
3.9%
Cap rate
0.6%
Rent to Value Ratio
146 out of 152 properties for sale in Parkland, FL
Limited Results Shown
Create a free account, or log in to reveal all property listings and enjoy the complete experience.
Active
$1,399,999
5
bds
|
4
ba
|
4,176
sqft
|
built
2017
9800 S Miralago Way, Parkland, FL 33076
$-4,320
Cash flow
-16.1%
Cash-on-Cash Return
2.6%
Cap rate
0.6%
Rent to Value Ratio
Active
$1,298,000
5
bds
|
3
ba
|
4,061
sqft
|
built
2006
12334 NW 80th Pl, Parkland, FL 33076
$-2,816
Cash flow
-11.3%
Cash-on-Cash Return
3.7%
Cap rate
0.6%
Rent to Value Ratio
Active
$1,299,000
5
bds
|
3
ba
|
3,735
sqft
|
built
2005
7126 Spyglass Ave, Parkland, FL 33076
$-3,669
Cash flow
-14.7%
Cash-on-Cash Return
2.9%
Cap rate
0.7%
Rent to Value Ratio
Active
$1,150,000
4
bds
|
3
ba
|
2,856
sqft
|
built
2018
12155 S Baypoint Cir, Parkland, FL 33076
$-3,805
Cash flow
-17.3%
Cash-on-Cash Return
2.3%
Cap rate
0.5%
Rent to Value Ratio
Active under contract
$1,799,000
5
bds
|
4
ba
|
3,353
sqft
|
built
2014
6934 Lost Garden Ter, Parkland, FL 33076
$-4,458
Cash flow
-12.9%
Cash-on-Cash Return
3.3%
Cap rate
0.6%
Rent to Value Ratio
Active
$899,900
4
bds
|
3
ba
|
2,450
sqft
|
built
2004
10758 NW 83rd Ct, Parkland, FL 33076
$-2,283
Cash flow
-13.2%
Cash-on-Cash Return
3.2%
Cap rate
0.6%
Rent to Value Ratio
Active
$1,599,900
4
bds
|
4
ba
|
3,848
sqft
|
built
2017
11645 Solstice Cir, Parkland, FL 33076
$-3,762
Cash flow
-12.3%
Cash-on-Cash Return
3.5%
Cap rate
0.6%
Rent to Value Ratio
Active
$2,175,000
5
bds
|
6
ba
|
4,350
sqft
|
built
2007
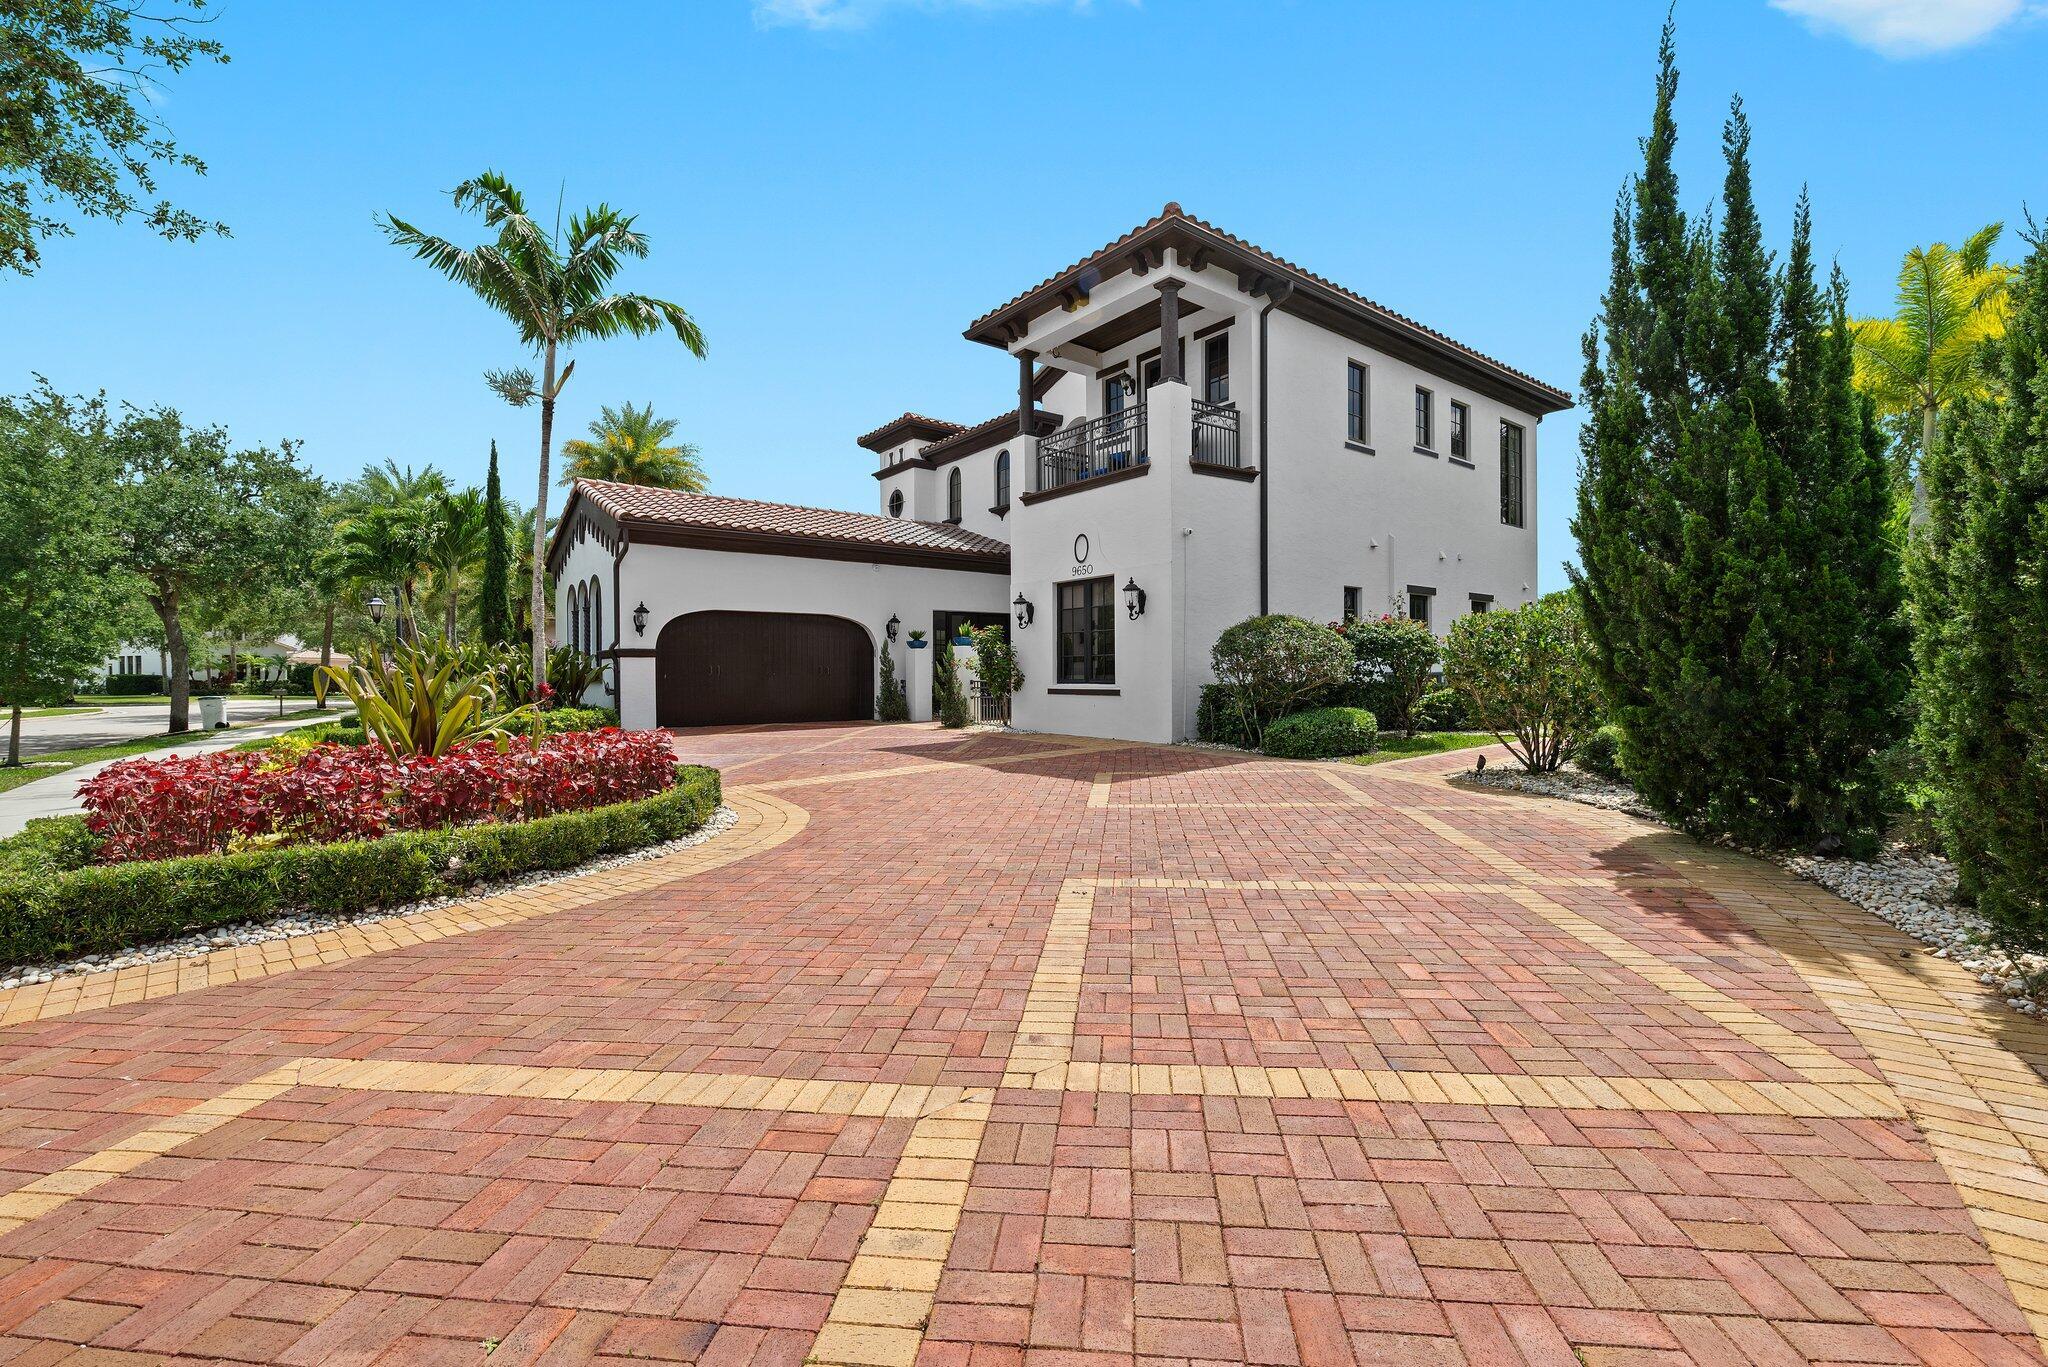
9650 Eden Mnr, Parkland, FL 33076
$-8,525
Cash flow
-20.4%
Cash-on-Cash Return
1.6%
Cap rate
0.4%
Rent to Value Ratio
Active
$1,674,900
5
bds
|
4
ba
|
3,494
sqft
|
built
2014
8825 Watercrest Cir E, Parkland, FL 33076
$-4,173
Cash flow
-13.0%
Cash-on-Cash Return
3.3%
Cap rate
0.6%
Rent to Value Ratio
Active
$1,395,000
3
bds
|
4
ba
|
3,100
sqft
|
built
1984
5755 NW 65th Ter, Parkland, FL 33067
$-4,720
Cash flow
-17.7%
Cash-on-Cash Return
2.2%
Cap rate
0.4%
Rent to Value Ratio

Active
$629,000
3
bds
|
2
ba
|
1,663
sqft
|
built
2005
7641 Old Thyme Ct, Parkland, FL 33076
$-3,215
Cash flow
-26.7%
Cash-on-Cash Return
0.2%
Cap rate
0.7%
Rent to Value Ratio
Active
$1,475,000
6
bds
|
5
ba
|
4,204
sqft
|
built
2003
7503 NW 124th Ave, Parkland, FL 33076
$-4,386
Cash flow
-15.5%
Cash-on-Cash Return
2.7%
Cap rate
0.5%
Rent to Value Ratio
Active
$845,000
4
bds
|
3
ba
|
2,340
sqft
|
built
2010
7503 NW 113th Ave, Parkland, FL 33076
$-1,799
Cash flow
-11.1%
Cash-on-Cash Return
3.7%
Cap rate
0.6%
Rent to Value Ratio
Active
$2,899,000
6
bds
|
7
ba
|
5,985
sqft
|
built
2007
7240 Lemon Grass Dr, Parkland, FL 33076
$-10,587
Cash flow
-19.1%
Cash-on-Cash Return
1.9%
Cap rate
0.4%
Rent to Value Ratio
Active
$1,998,333
5
bds
|
5
ba
|
4,227
sqft
|
built
2006
9481 Eden Mnr, Parkland, FL 33076
$-5,612
Cash flow
-14.7%
Cash-on-Cash Return
2.9%
Cap rate
0.6%
Rent to Value Ratio
Active
$1,999,999
7
bds
|
5
ba
|
4,711
sqft
|
built
2006
9387 Satinleaf Pl, Parkland, FL 33076
$-5,884
Cash flow
-15.3%
Cash-on-Cash Return
2.8%
Cap rate
0.6%
Rent to Value Ratio
Active
$1,165,000
5
bds
|
4
ba
|
3,871
sqft
|
built
1999
6543 NW 105th Ter, Parkland, FL 33076
$-2,459
Cash flow
-11.0%
Cash-on-Cash Return
3.8%
Cap rate
0.6%
Rent to Value Ratio
Active
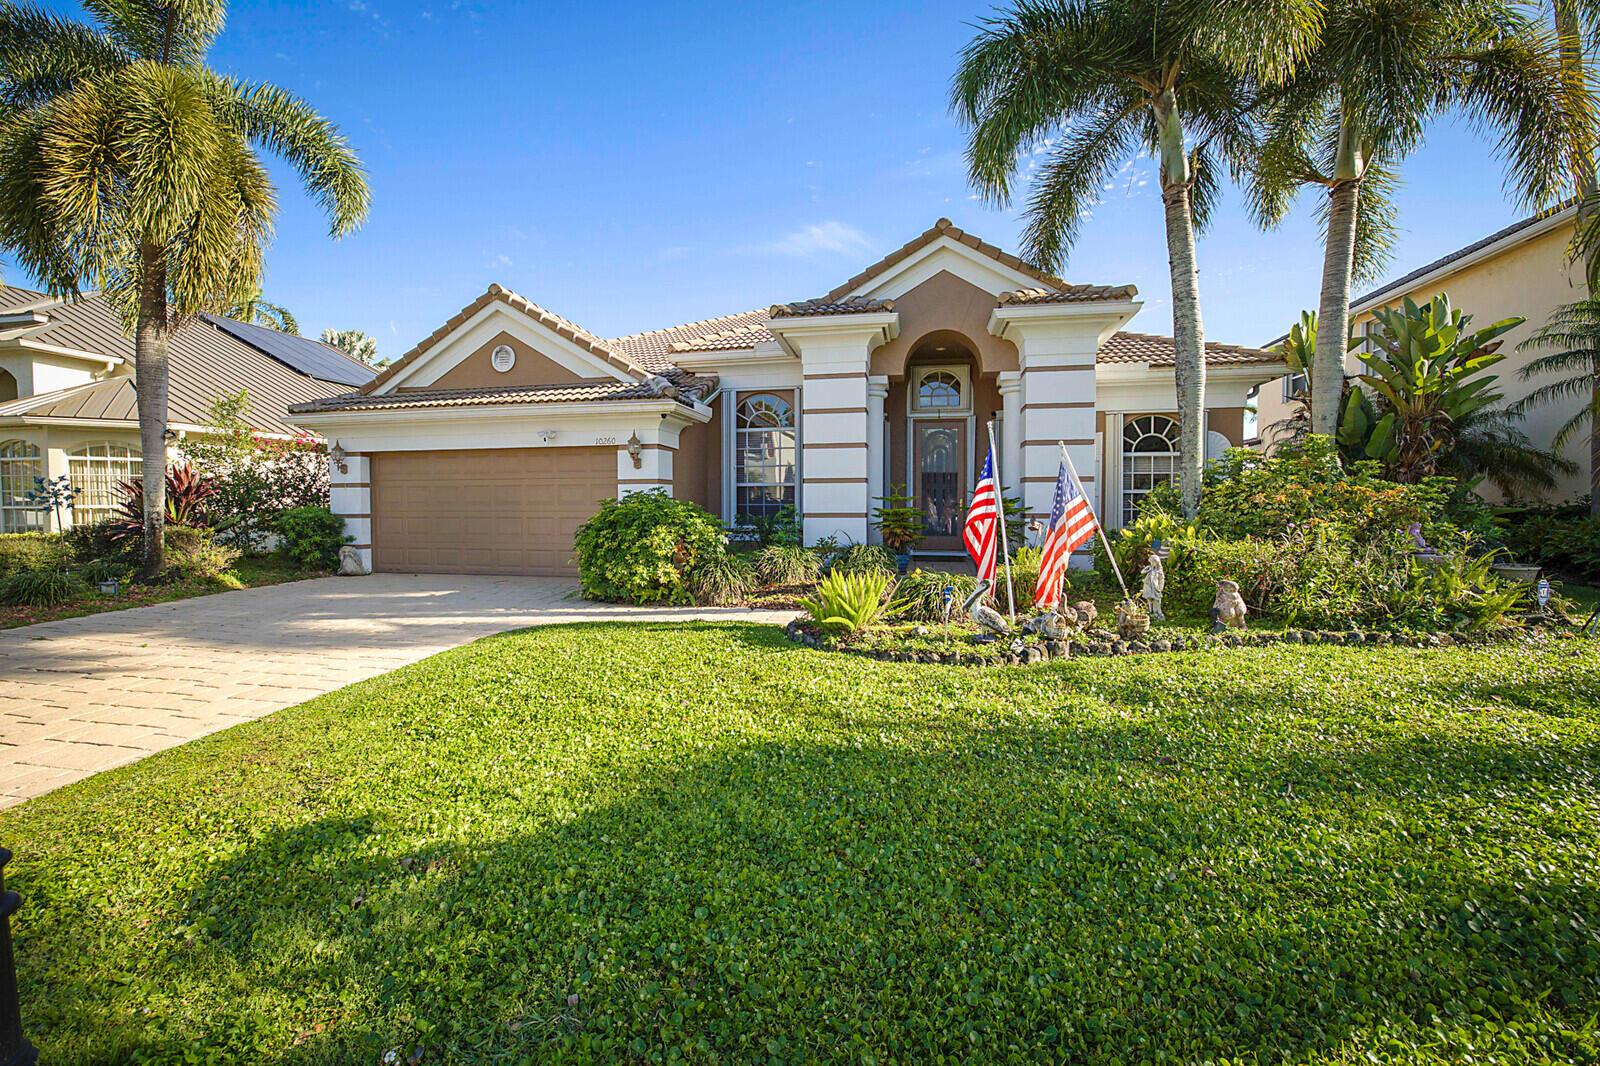
$965,000
4
bds
|
3
ba
|
2,470
sqft
|
built
1997
10260 NW 60th Pl, Parkland, FL 33076
$-1,658
Cash flow
-9.0%
Cash-on-Cash Return
4.2%
Cap rate
0.7%
Rent to Value Ratio
Active
$1,075,000
5
bds
|
3
ba
|
3,451
sqft
|
built
2005
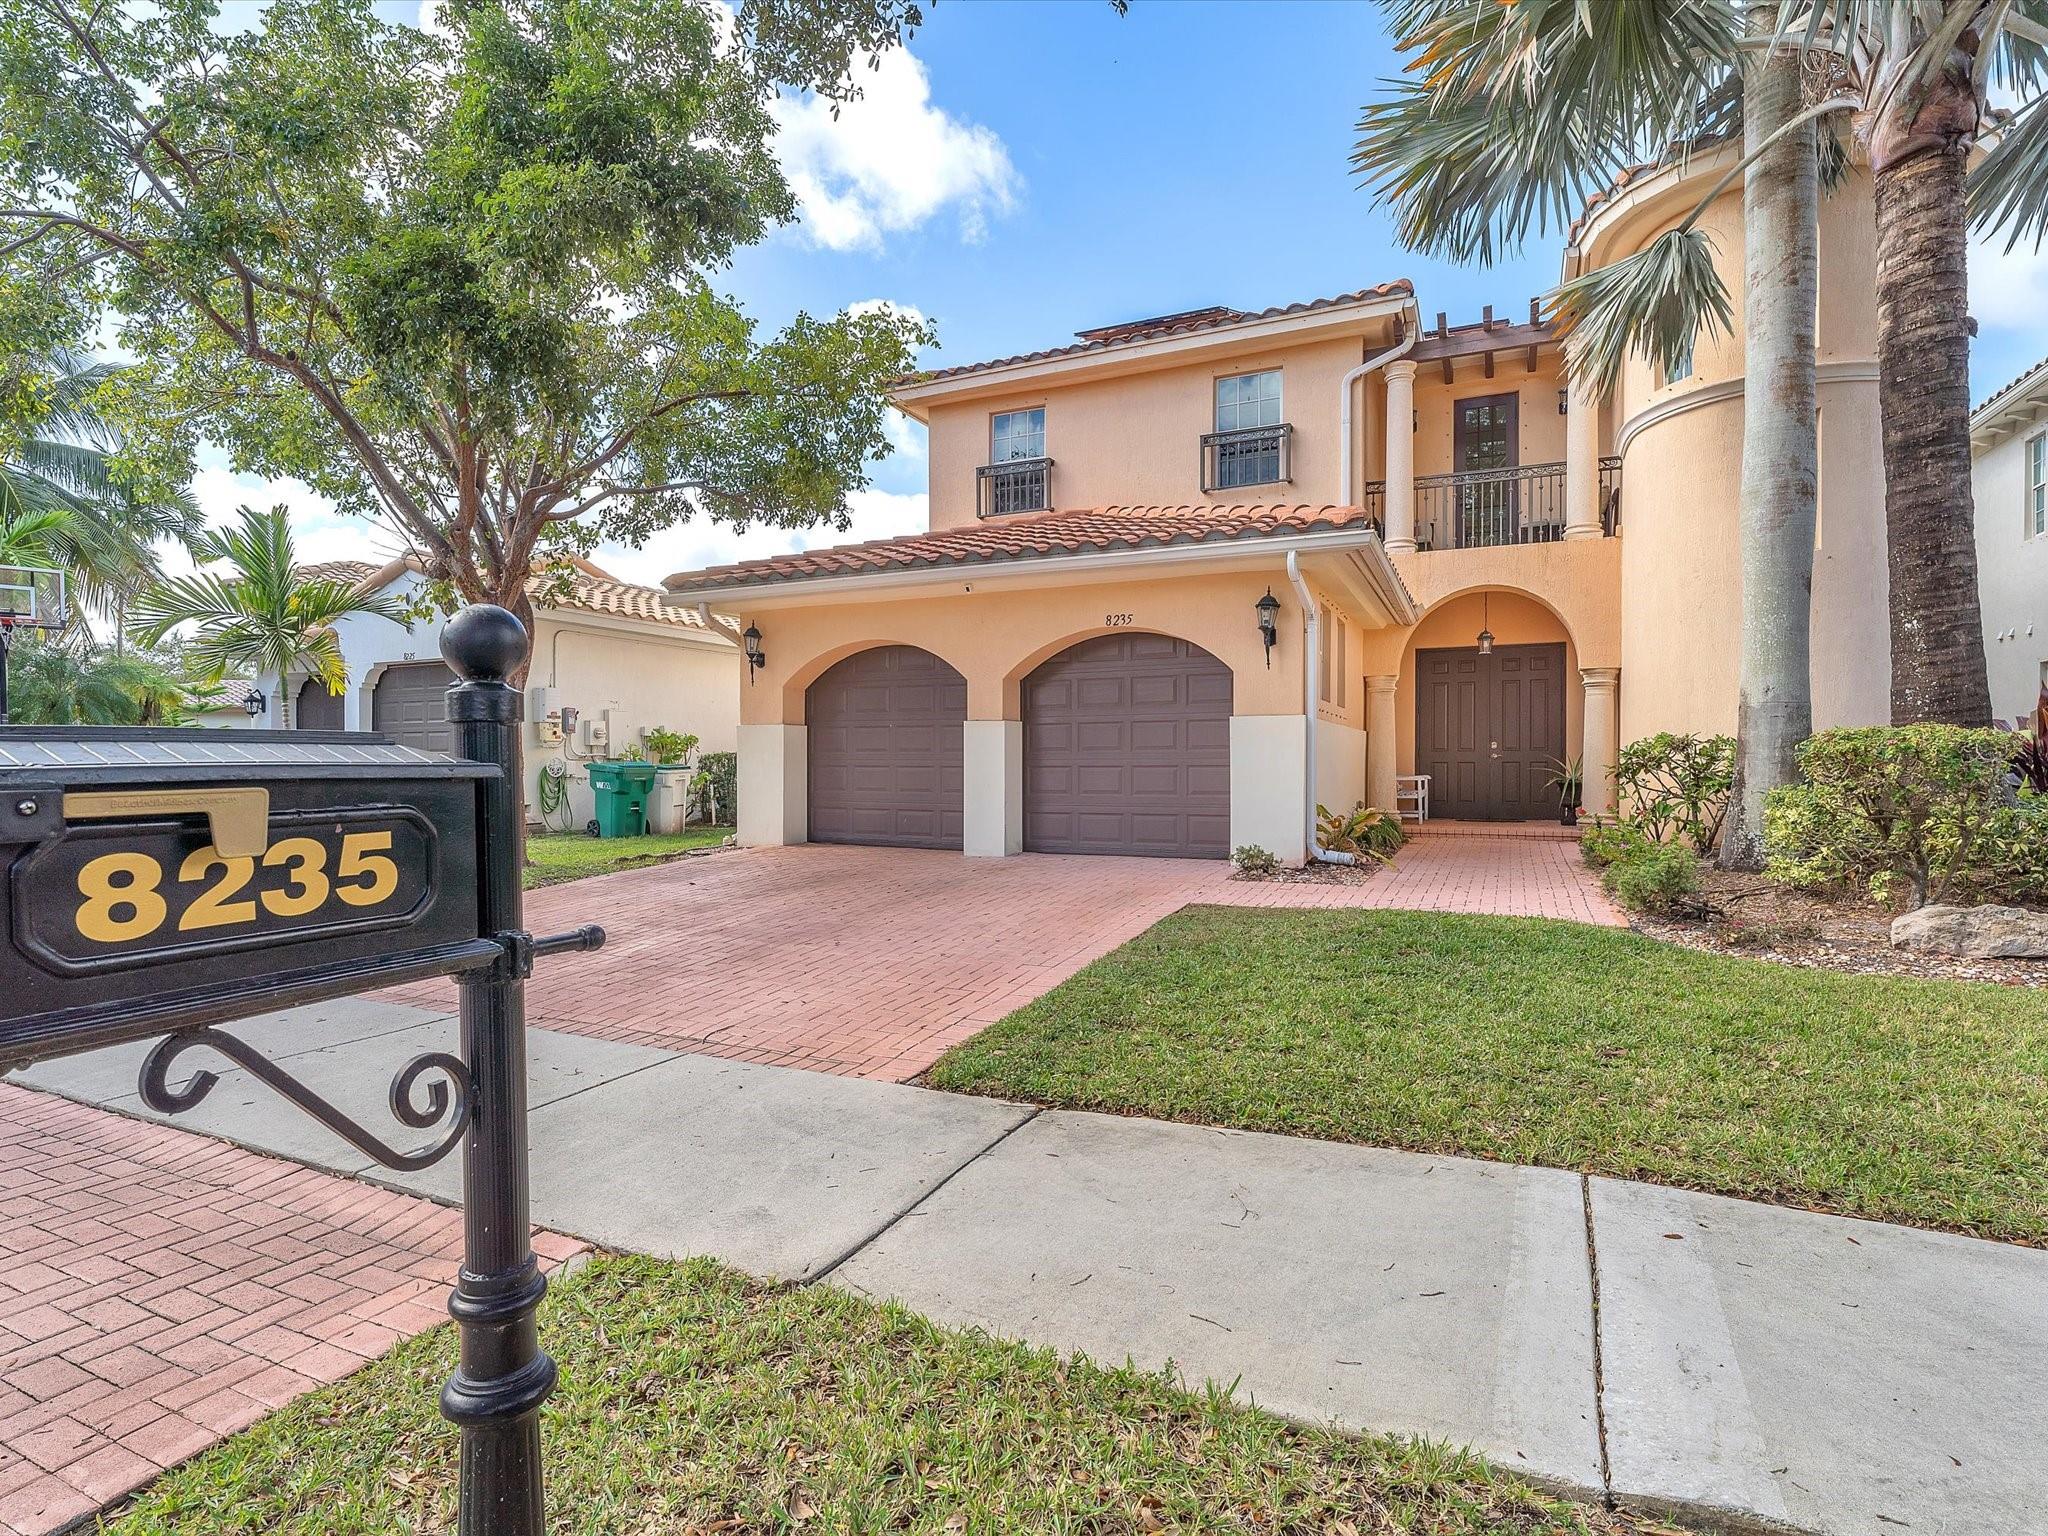
8235 NW 105th Ln, Parkland, FL 33076
$-3,294
Cash flow
-16.0%
Cash-on-Cash Return
2.6%
Cap rate
0.5%
Rent to Value Ratio
Active
$2,750,000
5
bds
|
5
ba
|
4,870
sqft
|
built
2008
10292 Emerson St, Parkland, FL 33076
$-9,473
Cash flow
-18.0%
Cash-on-Cash Return
2.2%
Cap rate
0.4%
Rent to Value Ratio
Active under contract
$1,175,000
4
bds
|
3
ba
|
2,327
sqft
|
built
1988
7820 S Woodridge Dr, Parkland, FL 33067
$-3,766
Cash flow
-16.7%
Cash-on-Cash Return
2.4%
Cap rate
0.4%
Rent to Value Ratio
Active
$1,300,000
5
bds
|
4
ba
|
3,281
sqft
|
built
2015
8600 Lakeside Bnd, Parkland, FL 33076
$-3,981
Cash flow
-16.0%
Cash-on-Cash Return
2.6%
Cap rate
0.6%
Rent to Value Ratio
Active
$1,400,000
5
bds
|
4
ba
|
3,613
sqft
|
built
2003
7663 NW 122nd Dr, Parkland, FL 33076
$-3,773
Cash flow
-14.1%
Cash-on-Cash Return
3.0%
Cap rate
0.5%
Rent to Value Ratio
Active
$1,537,900
4
bds
|
5
ba
|
3,690
sqft
|
built
2019
8725 Parkland Bay Dr, Parkland, FL 33076
$-6,107
Cash flow
-20.7%
Cash-on-Cash Return
1.5%
Cap rate
0.5%
Rent to Value Ratio
Active
$2,800,000
5
bds
|
6
ba
|
5,287
sqft
|
built
2016
10230 Sweet Bay Ct, Parkland, FL 33076
$-11,881
Cash flow
-22.1%
Cash-on-Cash Return
1.2%
Cap rate
0.4%
Rent to Value Ratio
Active
$1,799,888
7
bds
|
6
ba
|
5,585
sqft
|
built
2006
7944 NW 111th Way, Parkland, FL 33076
$-5,631
Cash flow
-16.3%
Cash-on-Cash Return
2.5%
Cap rate
0.5%
Rent to Value Ratio
Active
$1,999,800
5
bds
|
6
ba
|
5,996
sqft
|
built
2022
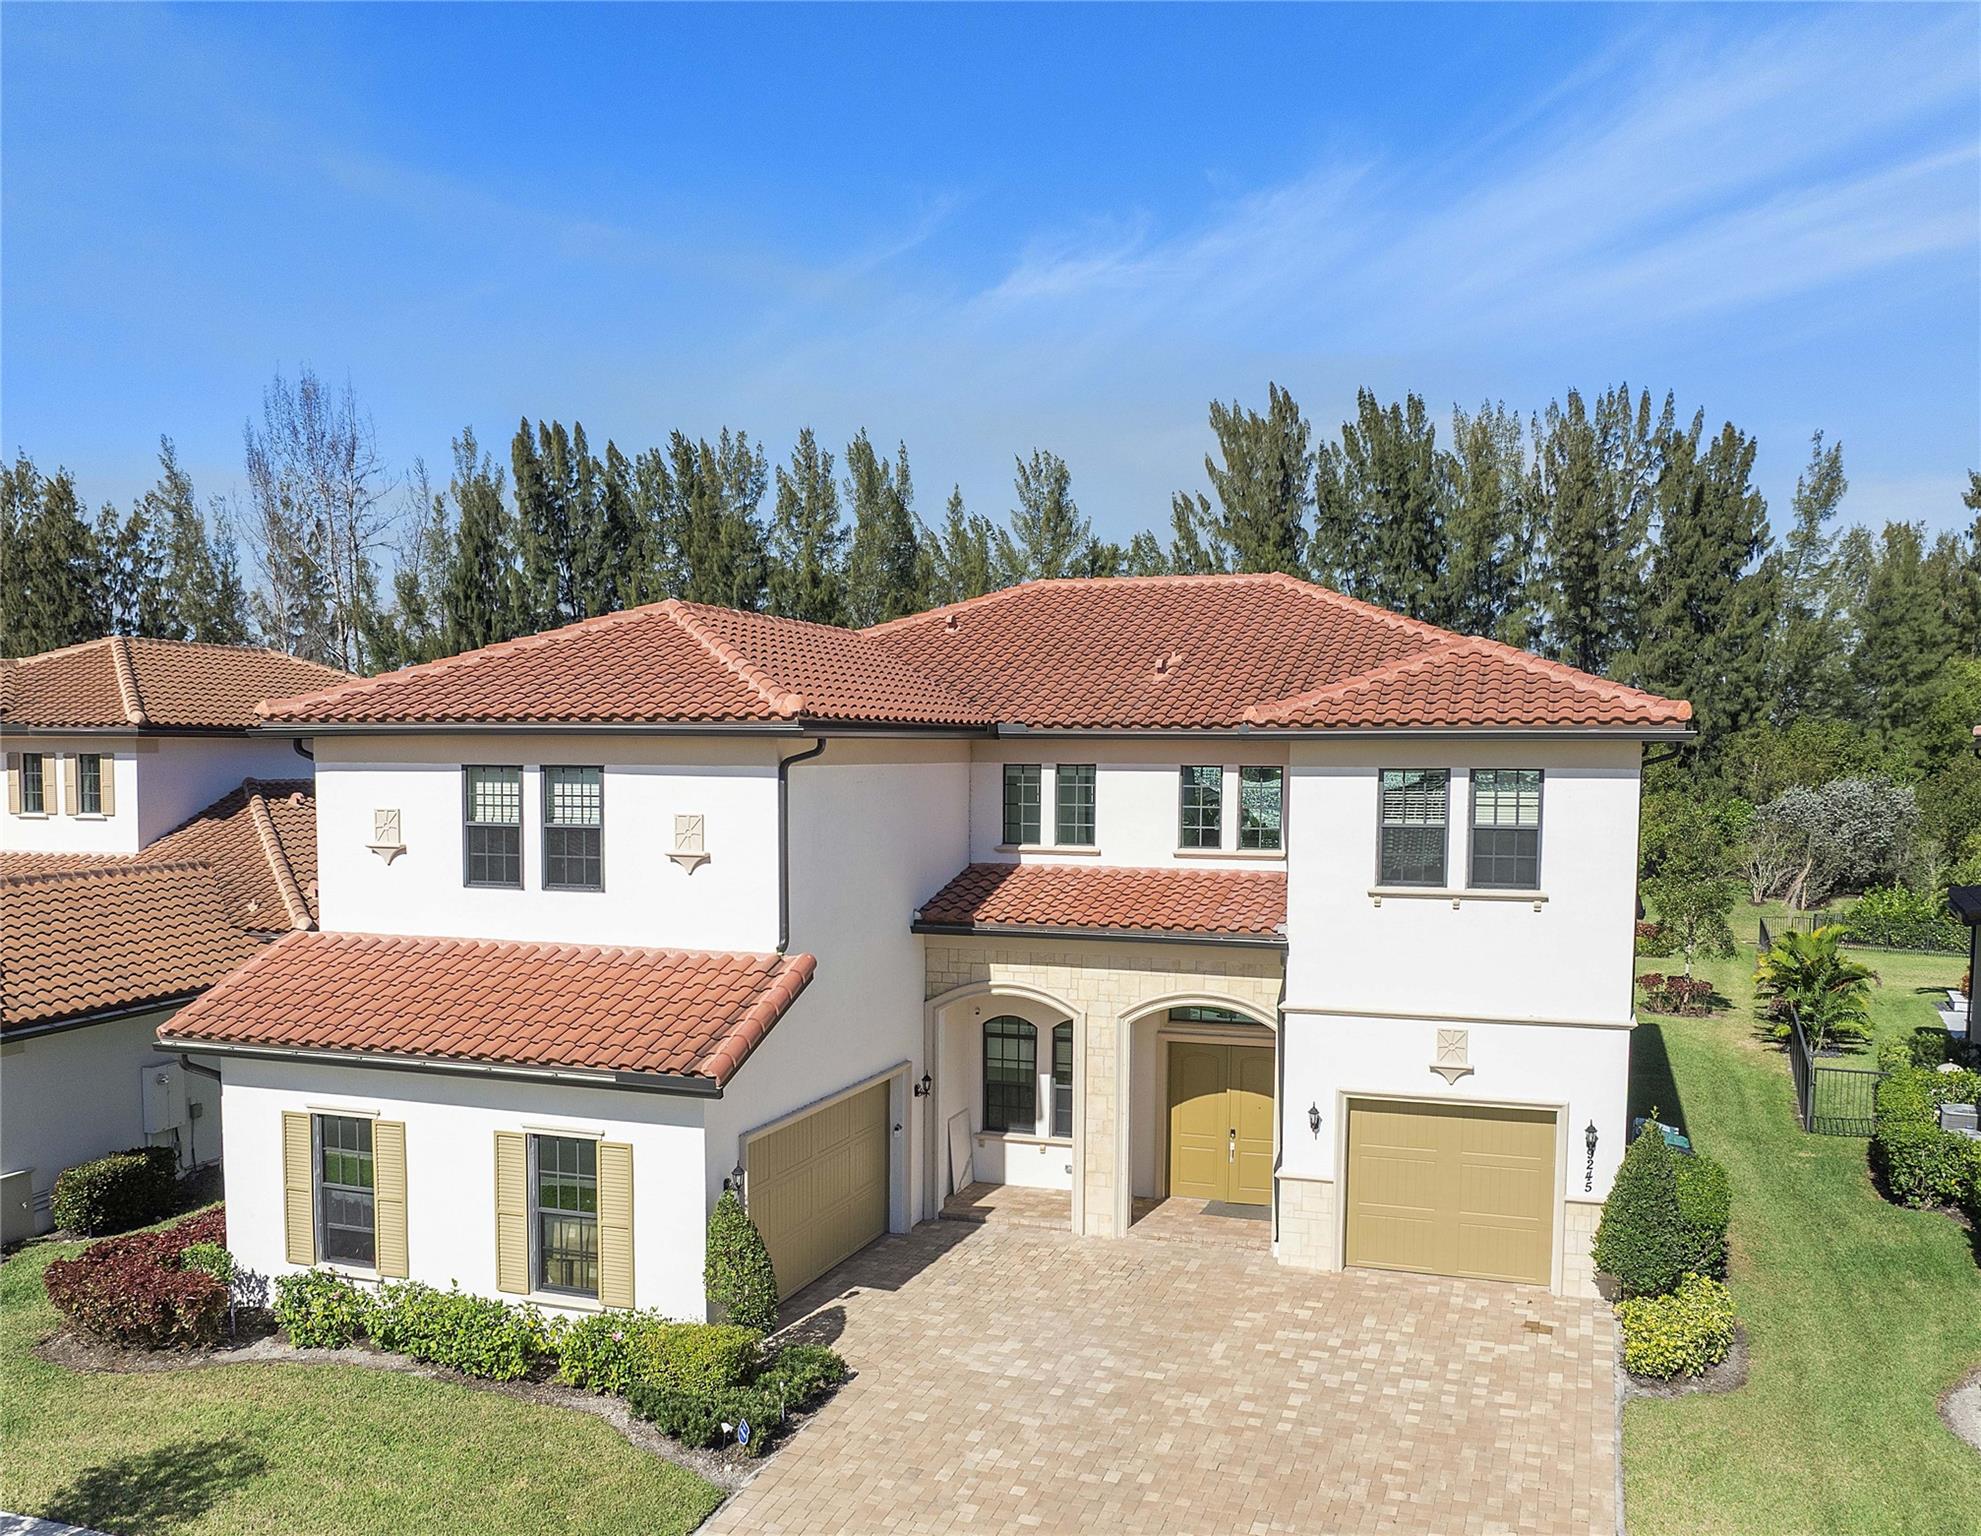
9245 W Parkland Bay Trl, Parkland, FL 33076
$-9,699
Cash flow
-25.3%
Cash-on-Cash Return
0.5%
Cap rate
0.2%
Rent to Value Ratio
Active
$760,000
3
bds
|
3
ba
|
2,378
sqft
|
built
1992
5900 NW 58th Ter, Parkland, FL 33067
$-1,532
Cash flow
-10.5%
Cash-on-Cash Return
3.9%
Cap rate
0.6%
Rent to Value Ratio
Closed
$795,000
4
bds
|
3
ba
|
2,593
sqft
|
built
1997
7883 NW 60th Ln, Parkland, FL 33067
$-1,752
Cash flow
-11.5%
Cash-on-Cash Return
3.6%
Cap rate
0.6%
Rent to Value Ratio
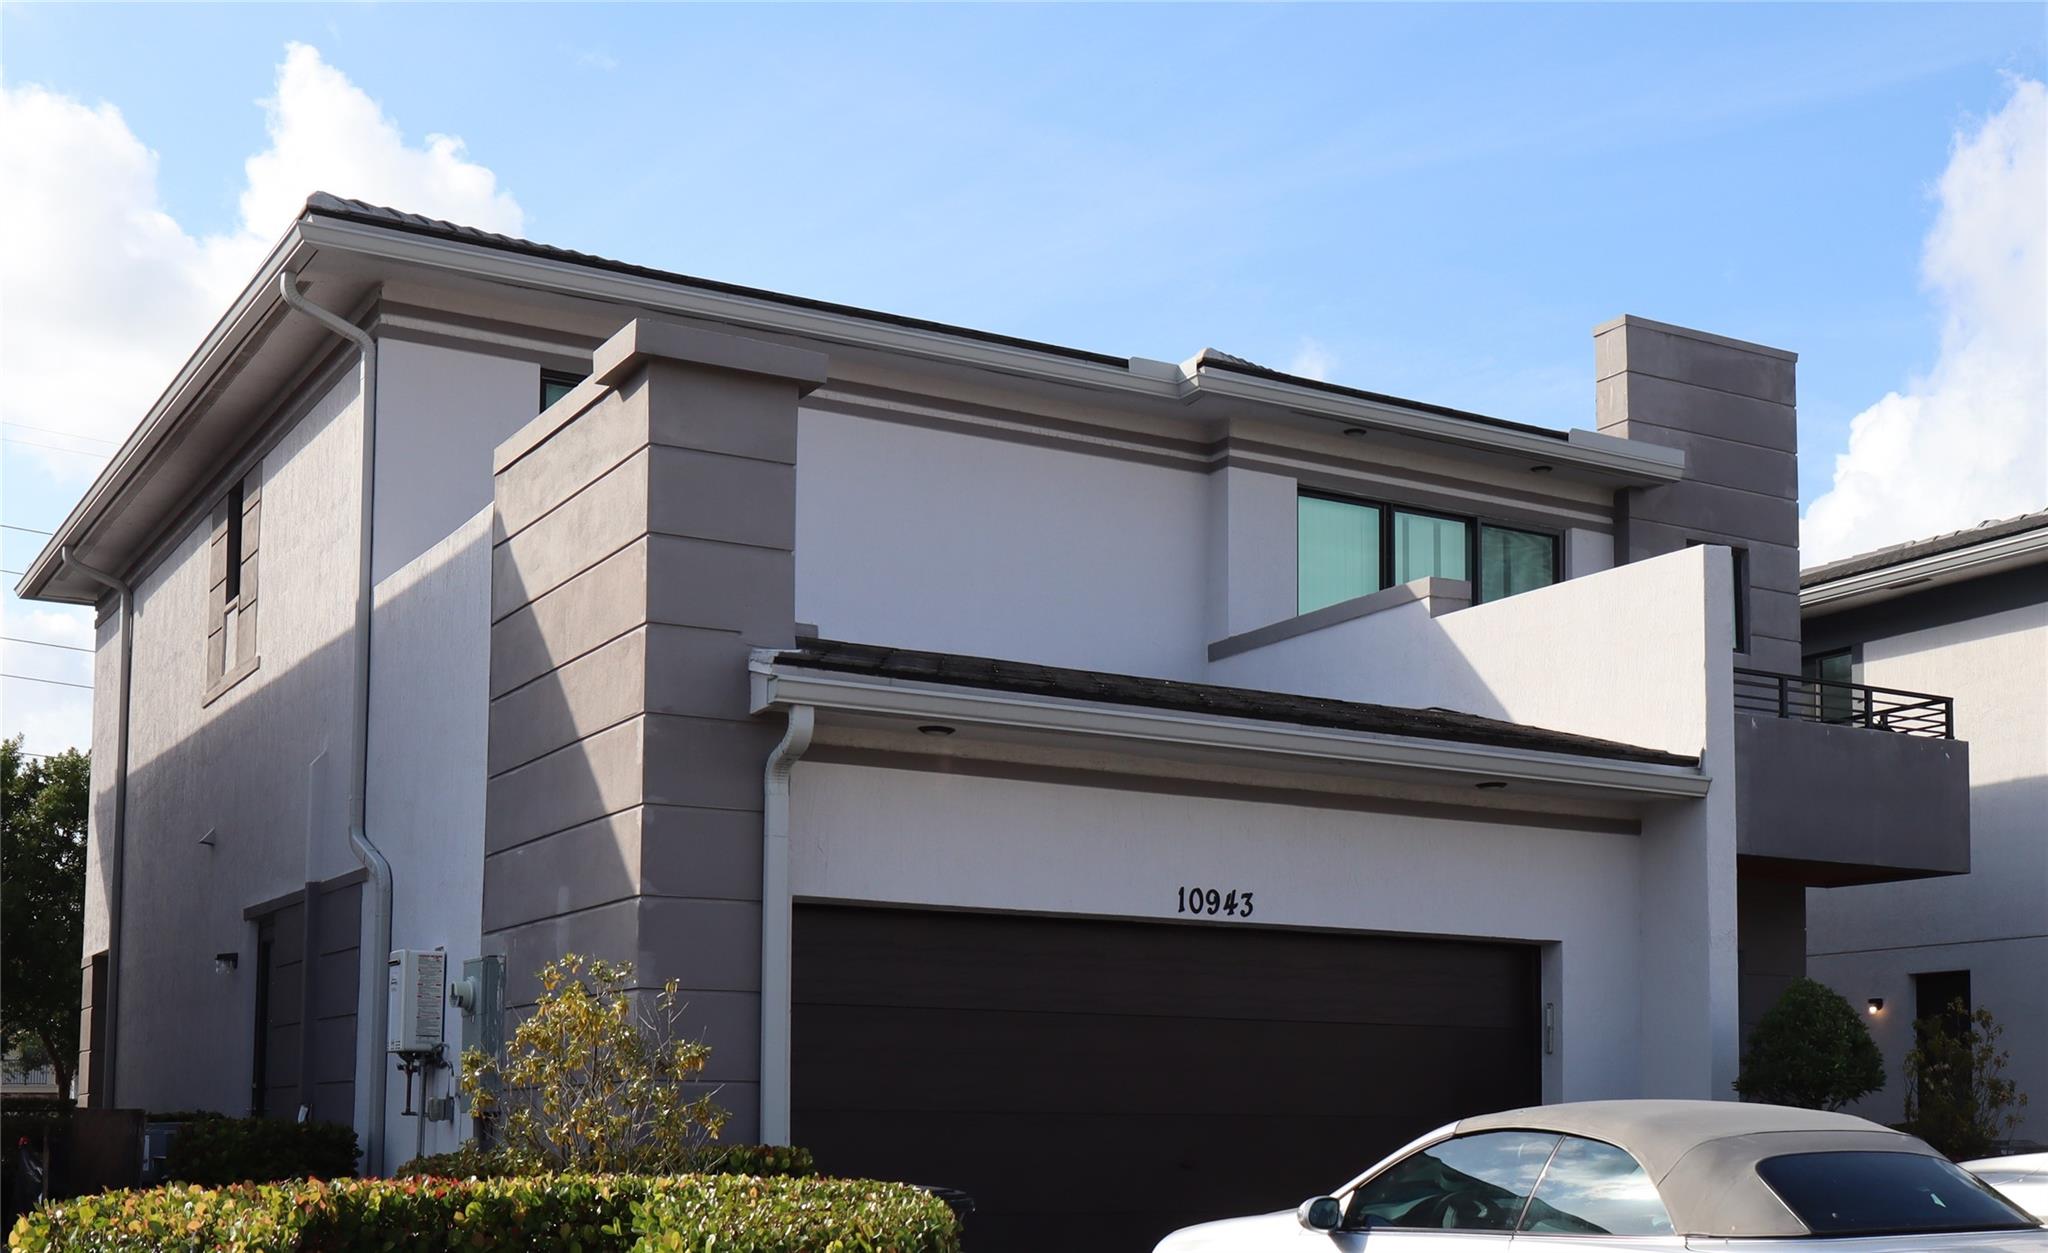
Active
$1,239,000
4
bds
|
4
ba
|
3,056
sqft
|
built
2021
10943 Passage Way, Parkland, FL 33076
$-4,791
Cash flow
-20.2%
Cash-on-Cash Return
1.6%
Cap rate
0.5%
Rent to Value Ratio
Active
$1,250,000
6
bds
|
5
ba
|
3,600
sqft
|
built
1999
10667 NW 69th St, Parkland, FL 33076
$-3,820
Cash flow
-15.9%
Cash-on-Cash Return
2.6%
Cap rate
0.4%
Rent to Value Ratio

Active
$975,000
4
bds
|
3
ba
|
2,378
sqft
|
built
2019
10705 Pacifica Way, Parkland, FL 33076
$-2,886
Cash flow
-15.4%
Cash-on-Cash Return
2.7%
Cap rate
0.7%
Rent to Value Ratio
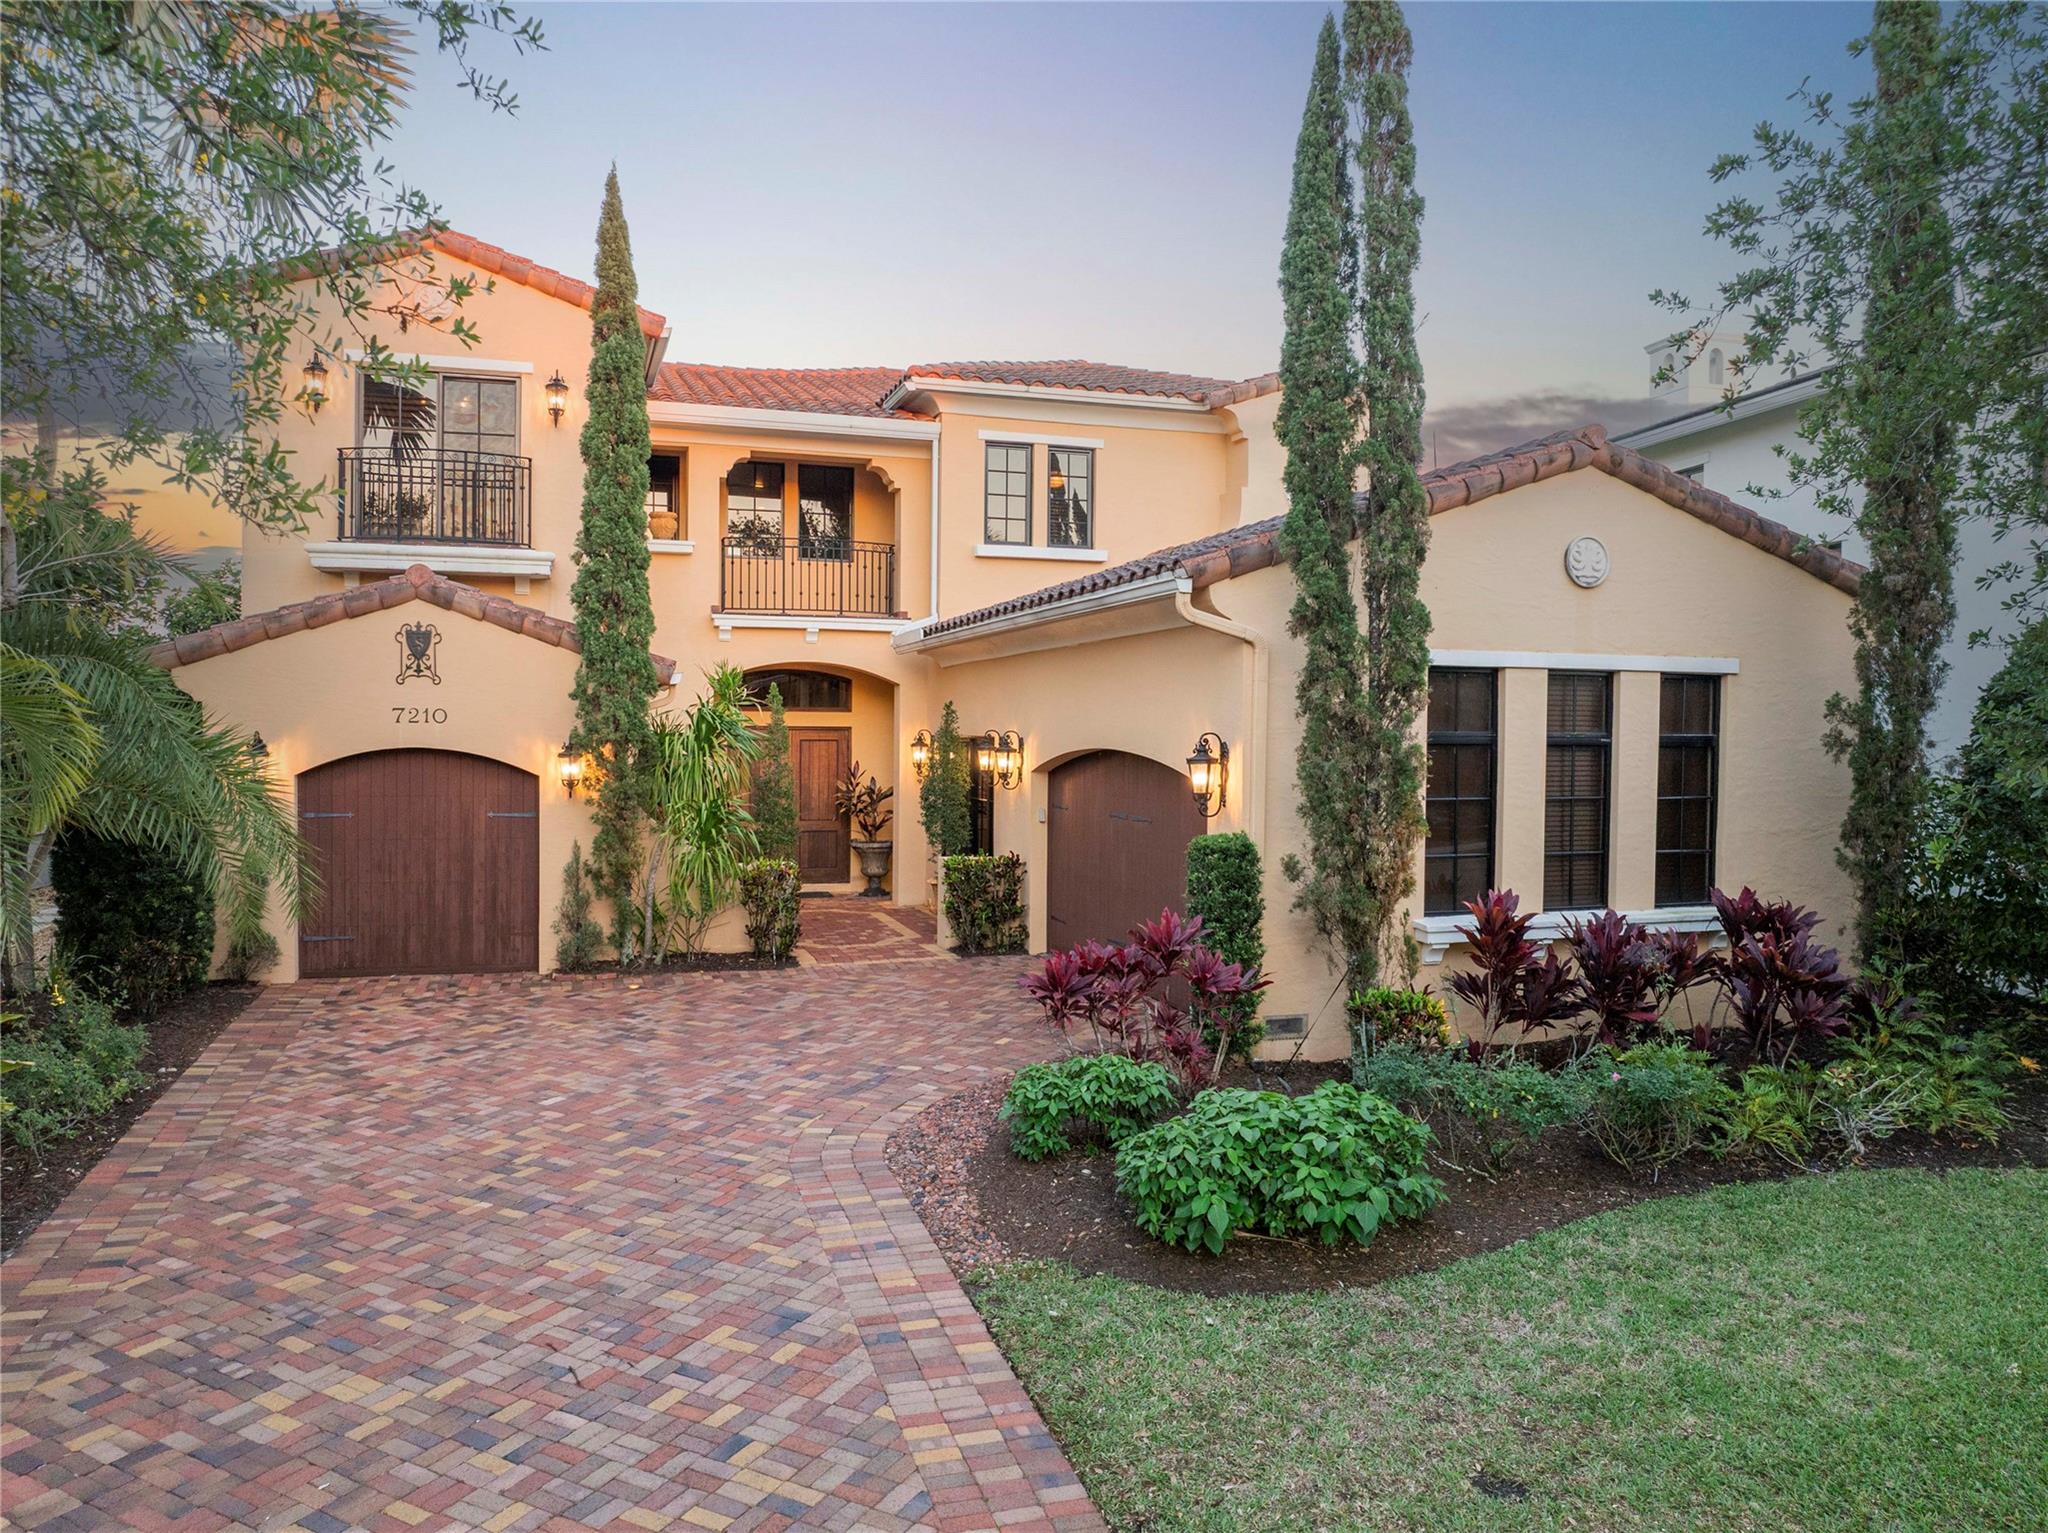
Active
$1,899,900
4
bds
|
5
ba
|
4,098
sqft
|
built
2005
7210 Wisteria Ave, Parkland, FL 33076
$-8,392
Cash flow
-23.0%
Cash-on-Cash Return
1.0%
Cap rate
0.3%
Rent to Value Ratio
Active
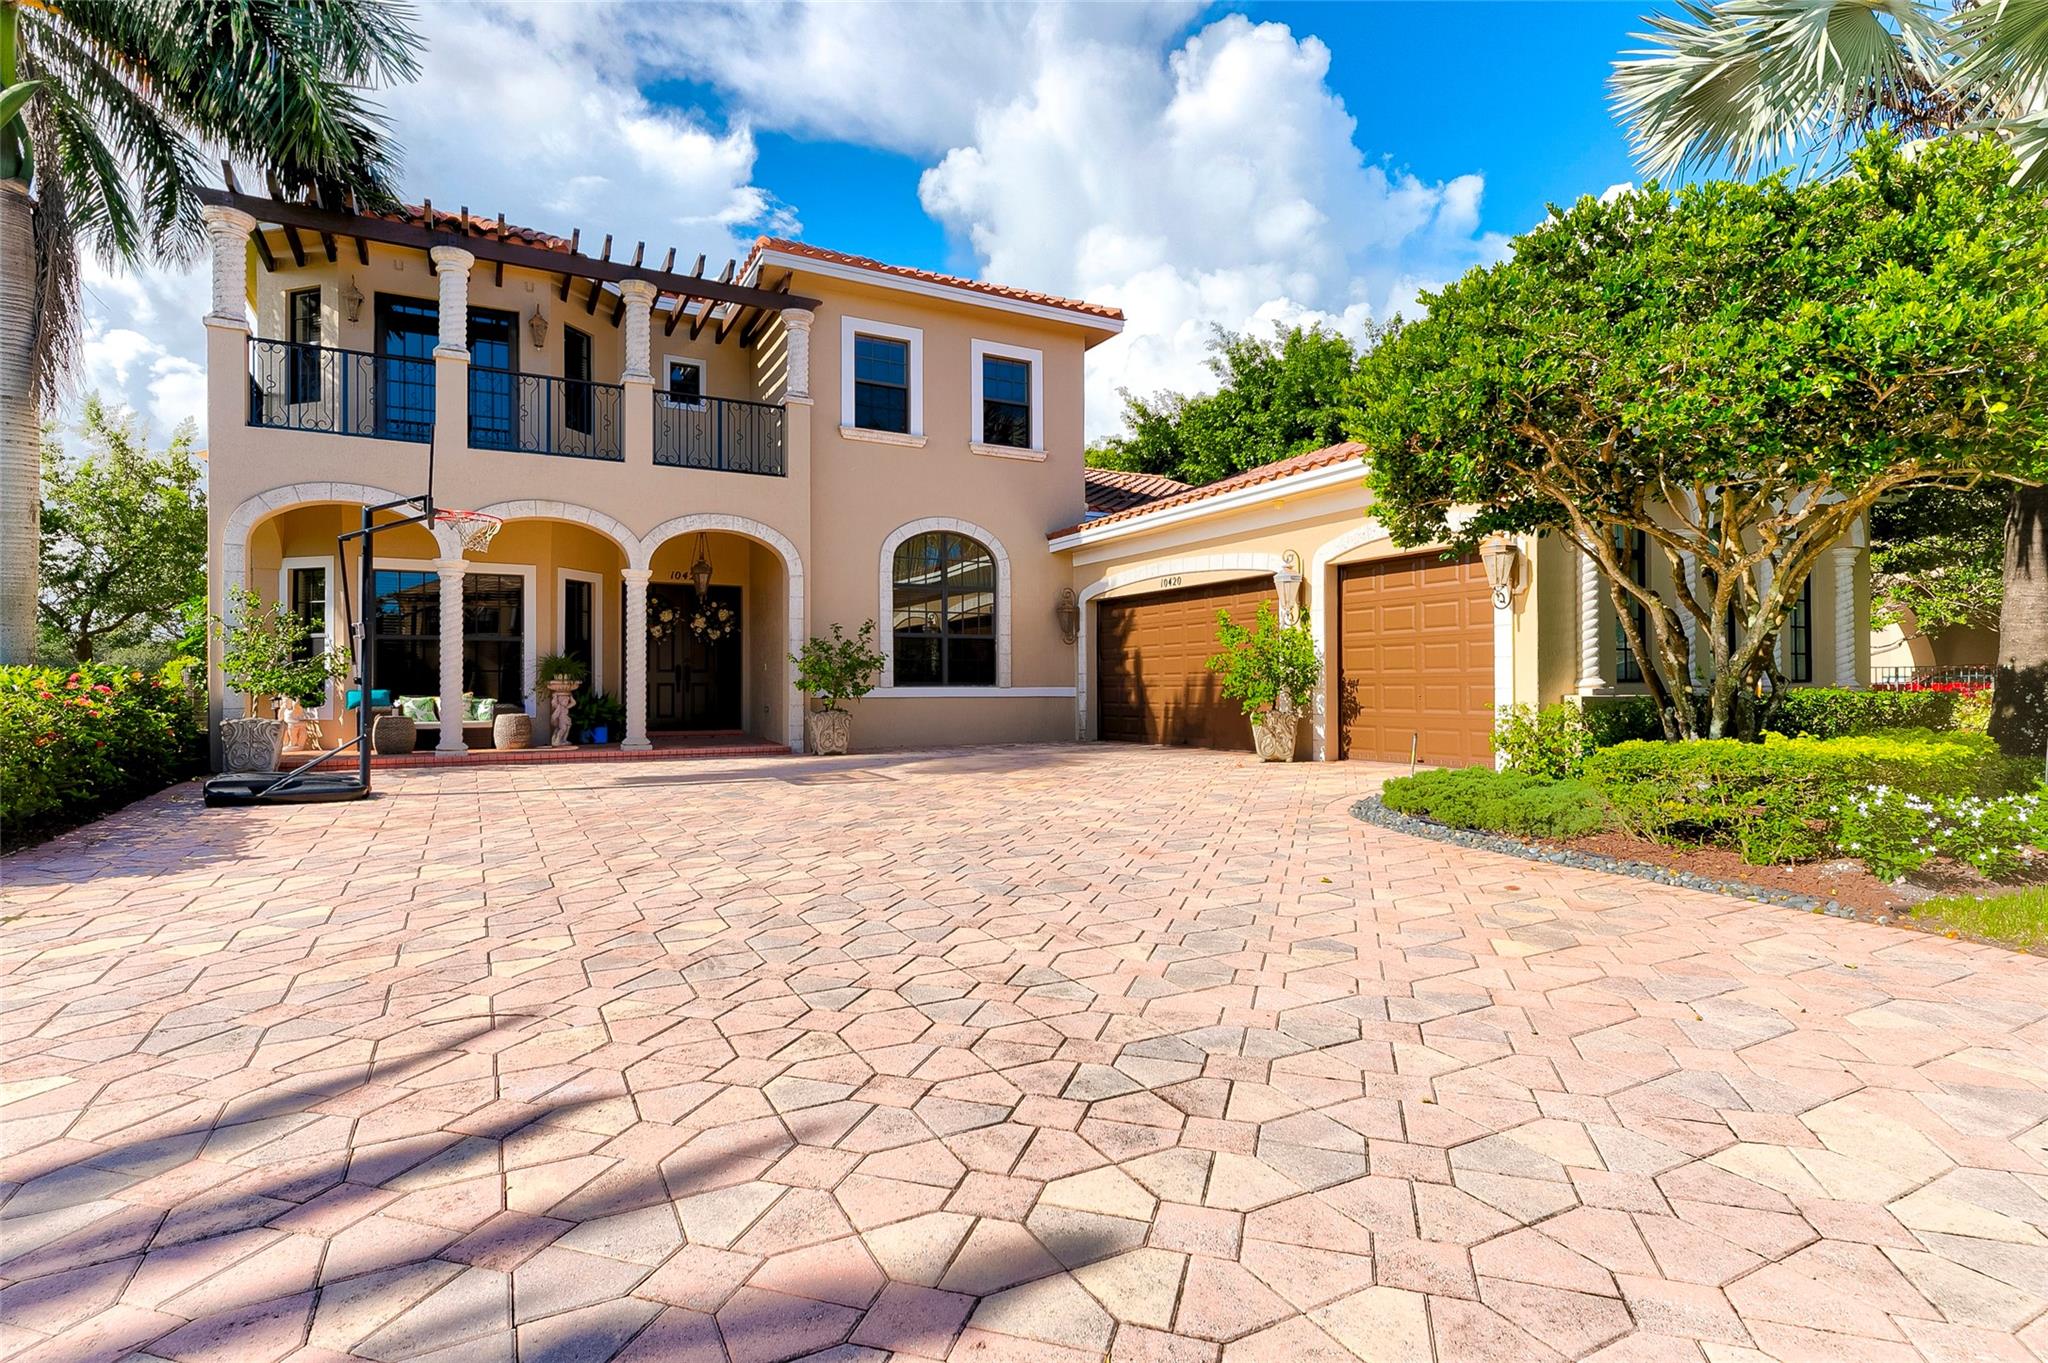
$1,475,000
5
bds
|
4
ba
|
4,723
sqft
|
built
2006
10420 Majestic Ct, Parkland, FL 33076
$-3,043
Cash flow
-10.8%
Cash-on-Cash Return
3.8%
Cap rate
0.7%
Rent to Value Ratio
Active
$799,000
4
bds
|
3
ba
|
2,611
sqft
|
built
1996
6713 NW 80th Mnr, Parkland, FL 33067
$-1,360
Cash flow
-8.9%
Cash-on-Cash Return
4.2%
Cap rate
0.6%
Rent to Value Ratio

Active
$2,999,900
5
bds
|
8
ba
|
6,902
sqft
|
built
2009
6620 NW 122nd Ave, Parkland, FL 33076
$-13,437
Cash flow
-23.4%
Cash-on-Cash Return
0.9%
Cap rate
0.3%
Rent to Value Ratio
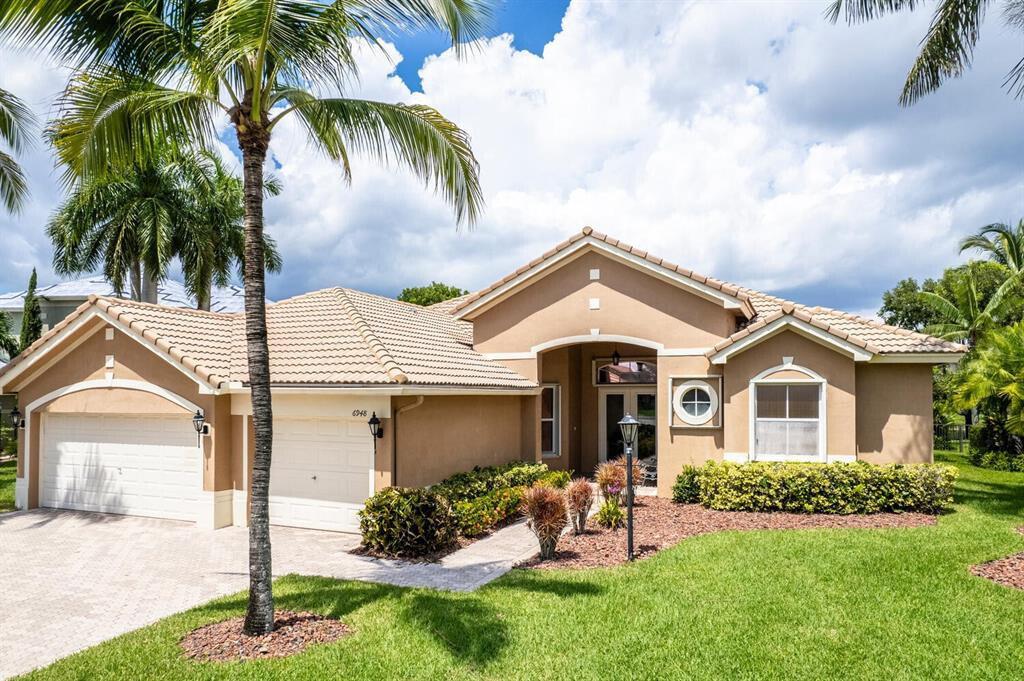
Active
$930,000
4
bds
|
4
ba
|
2,846
sqft
|
built
2001
6948 NW 110th Ln, Parkland, FL 33076
$-2,172
Cash flow
-12.2%
Cash-on-Cash Return
3.5%
Cap rate
0.7%
Rent to Value Ratio
Active
$824,900
4
bds
|
3
ba
|
2,394
sqft
|
built
1999
7009 NW 113th Ave, Parkland, FL 33076
$-2,157
Cash flow
-13.6%
Cash-on-Cash Return
3.1%
Cap rate
0.7%
Rent to Value Ratio
Active
$1,685,000
5
bds
|
6
ba
|
4,212
sqft
|
built
2016
11360 NW 83rd Way, Parkland, FL 33076
$-5,760
Cash flow
-17.8%
Cash-on-Cash Return
2.2%
Cap rate
0.4%
Rent to Value Ratio
Active
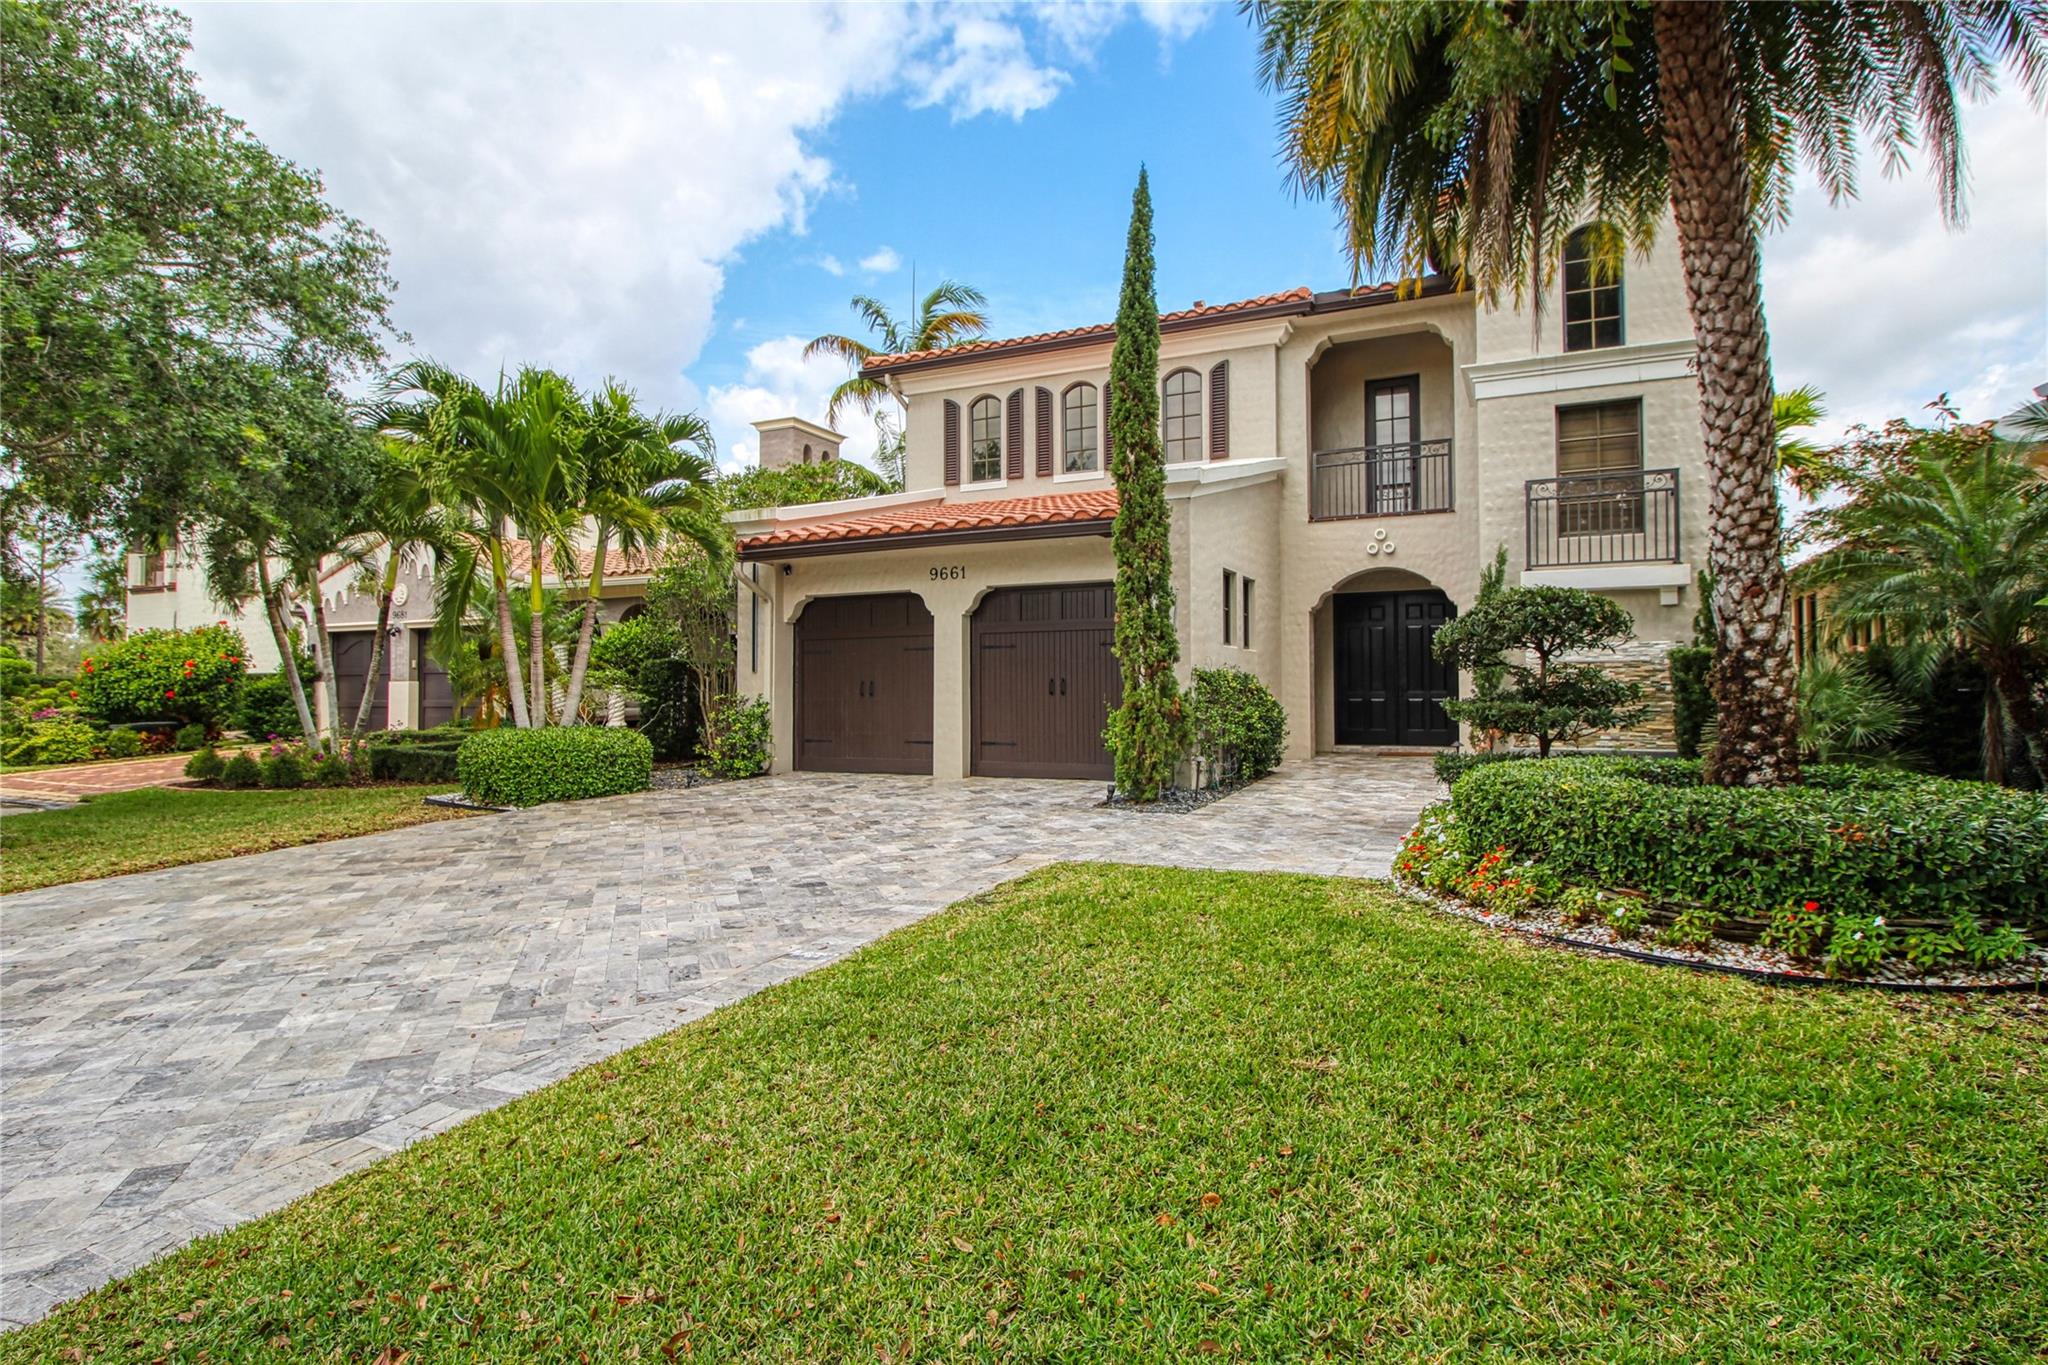
$1,599,000
4
bds
|
3
ba
|
3,508
sqft
|
built
2007
9661 Ginger Ct, Parkland, FL 33076
$-4,935
Cash flow
-16.1%
Cash-on-Cash Return
2.6%
Cap rate
0.5%
Rent to Value Ratio