Pascagoula, MS Investment Properties for Sale
Browse homes for sale and investment properties in Pascagoula, MS. Refine your search by price, property type, or more.
Best cash flowing properties in Pascagoula, MS
Active
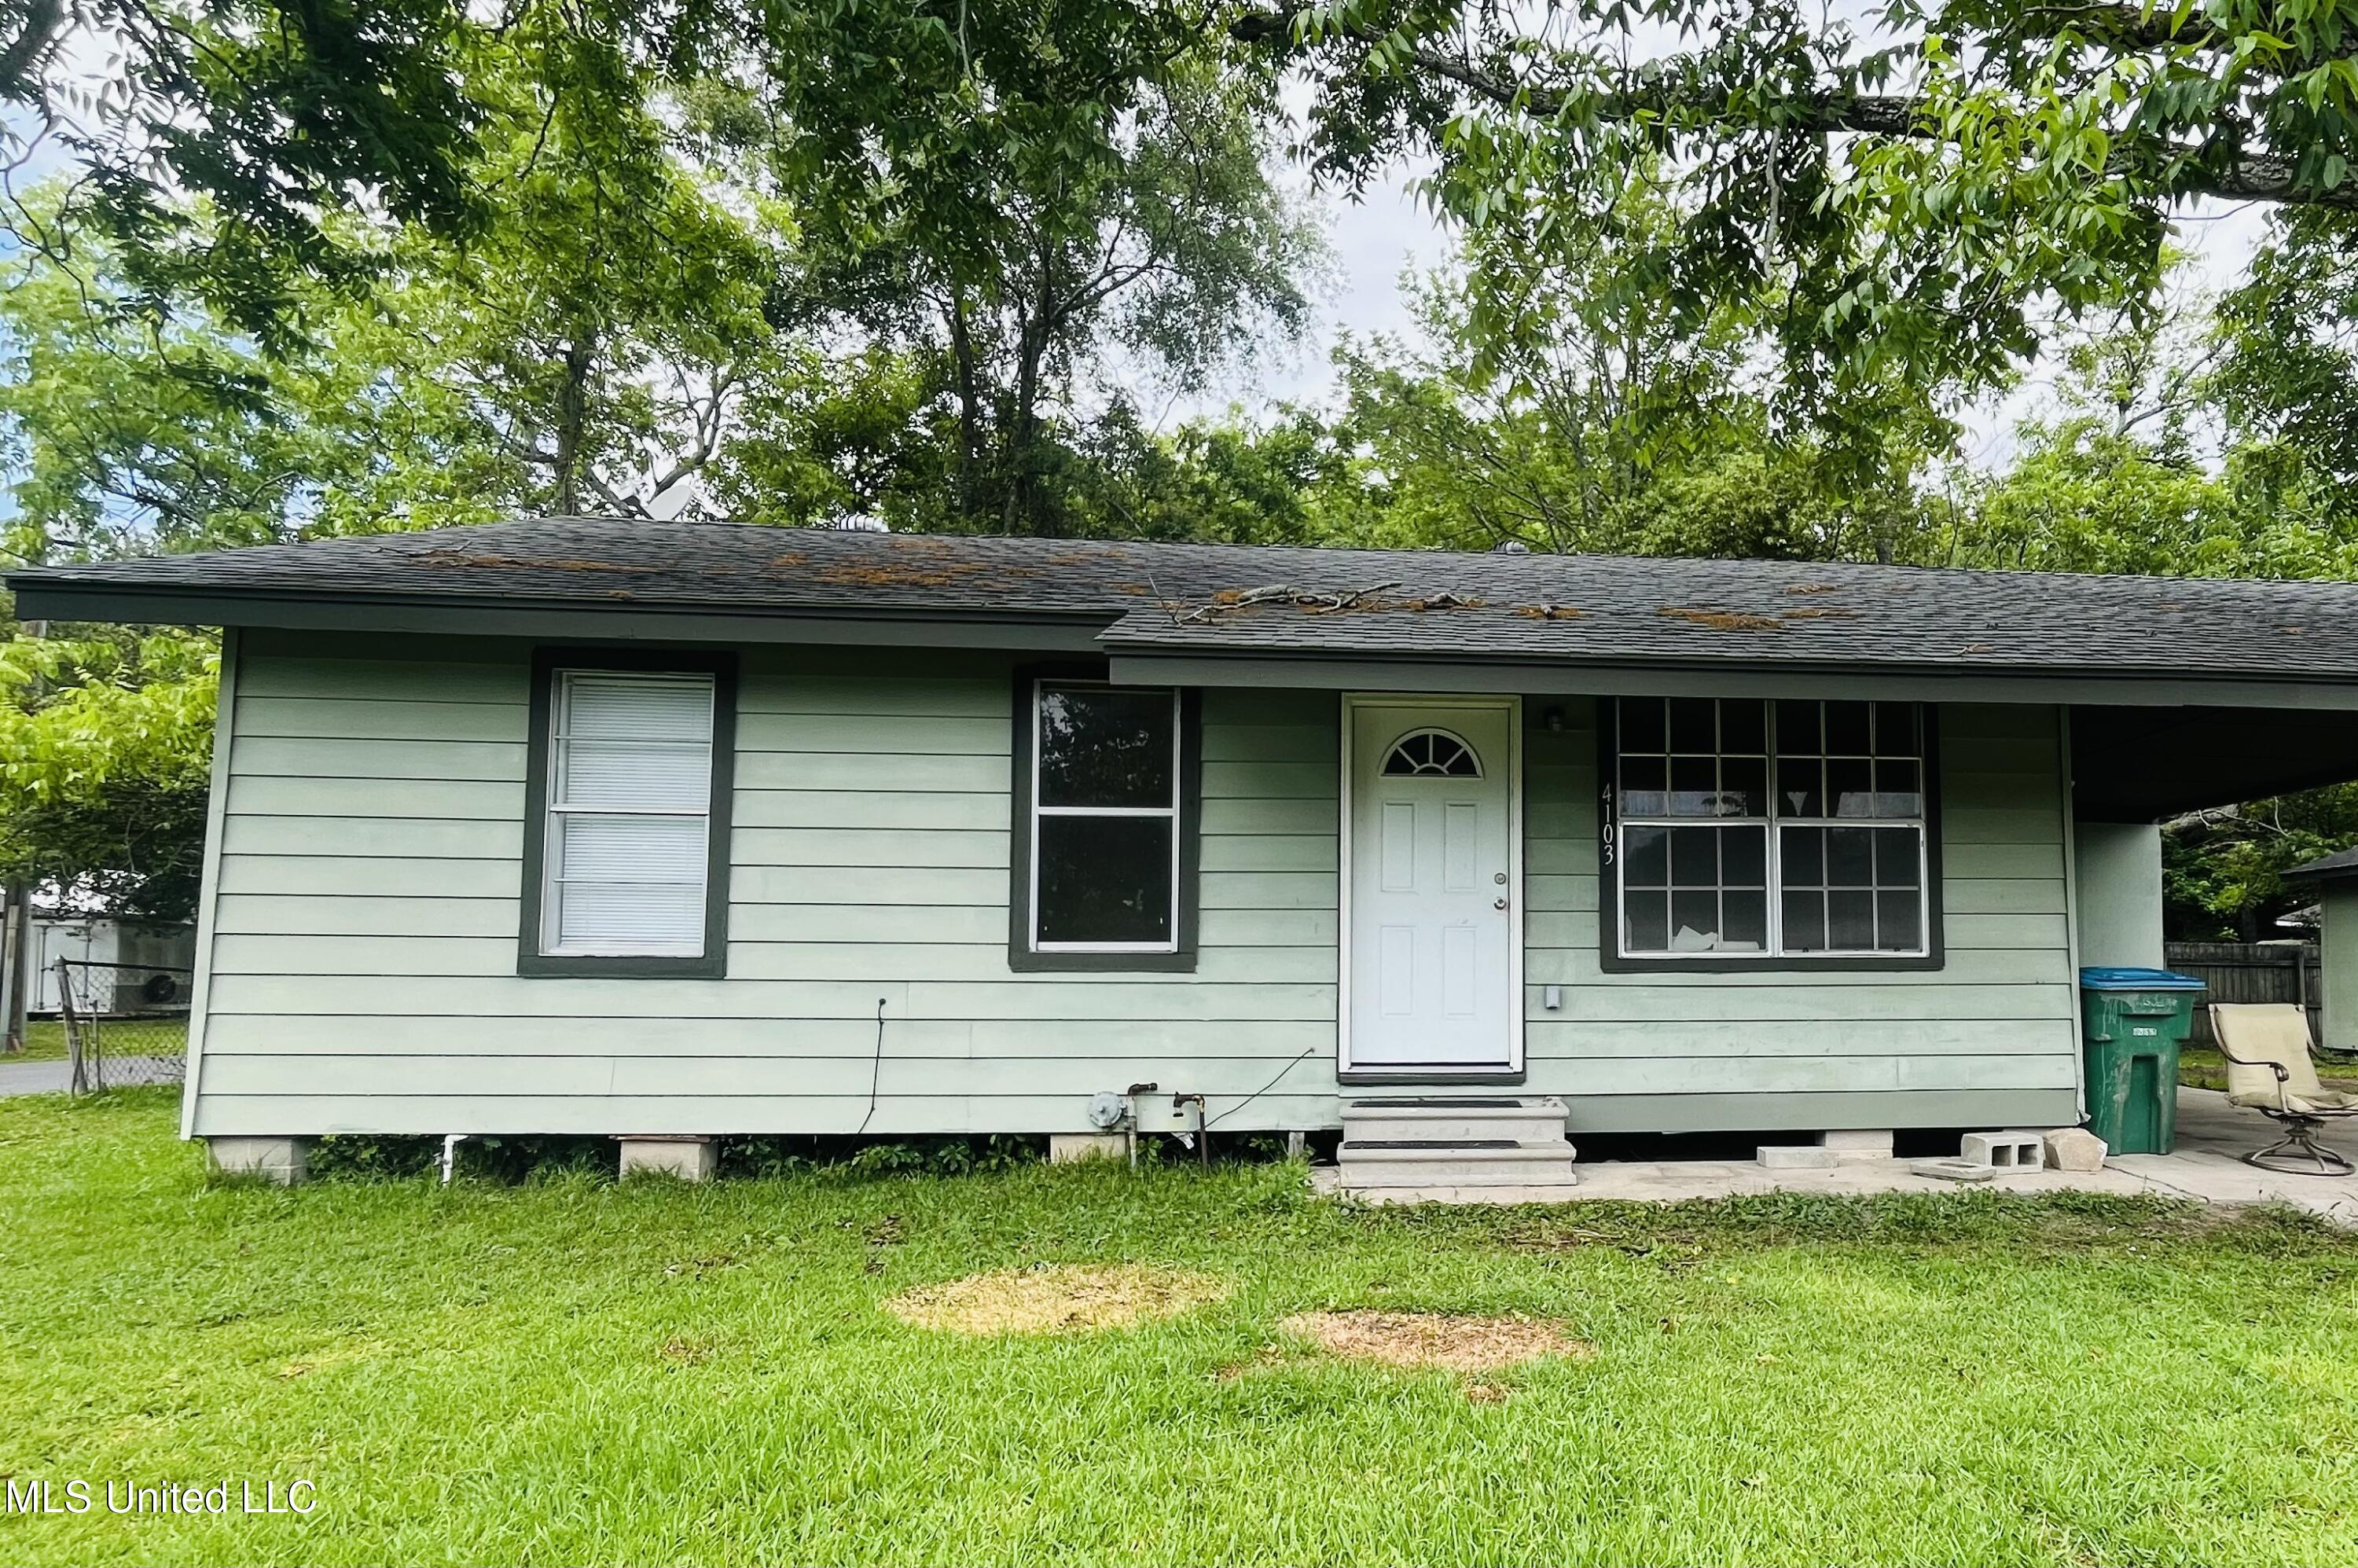
$76,500
3
bds
|
1
ba
|
0
sqft
|
built
1948
4103 Ingalls Ave, Pascagoula, MS 39581
$540
Cash flow
36.8%
Cash-on-Cash Return
14.1%
Cap rate
1.8%
Rent to Value Ratio
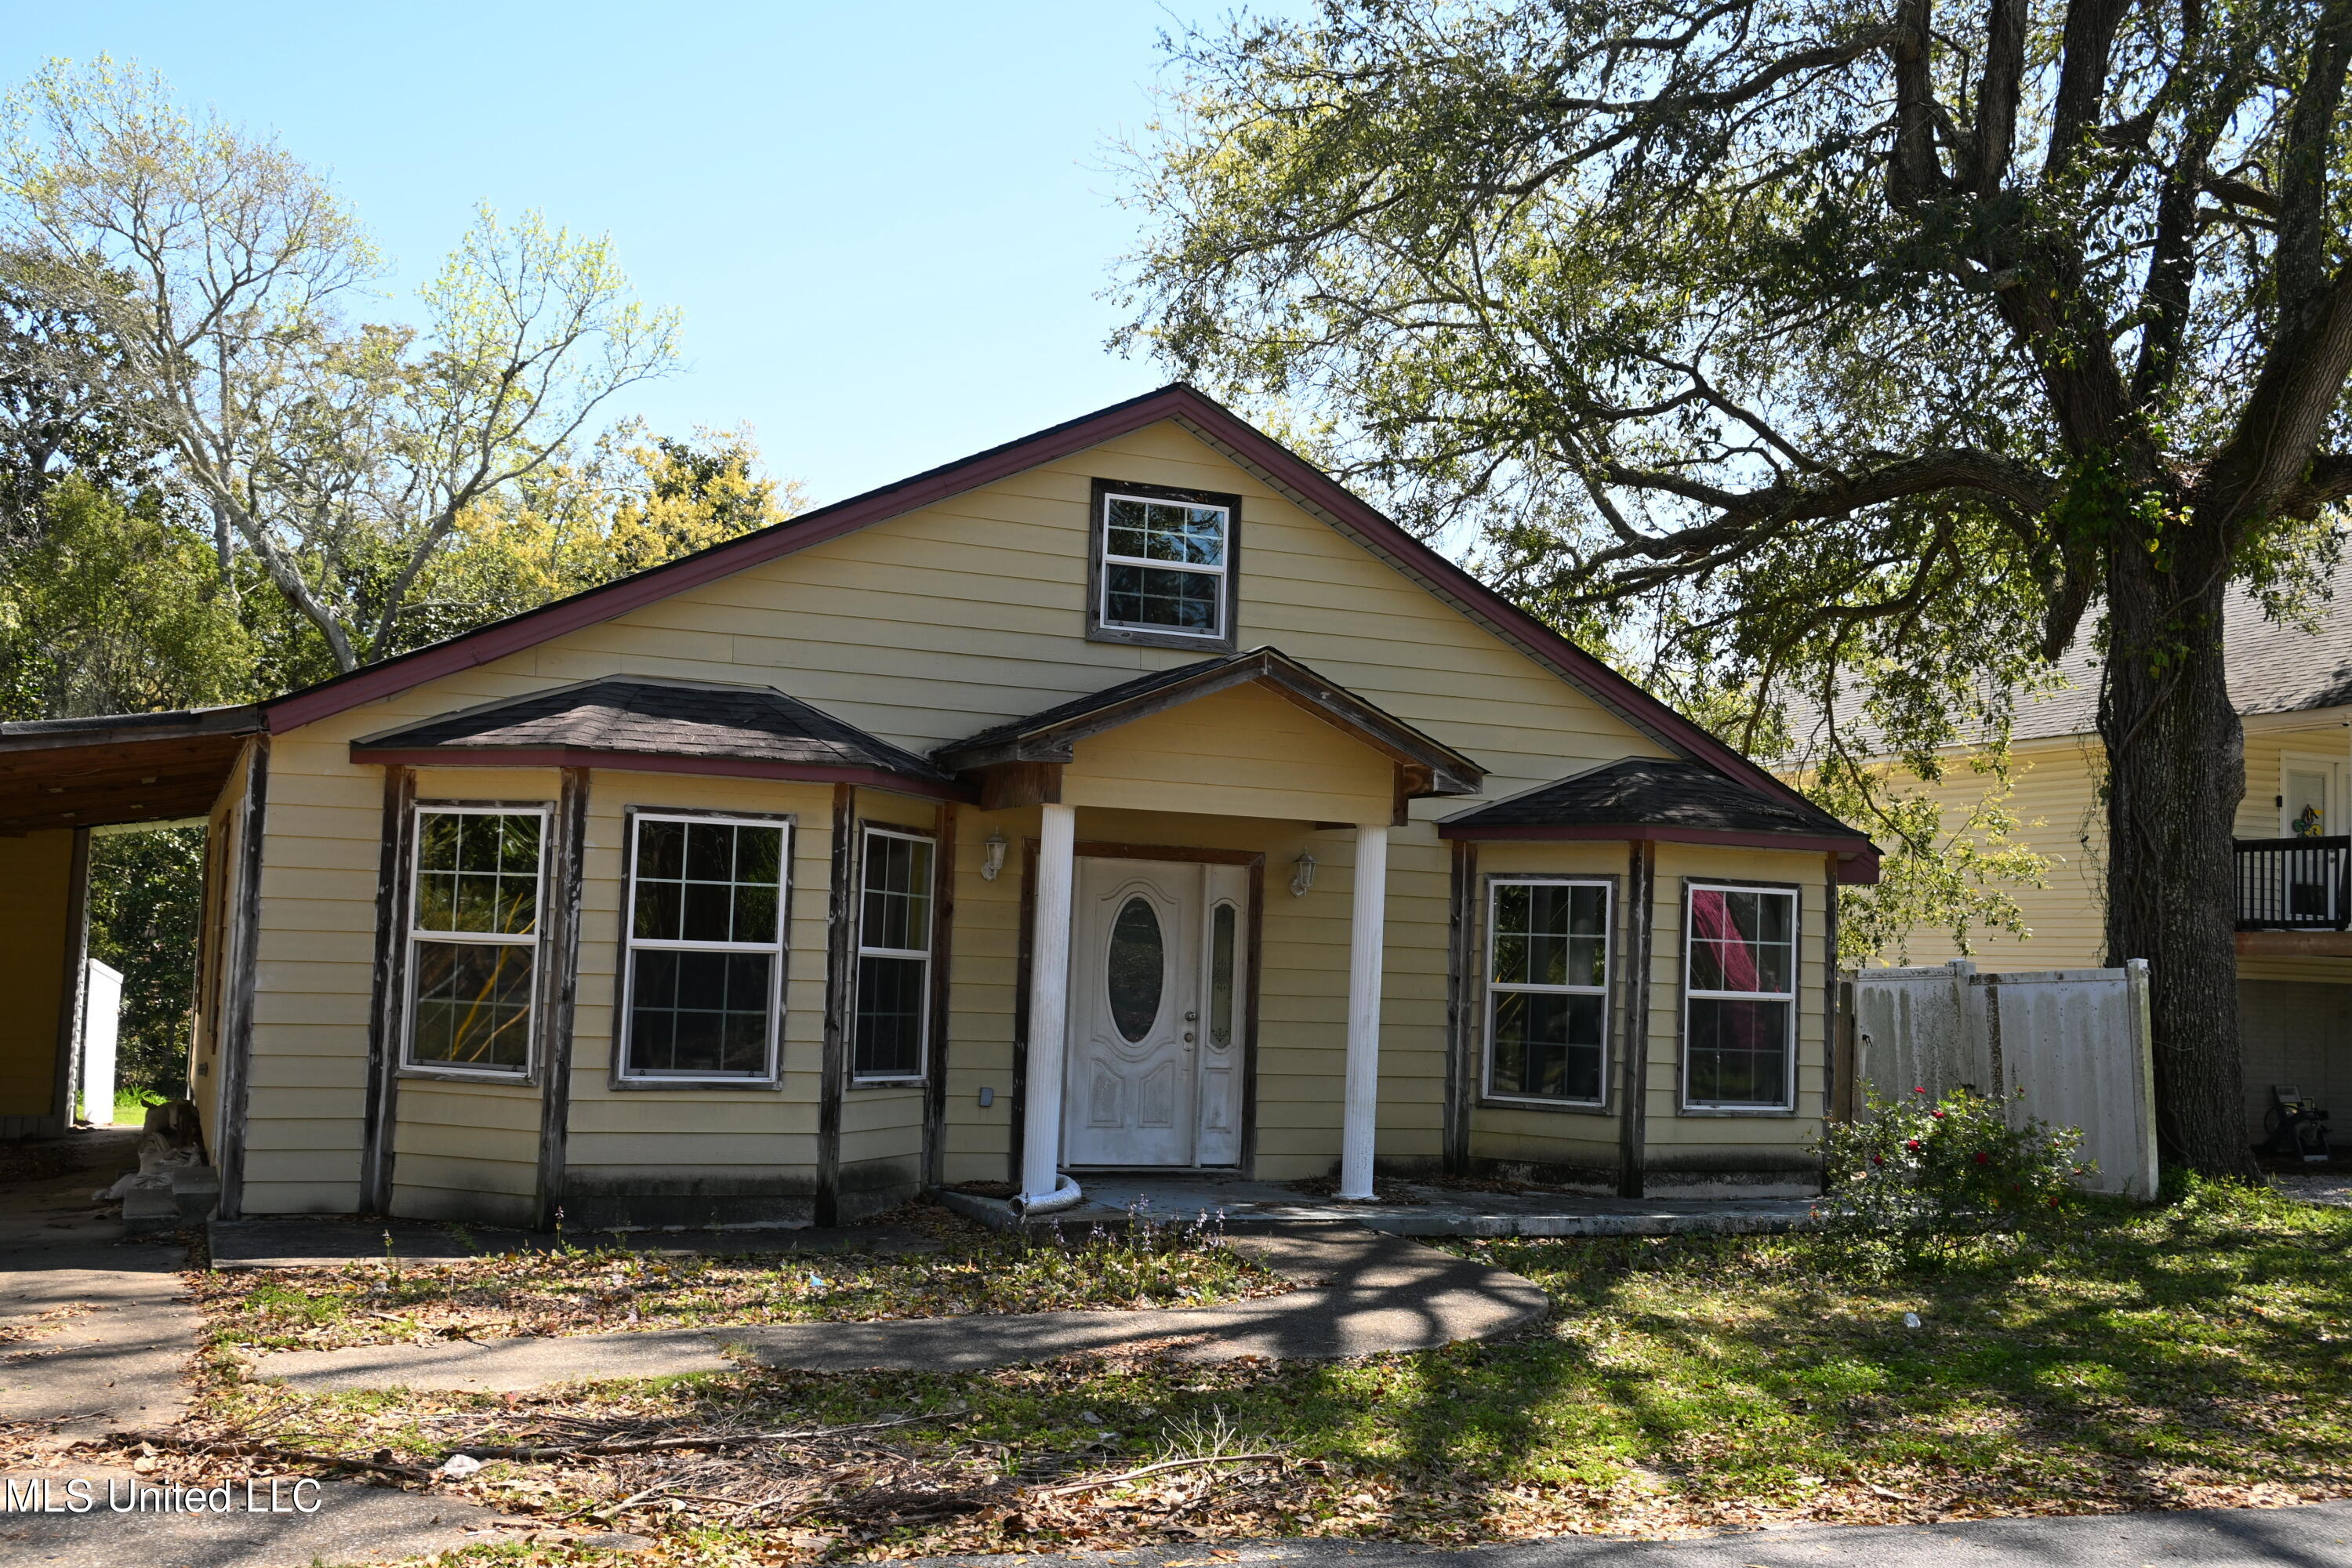
Active
$94,700
3
bds
|
2
ba
|
0
sqft
|
built
1940
1106 Resca De La Palma St, Pascagoula, MS 39567
$524
Cash flow
28.9%
Cash-on-Cash Return
12.3%
Cap rate
1.7%
Rent to Value Ratio
50 out of 52 properties for sale in Pascagoula, MS
Limited Results Shown
Create a free account, or log in to reveal all property listings and enjoy the complete experience.
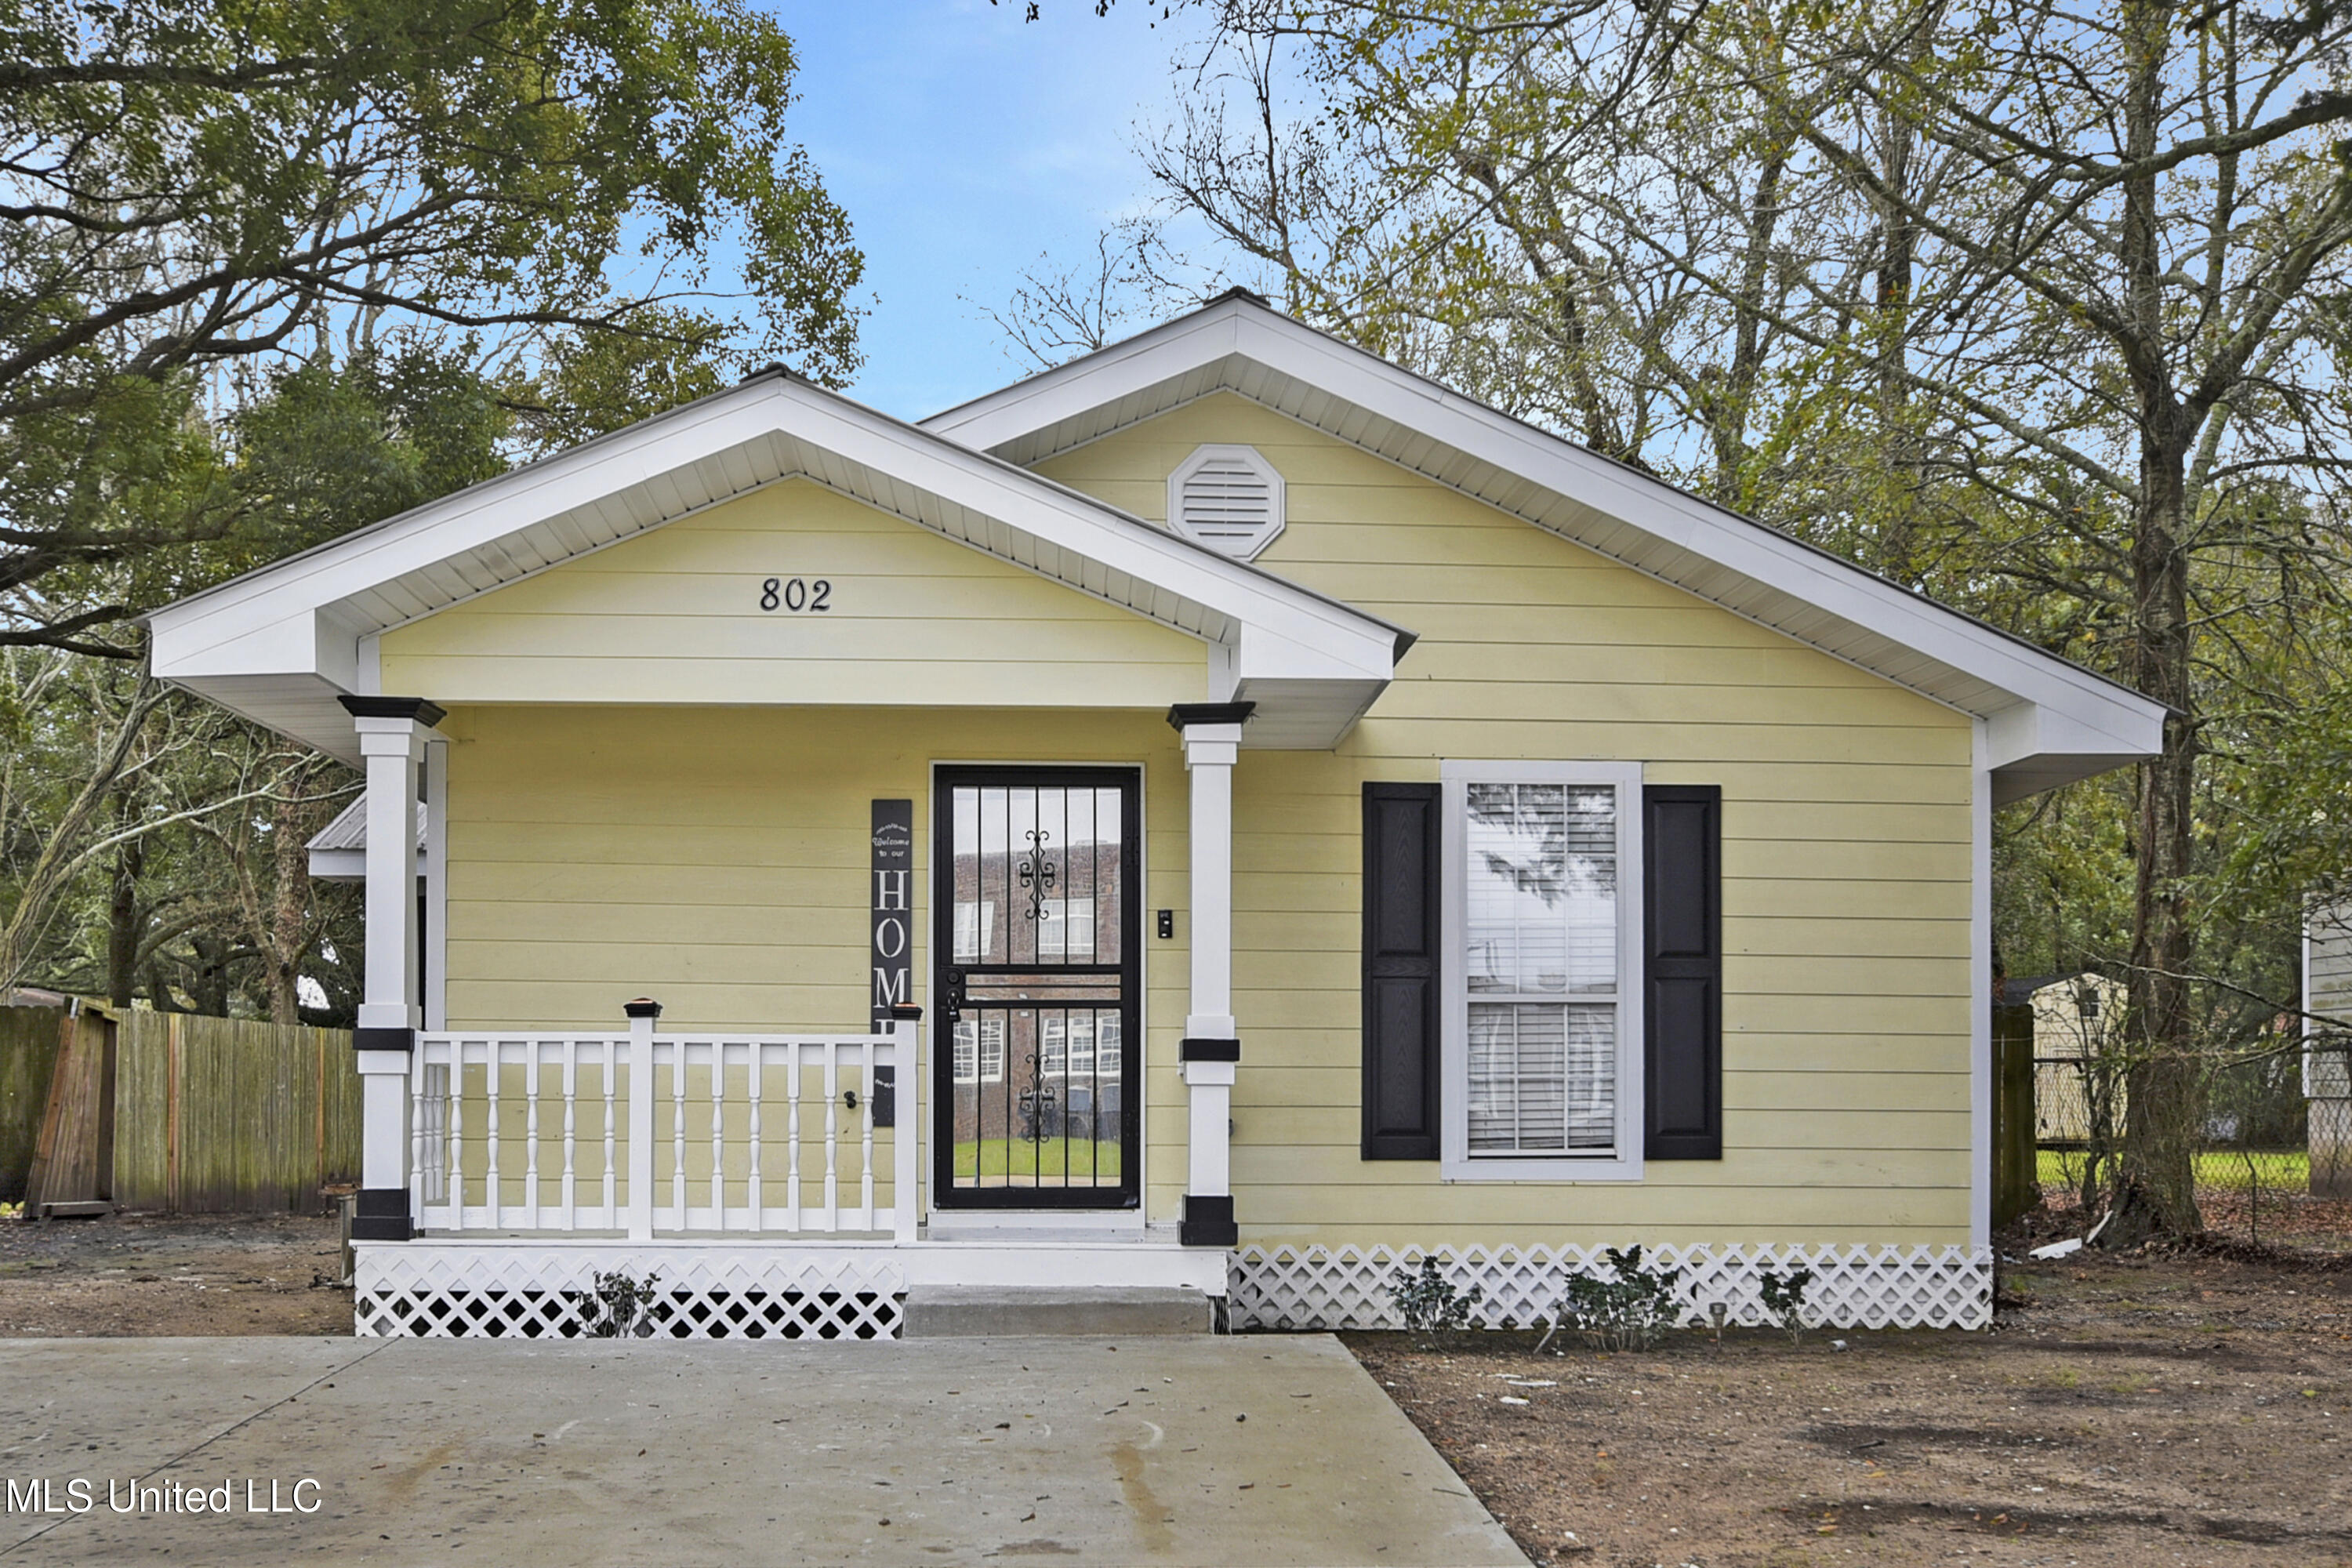
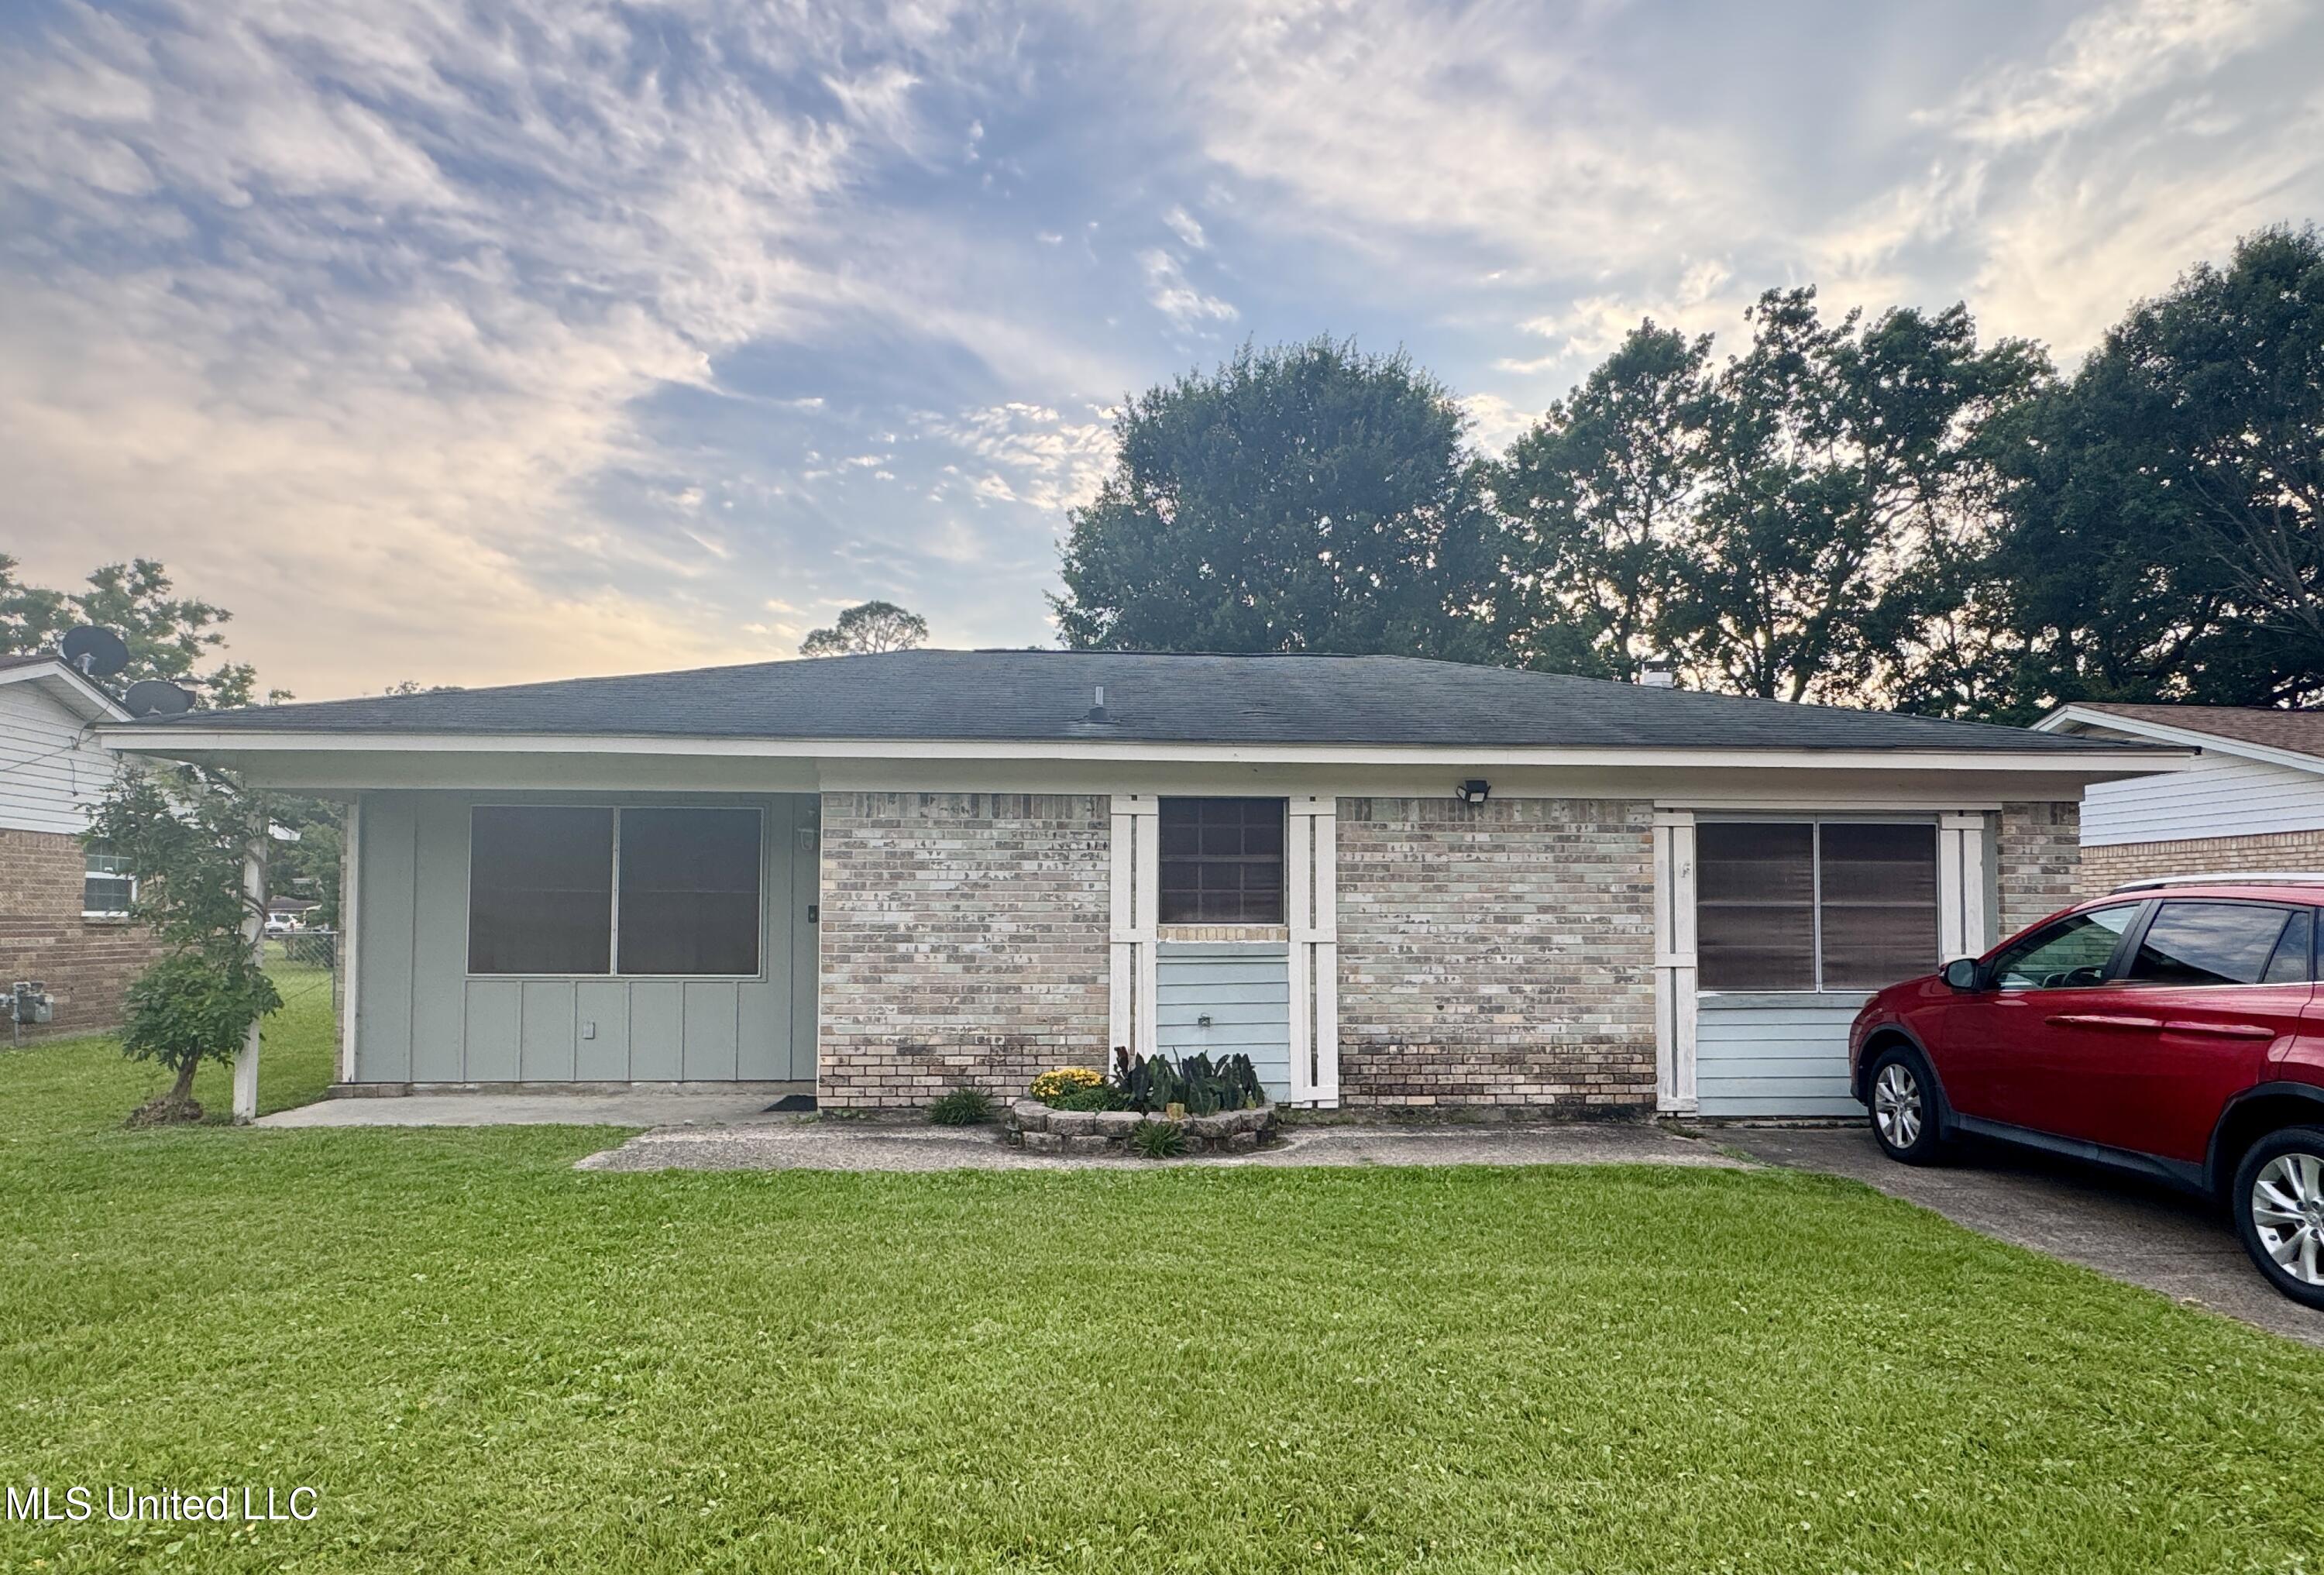
Active
$149,900
3
bds
|
2
ba
|
0
sqft
|
built
1945
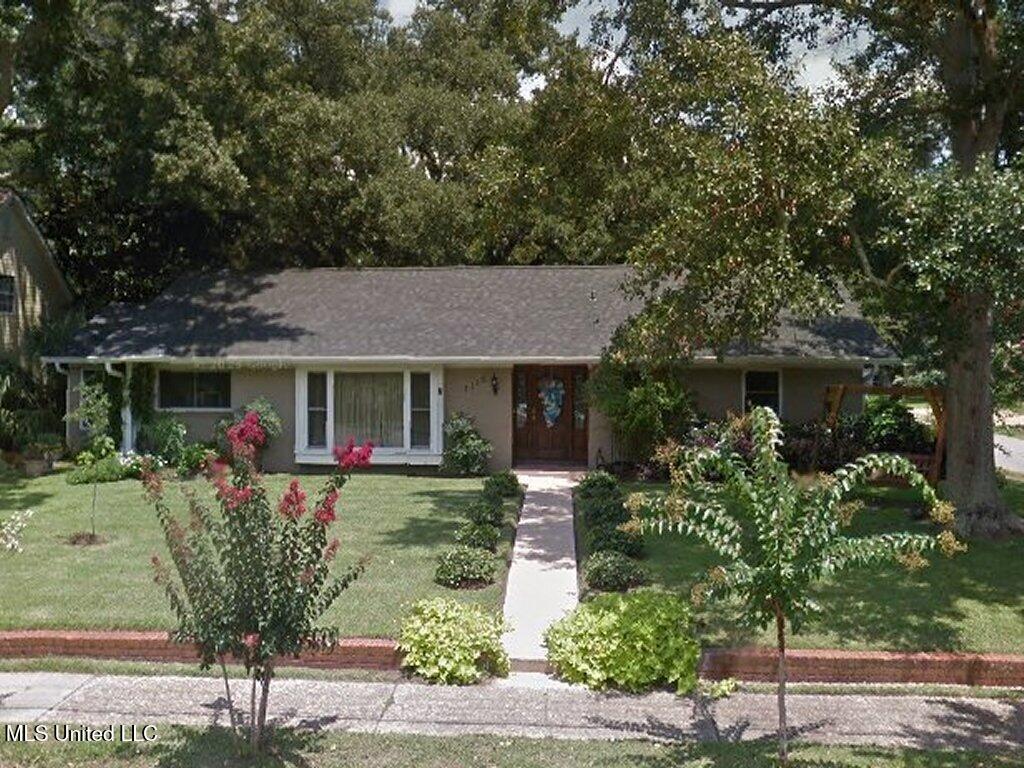
802 Dupont Ave, Pascagoula, MS 39567
$212
Cash flow
7.4%
Cash-on-Cash Return
7.4%
Cap rate
0.9%
Rent to Value Ratio
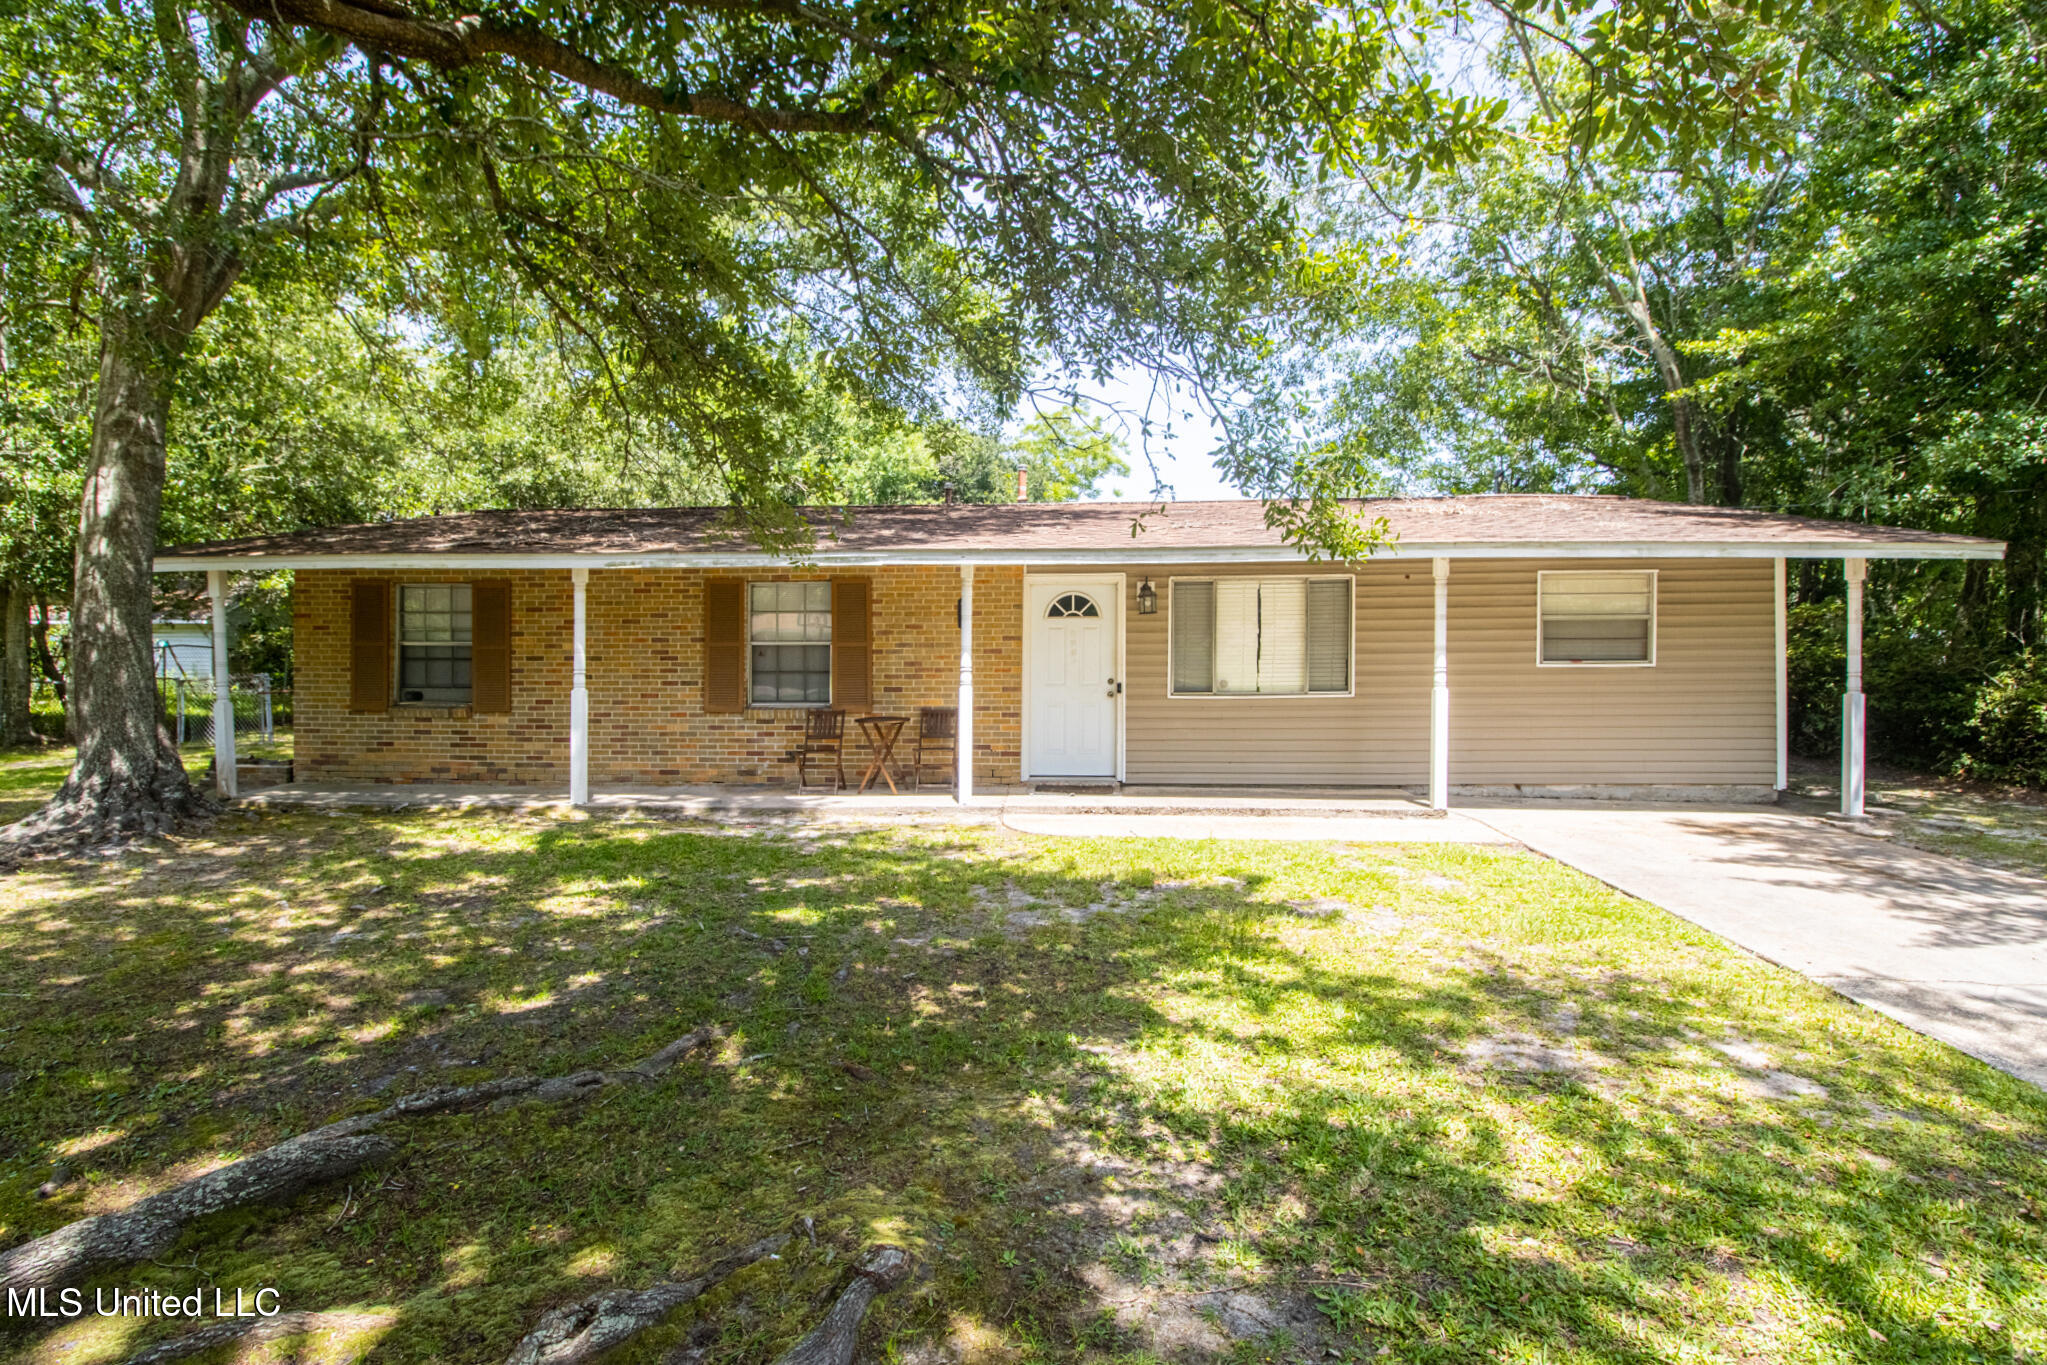
Active
$150,000
3
bds
|
2
ba
|
0
sqft
|
built
1964
4008 Emerson St, Pascagoula, MS 39581
$263
Cash flow
9.1%
Cash-on-Cash Return
7.8%
Cap rate
1.1%
Rent to Value Ratio
Pending
$195,000
4
bds
|
2
ba
|
0
sqft
|
built
1971
4210 Evie St, Pascagoula, MS 39581
$344
Cash flow
9.2%
Cash-on-Cash Return
7.8%
Cap rate
1.0%
Rent to Value Ratio
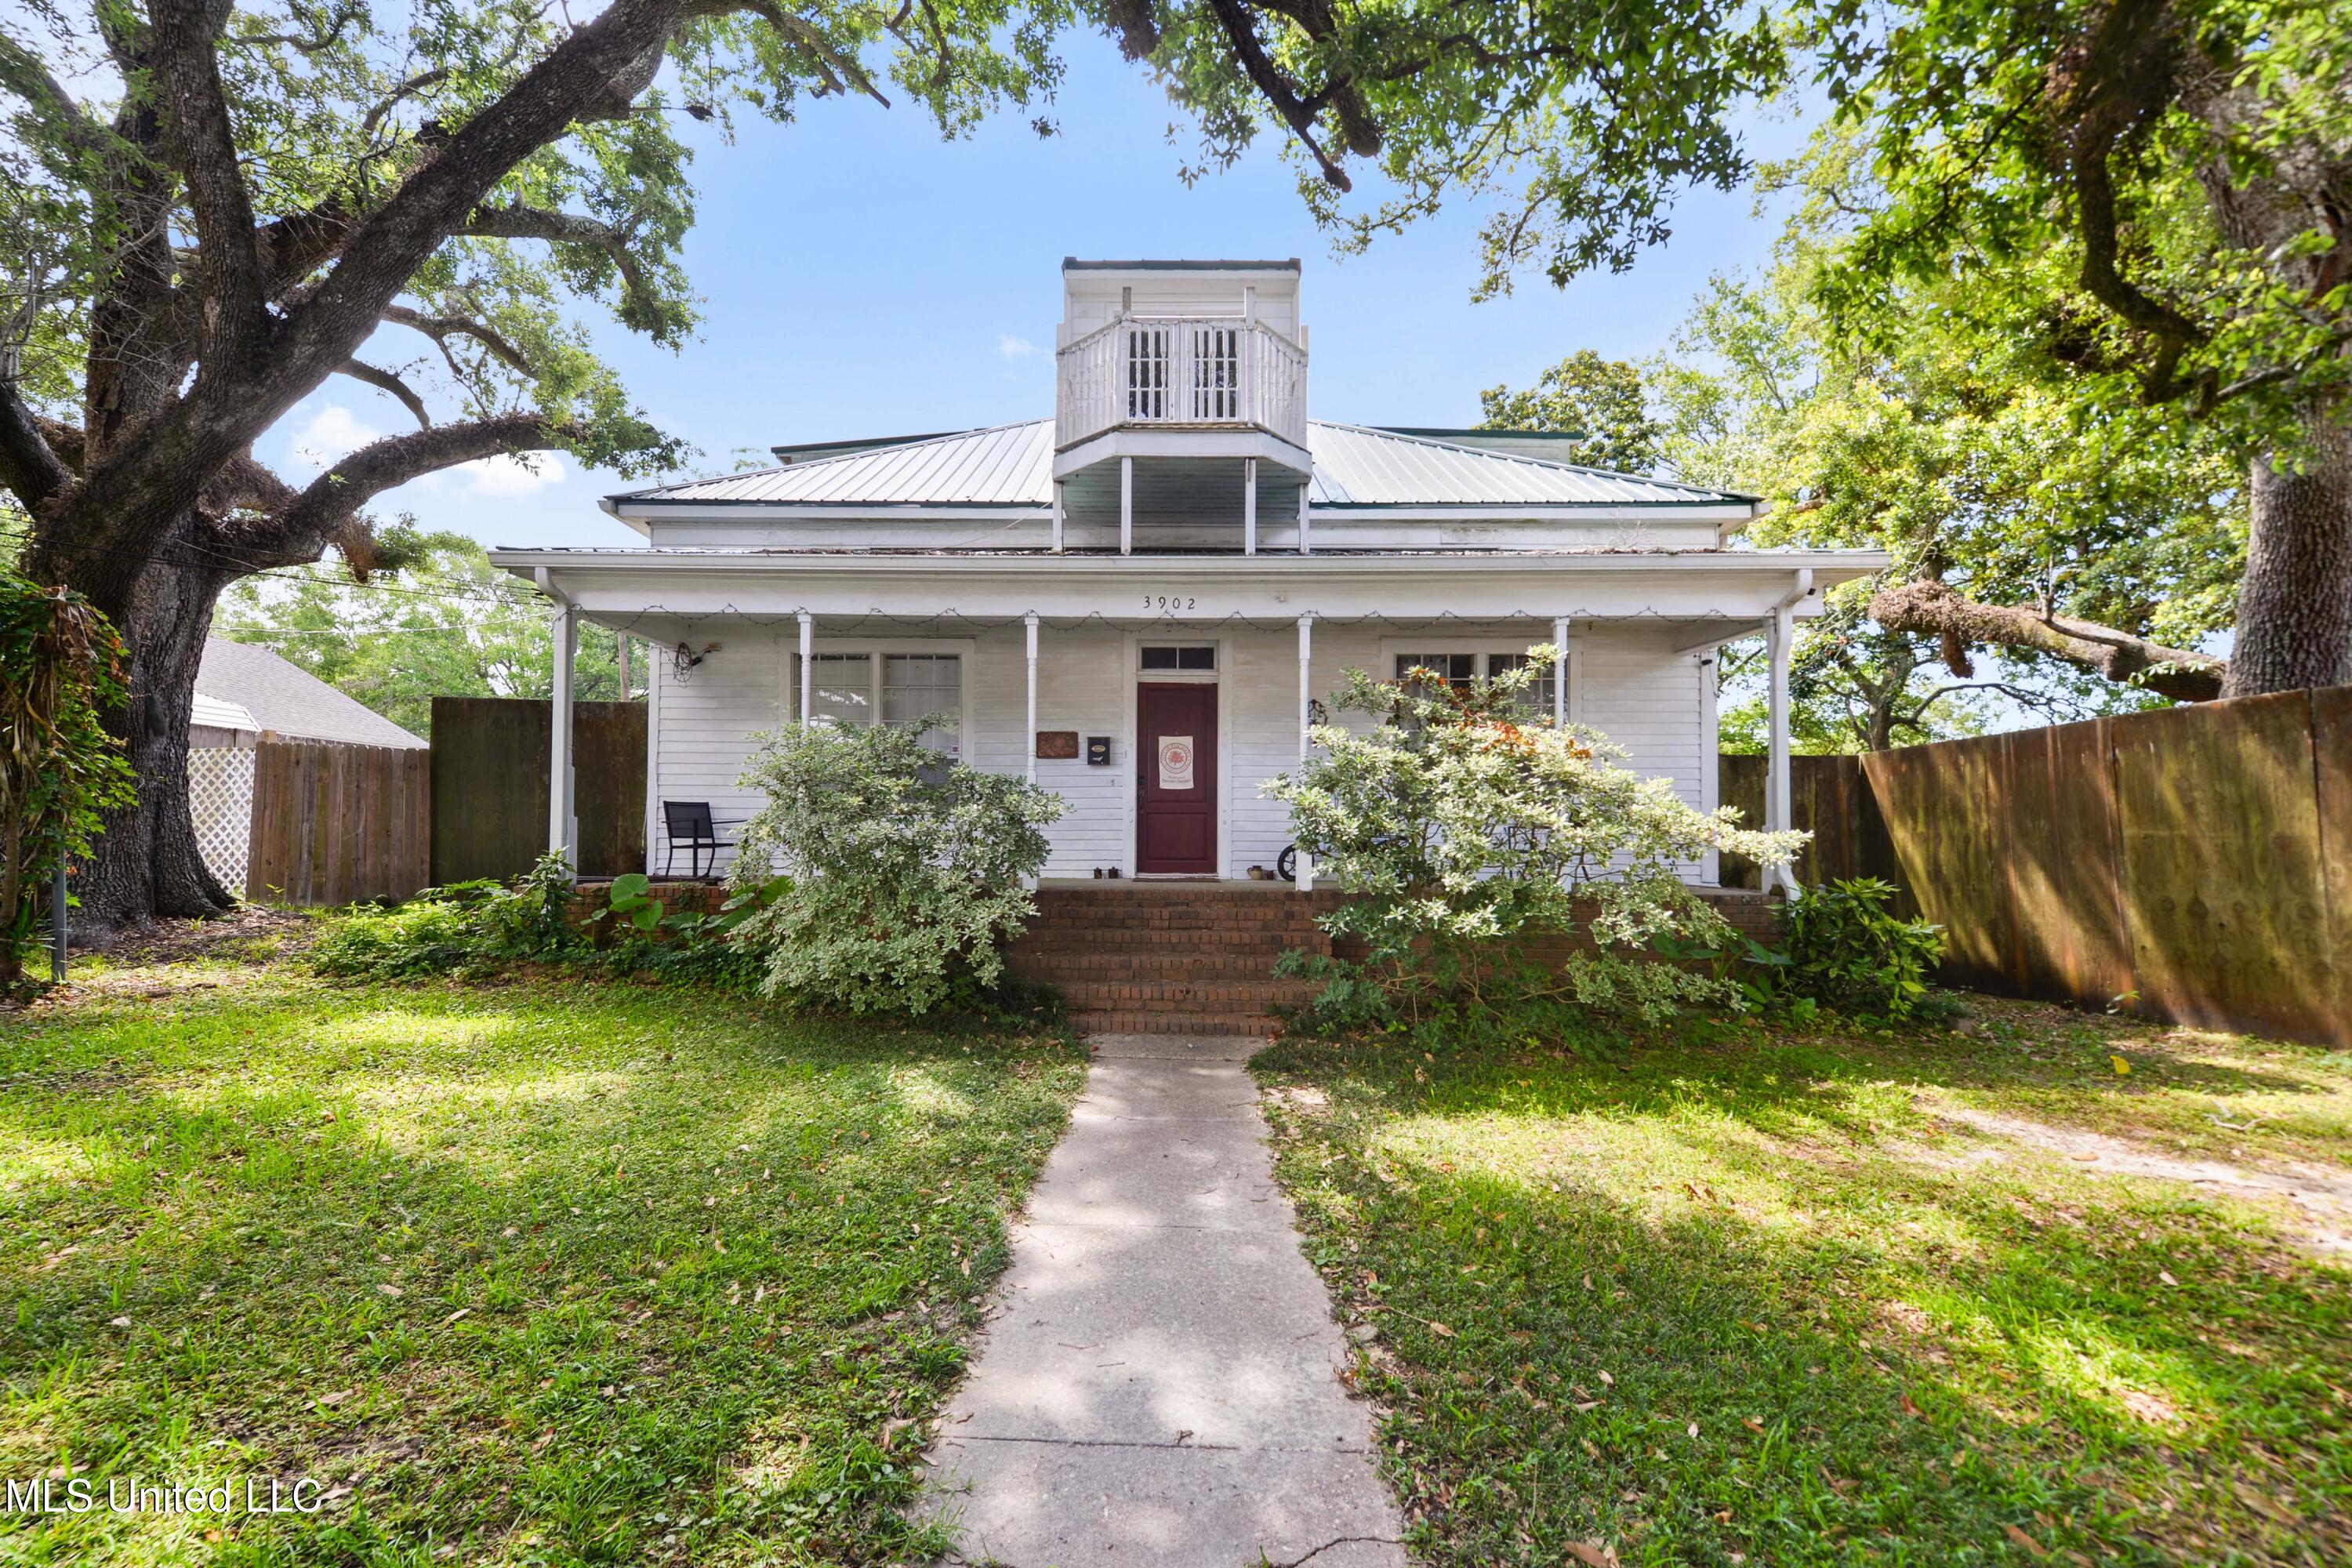
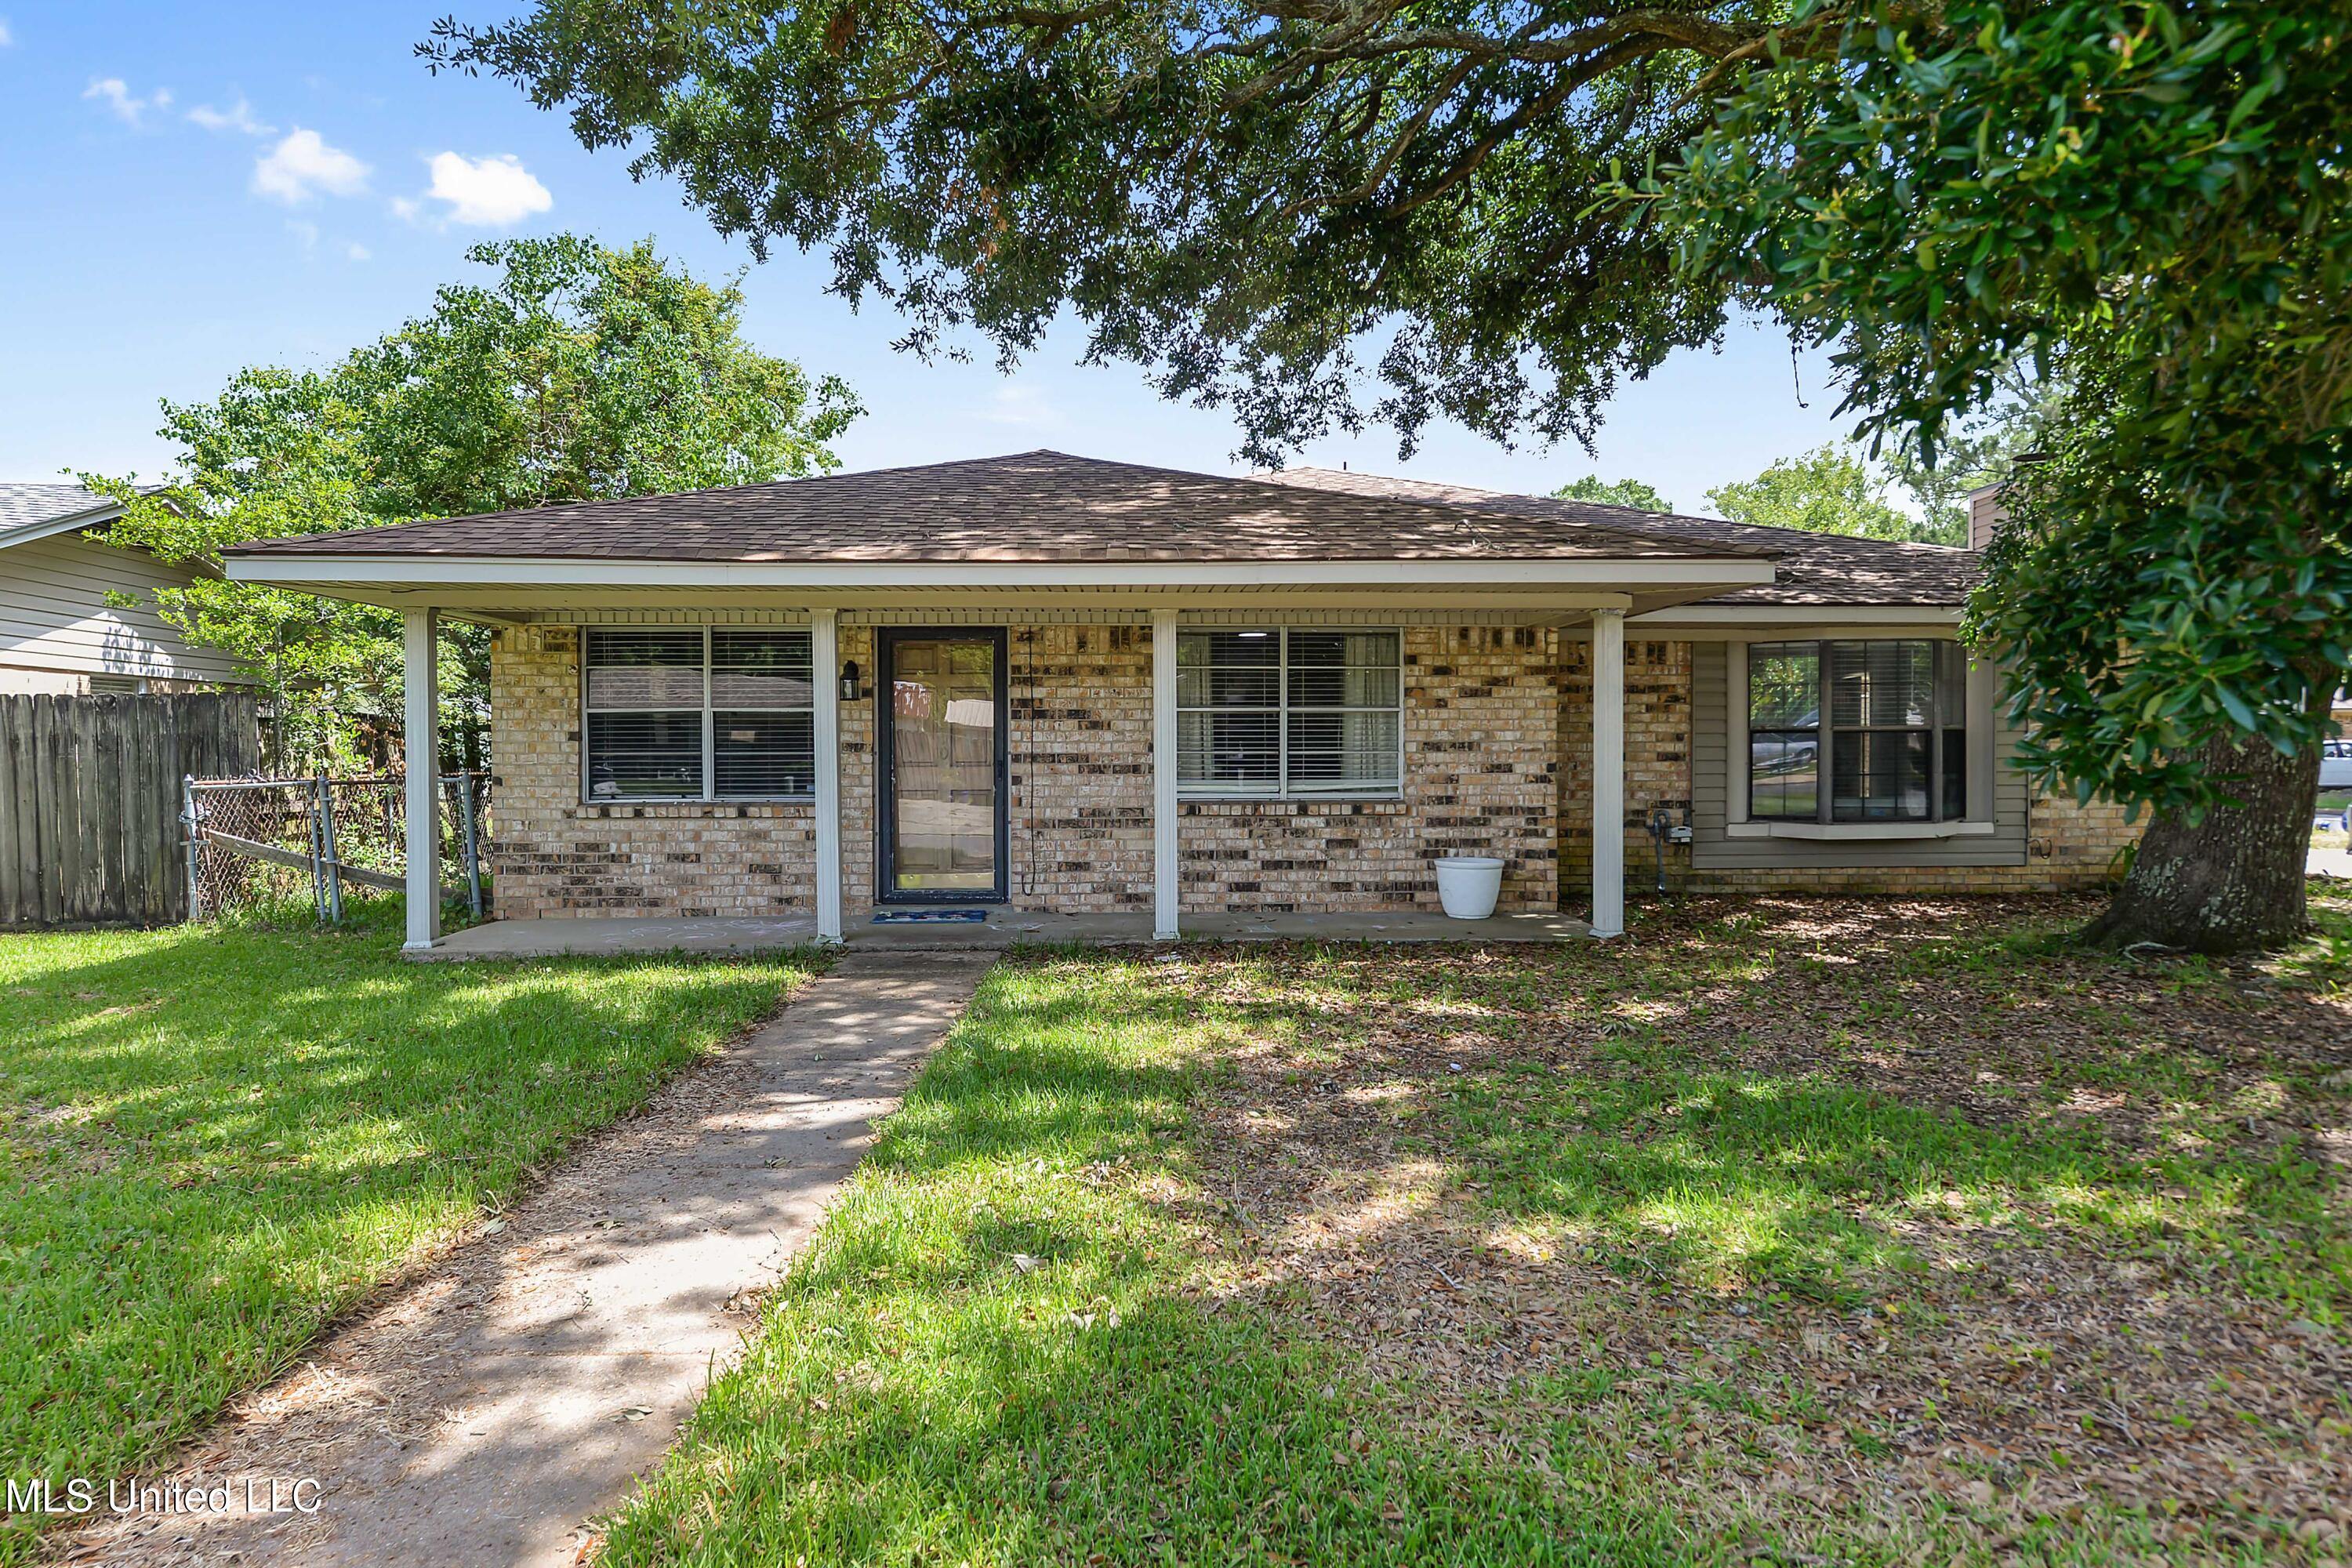
Active
$228,000
7
bds
|
6
ba
|
0
sqft
|
built
1940
3902 Pascagoula St, Pascagoula, MS 39567
$122
Cash flow
2.8%
Cash-on-Cash Return
6.3%
Cap rate
0.8%
Rent to Value Ratio
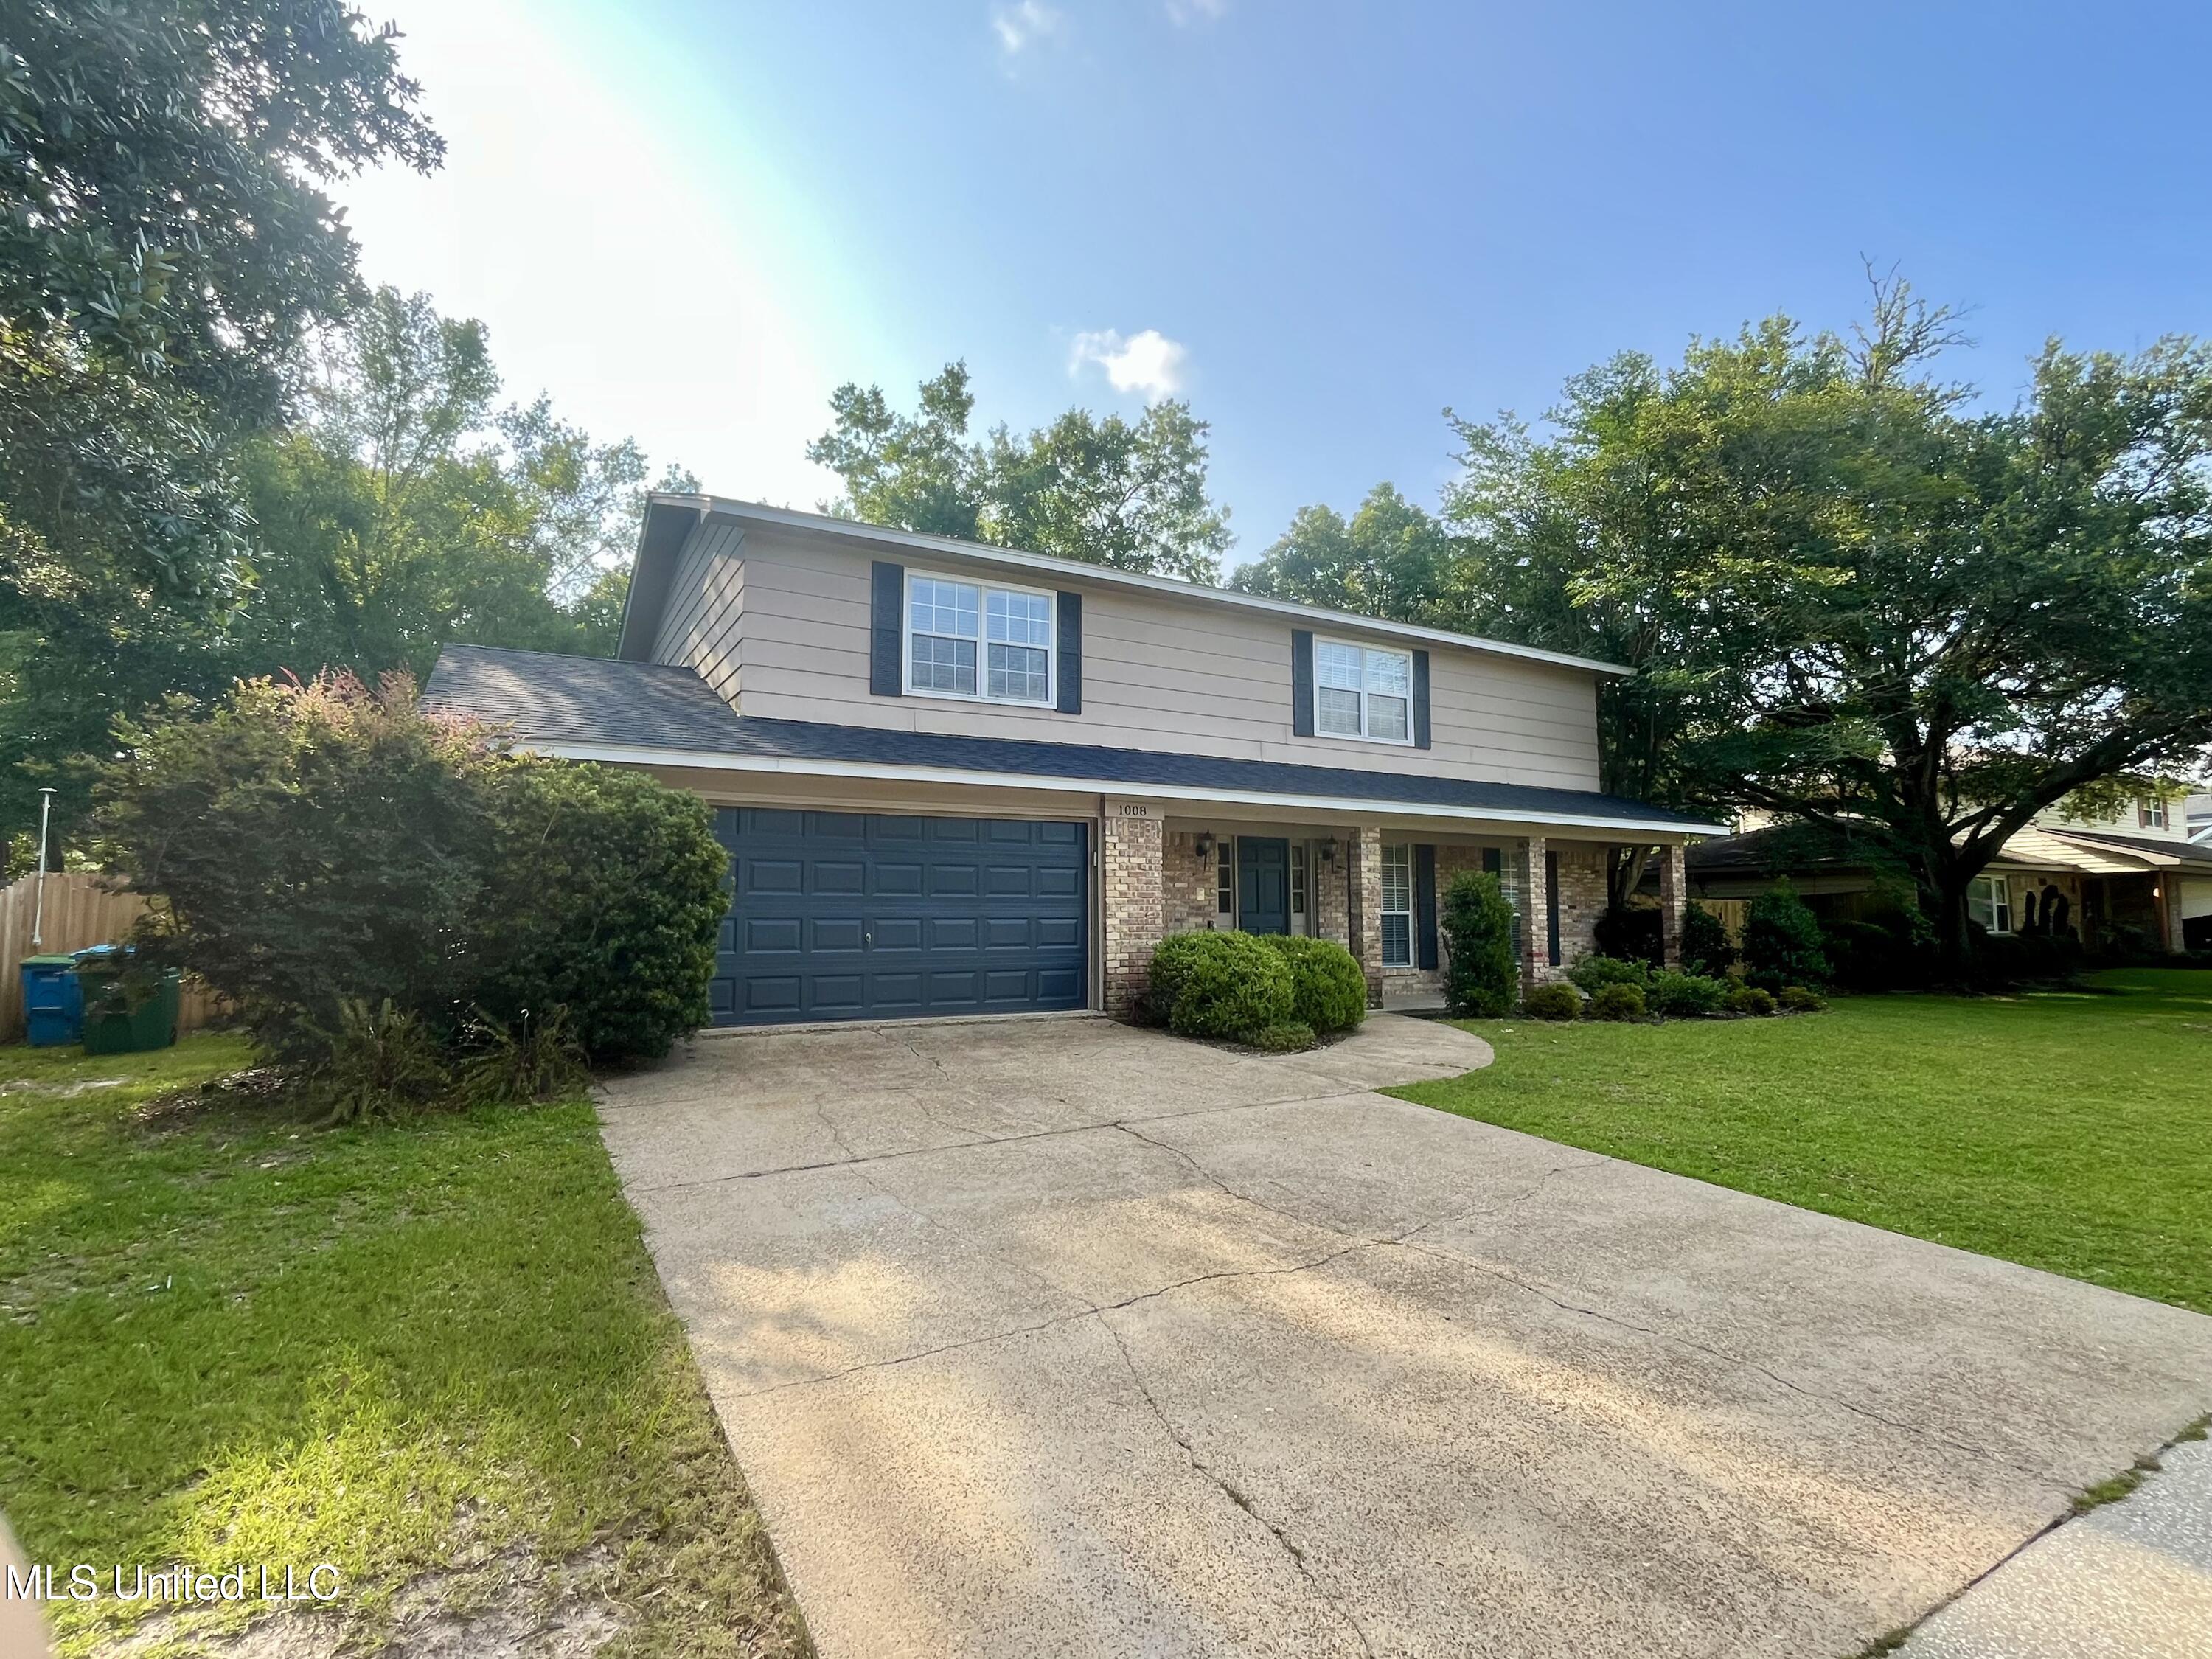
Active
$255,000
4
bds
|
3
ba
|
0
sqft
|
built
1975
1008 Swordfish St, Pascagoula, MS 39581
$155
Cash flow
3.2%
Cash-on-Cash Return
6.4%
Cap rate
0.9%
Rent to Value Ratio
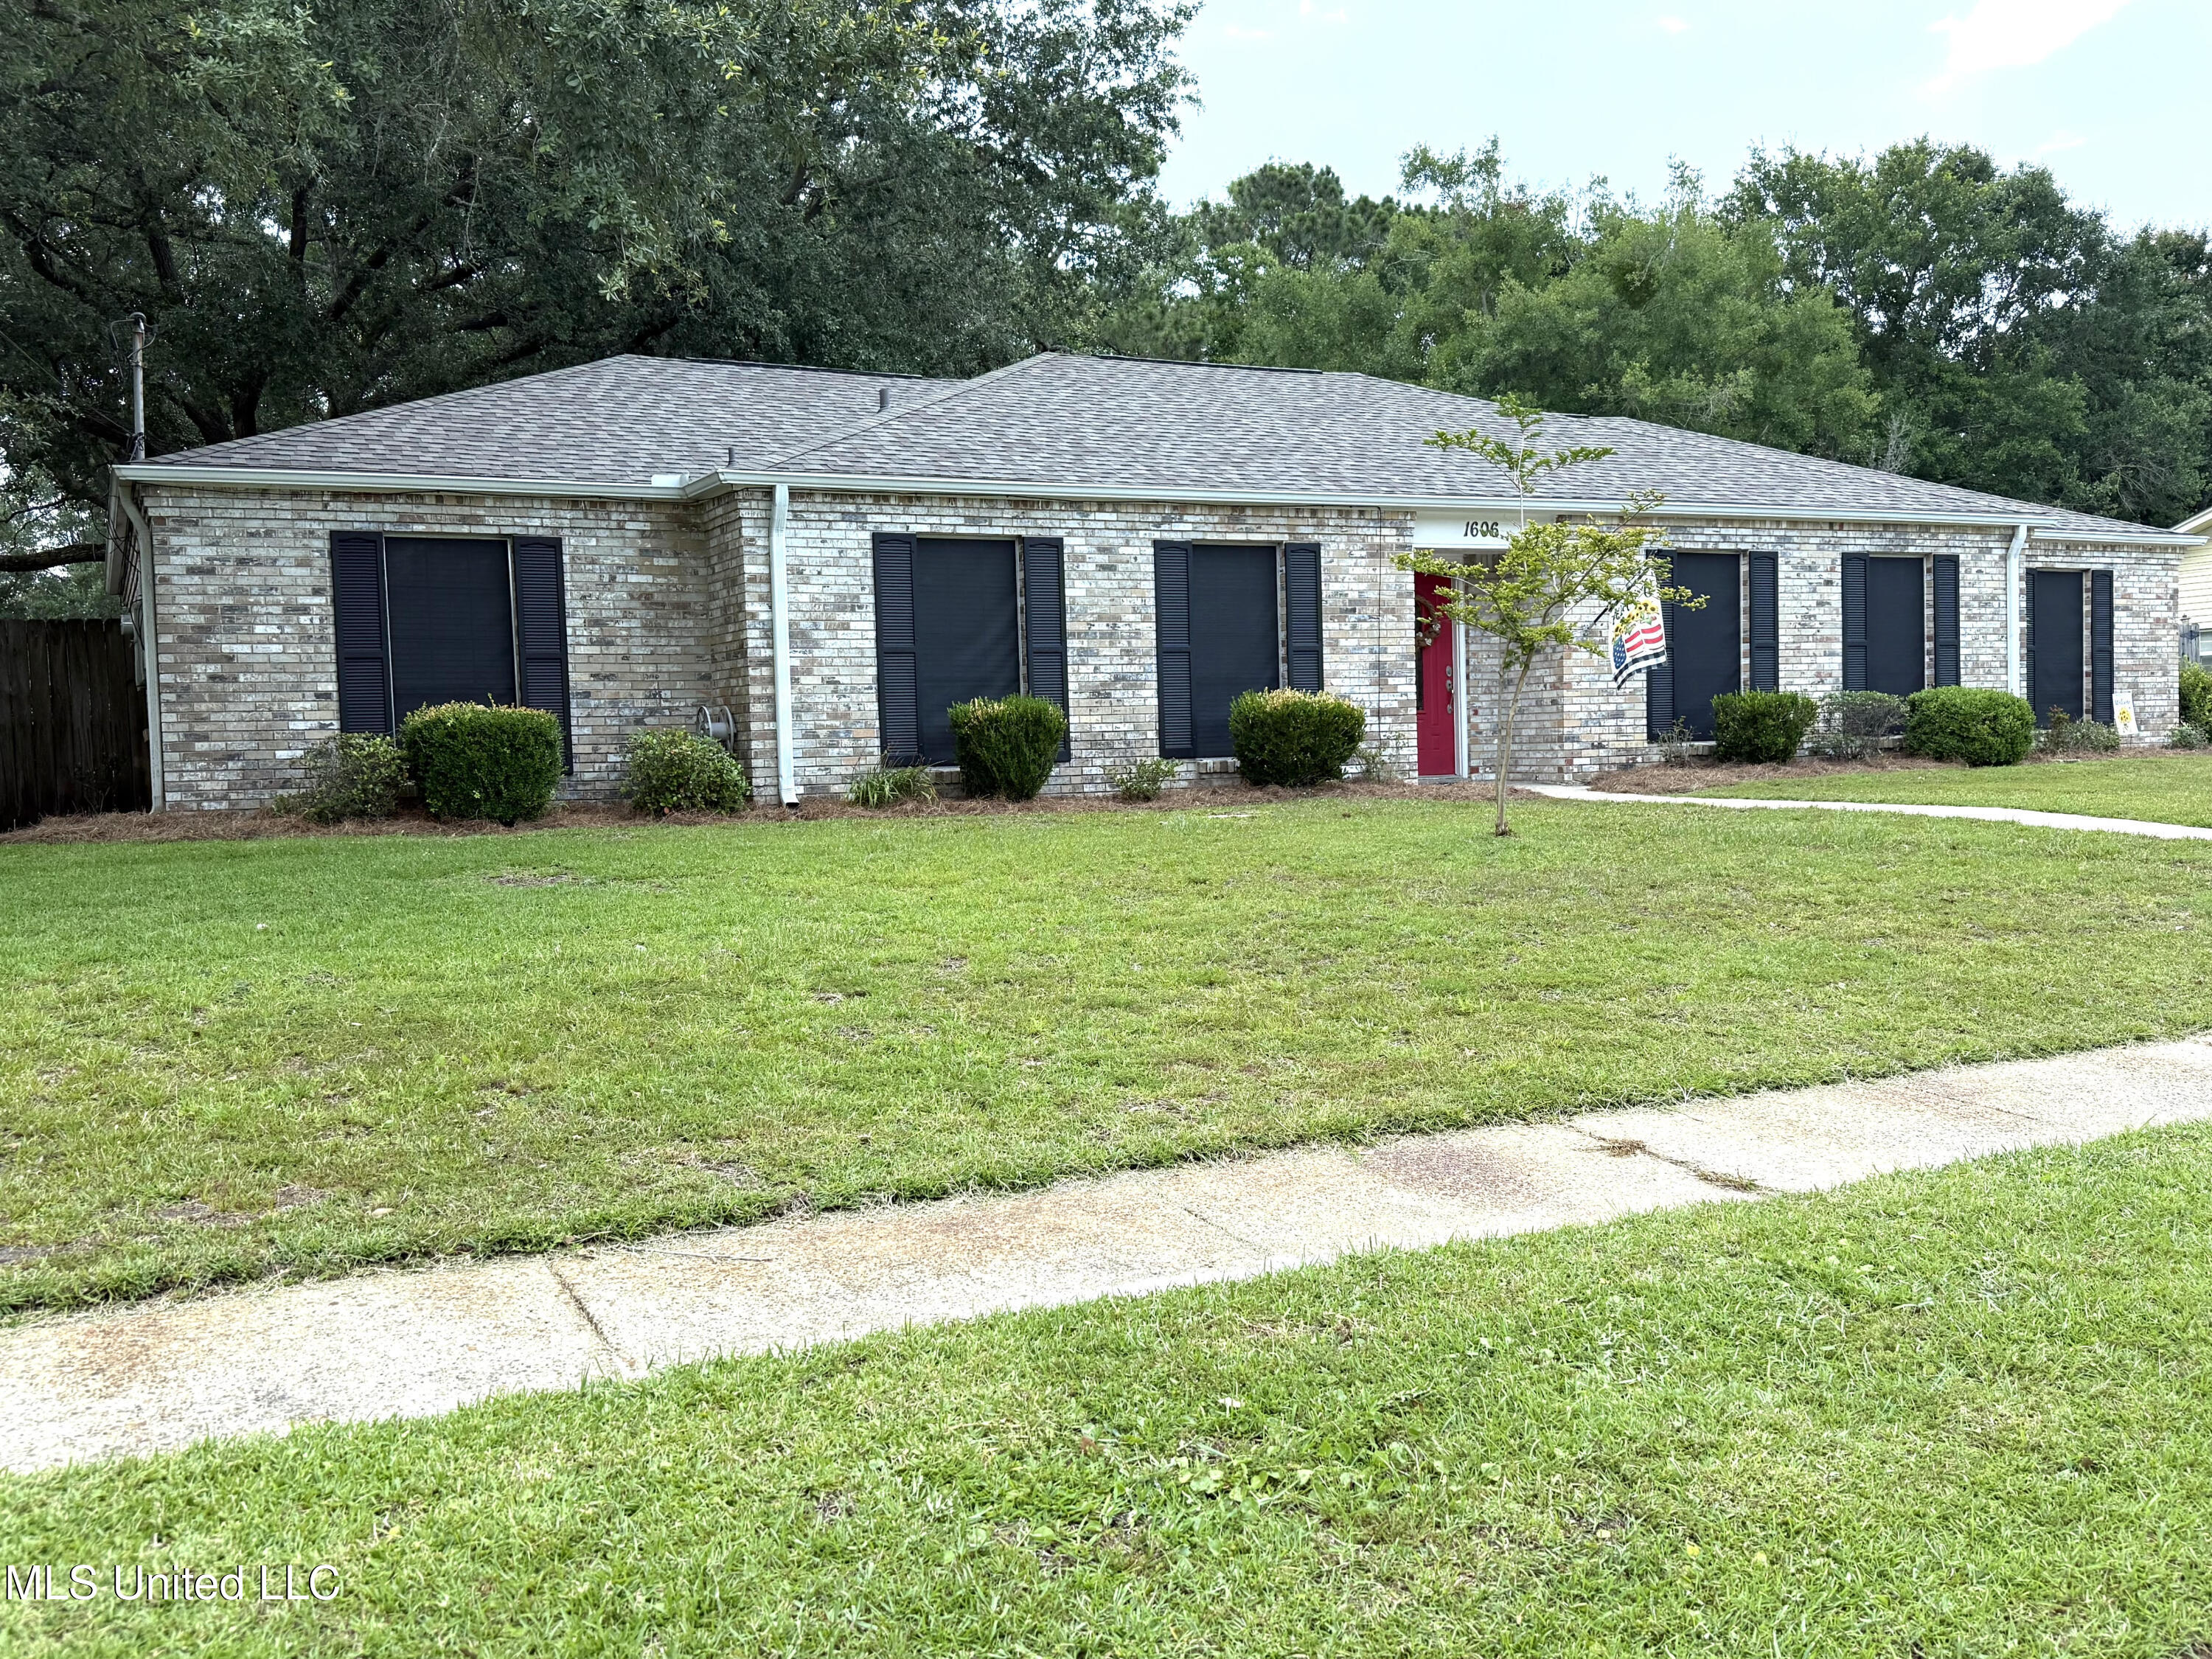
Pending
$259,000
4
bds
|
2
ba
|
0
sqft
|
built
1971
1606 Woodhaven St, Pascagoula, MS 39581
$28
Cash flow
0.6%
Cash-on-Cash Return
5.8%
Cap rate
0.8%
Rent to Value Ratio
Active
$133,500
3
bds
|
2
ba
|
0
sqft
|
built
1972
3607 Pentagon Dr, Pascagoula, MS 39581
$394
Cash flow
15.4%
Cash-on-Cash Return
9.2%
Cap rate
1.2%
Rent to Value Ratio
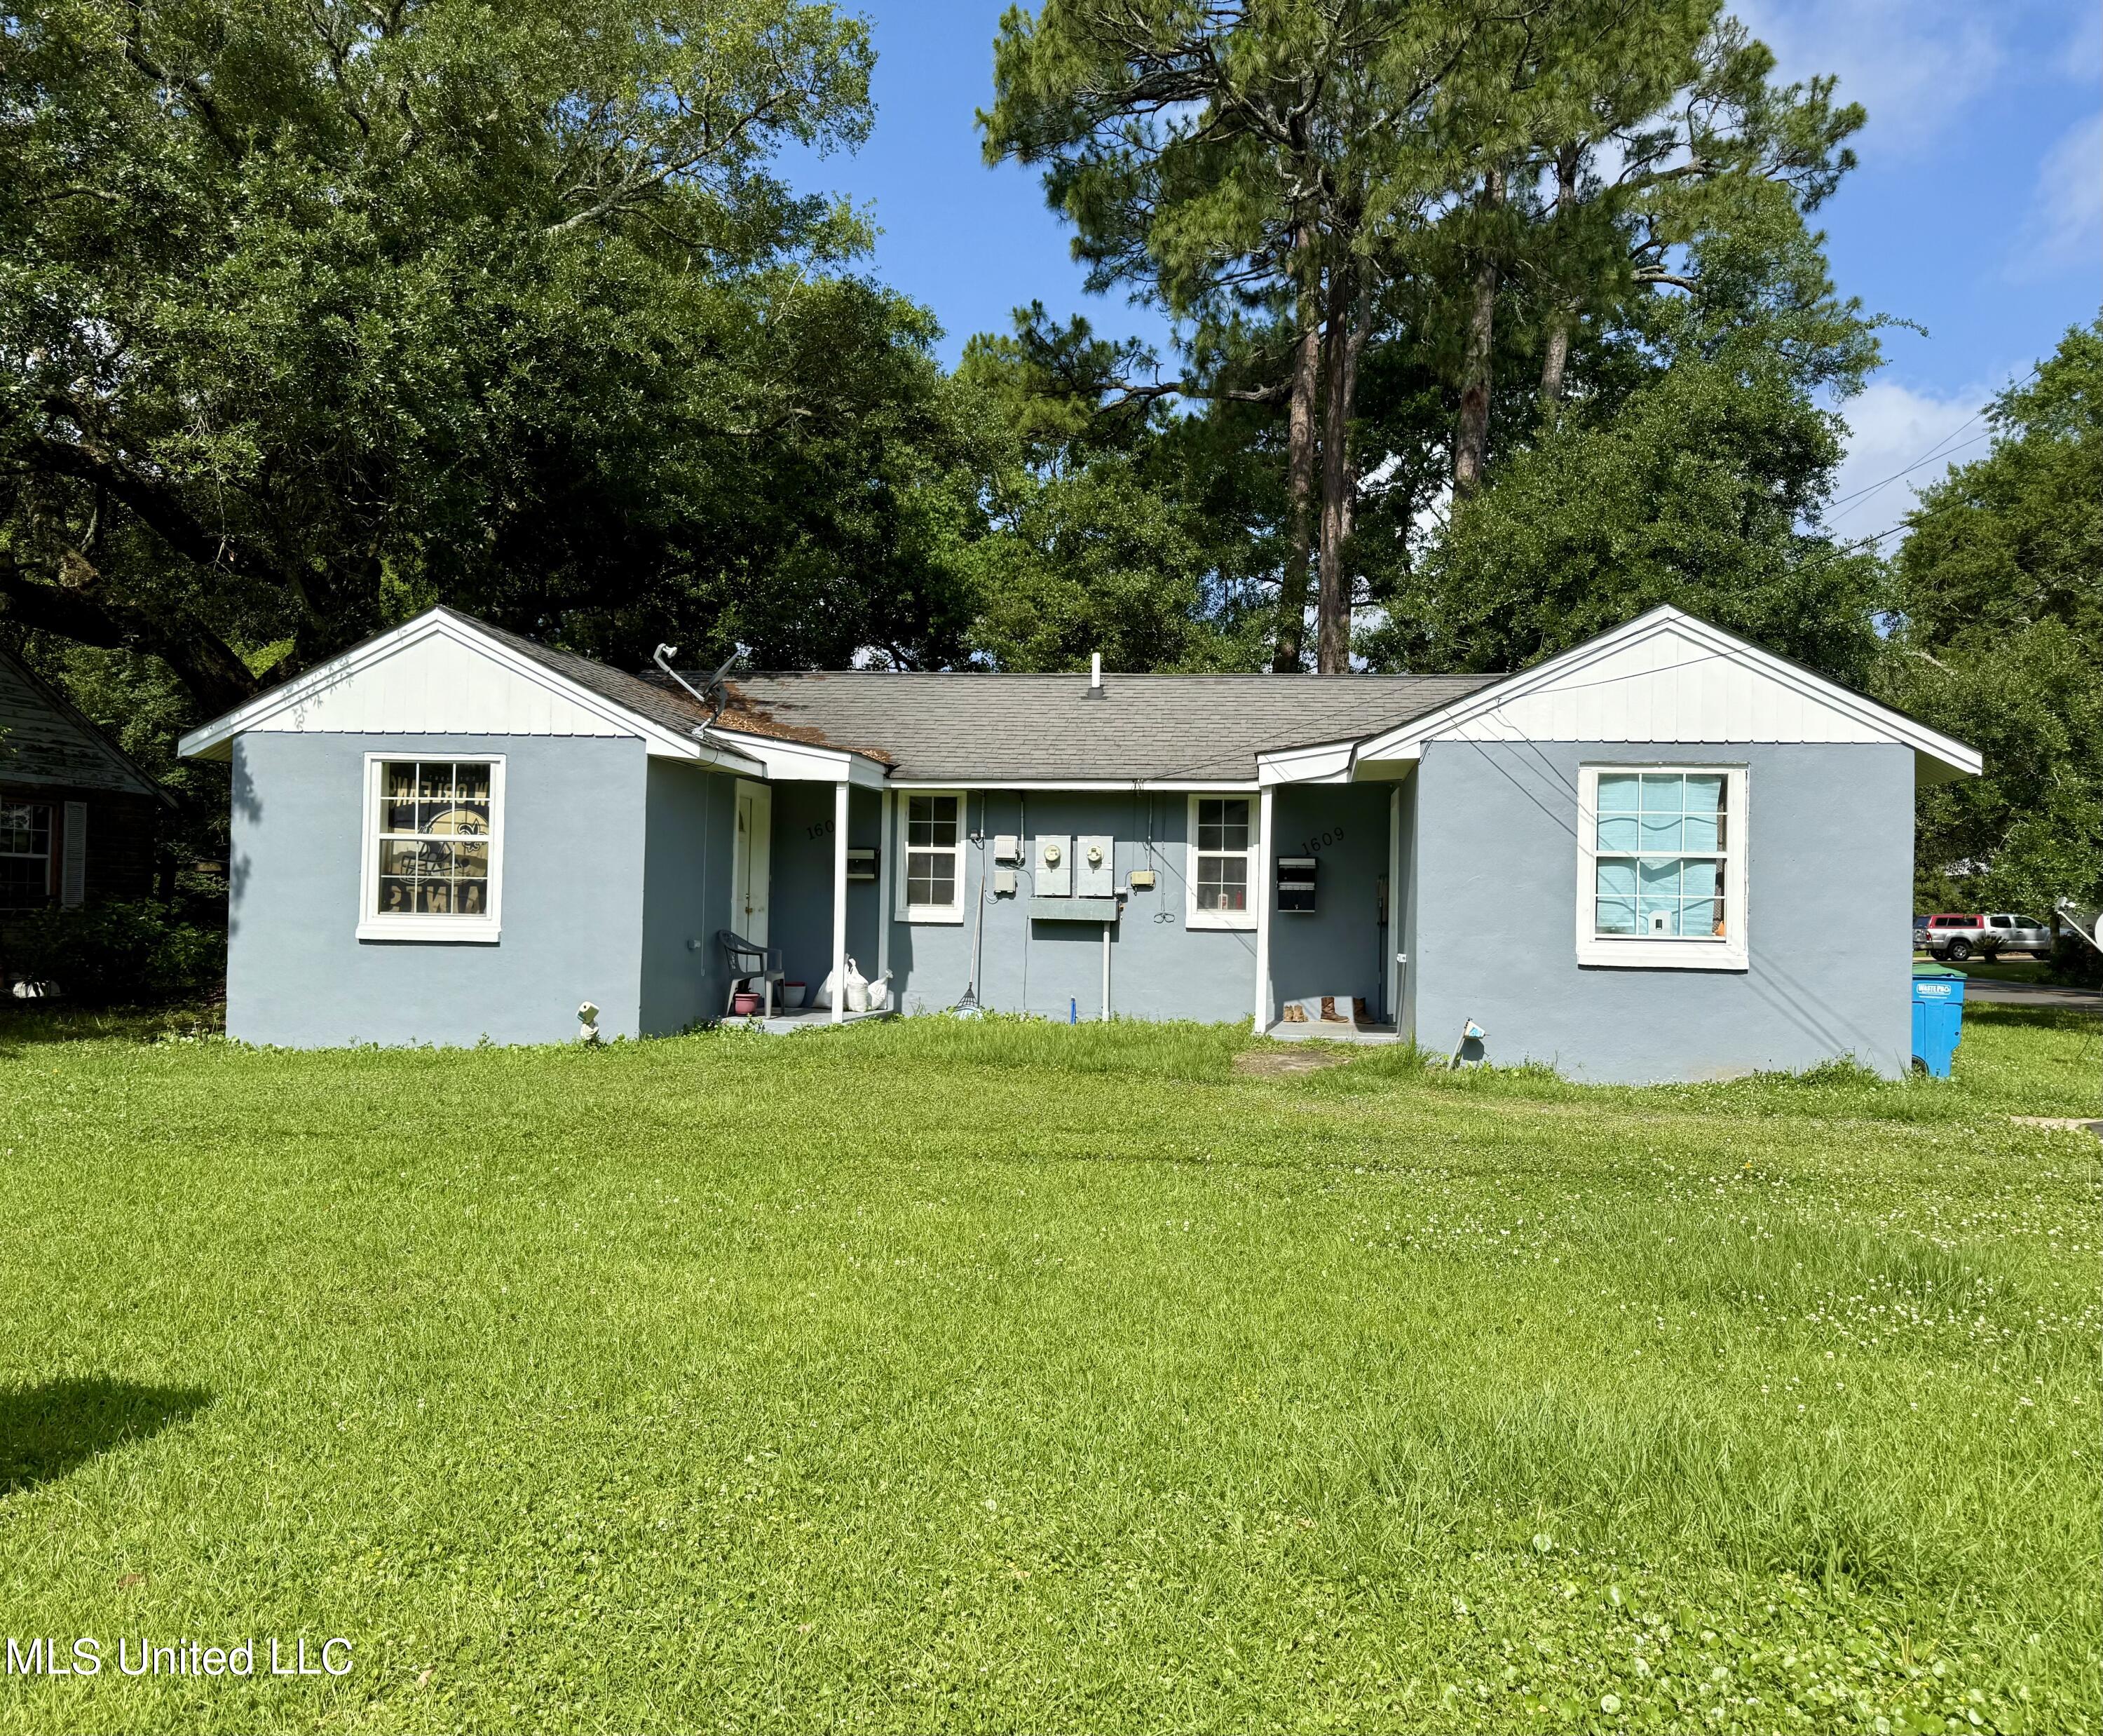
Active
$149,900
2
bds
|
2
ba
|
0
sqft
|
built
1940
1607 Resca De La Palma St, Pascagoula, MS 39567
$-200
Cash flow
-7.0%
Cash-on-Cash Return
4.1%
Cap rate
0.6%
Rent to Value Ratio
Active
$136,000
3
bds
|
1
ba
|
0
sqft
|
built
1941
2411 14th St, Pascagoula, MS 39567
$172
Cash flow
6.6%
Cash-on-Cash Return
7.2%
Cap rate
1.0%
Rent to Value Ratio
Active
$76,500
3
bds
|
1
ba
|
0
sqft
|
built
1948
4103 Ingalls Ave, Pascagoula, MS 39581
$540
Cash flow
36.8%
Cash-on-Cash Return
14.1%
Cap rate
1.8%
Rent to Value Ratio

Active
$134,900
5
bds
|
3
ba
|
0
sqft
|
built
1973
3010 Martin St, Pascagoula, MS 39581
$-145
Cash flow
-5.6%
Cash-on-Cash Return
4.4%
Cap rate
0.7%
Rent to Value Ratio

Active
$152,768
3
bds
|
3
ba
|
0
sqft
|
built
1965
2208 22nd St, Pascagoula, MS 39581
$36
Cash flow
1.2%
Cash-on-Cash Return
6.0%
Cap rate
0.7%
Rent to Value Ratio

Active
$134,900
3
bds
|
1
ba
|
0
sqft
|
built
1958
3217 Detroit Ave, Pascagoula, MS 39581
$328
Cash flow
12.7%
Cash-on-Cash Return
8.6%
Cap rate
1.0%
Rent to Value Ratio

Active
$229,000
4
bds
|
3
ba
|
0
sqft
|
built
1984
1301 Abbeyville St, Pascagoula, MS 39581
$155
Cash flow
3.5%
Cash-on-Cash Return
6.5%
Cap rate
1.0%
Rent to Value Ratio
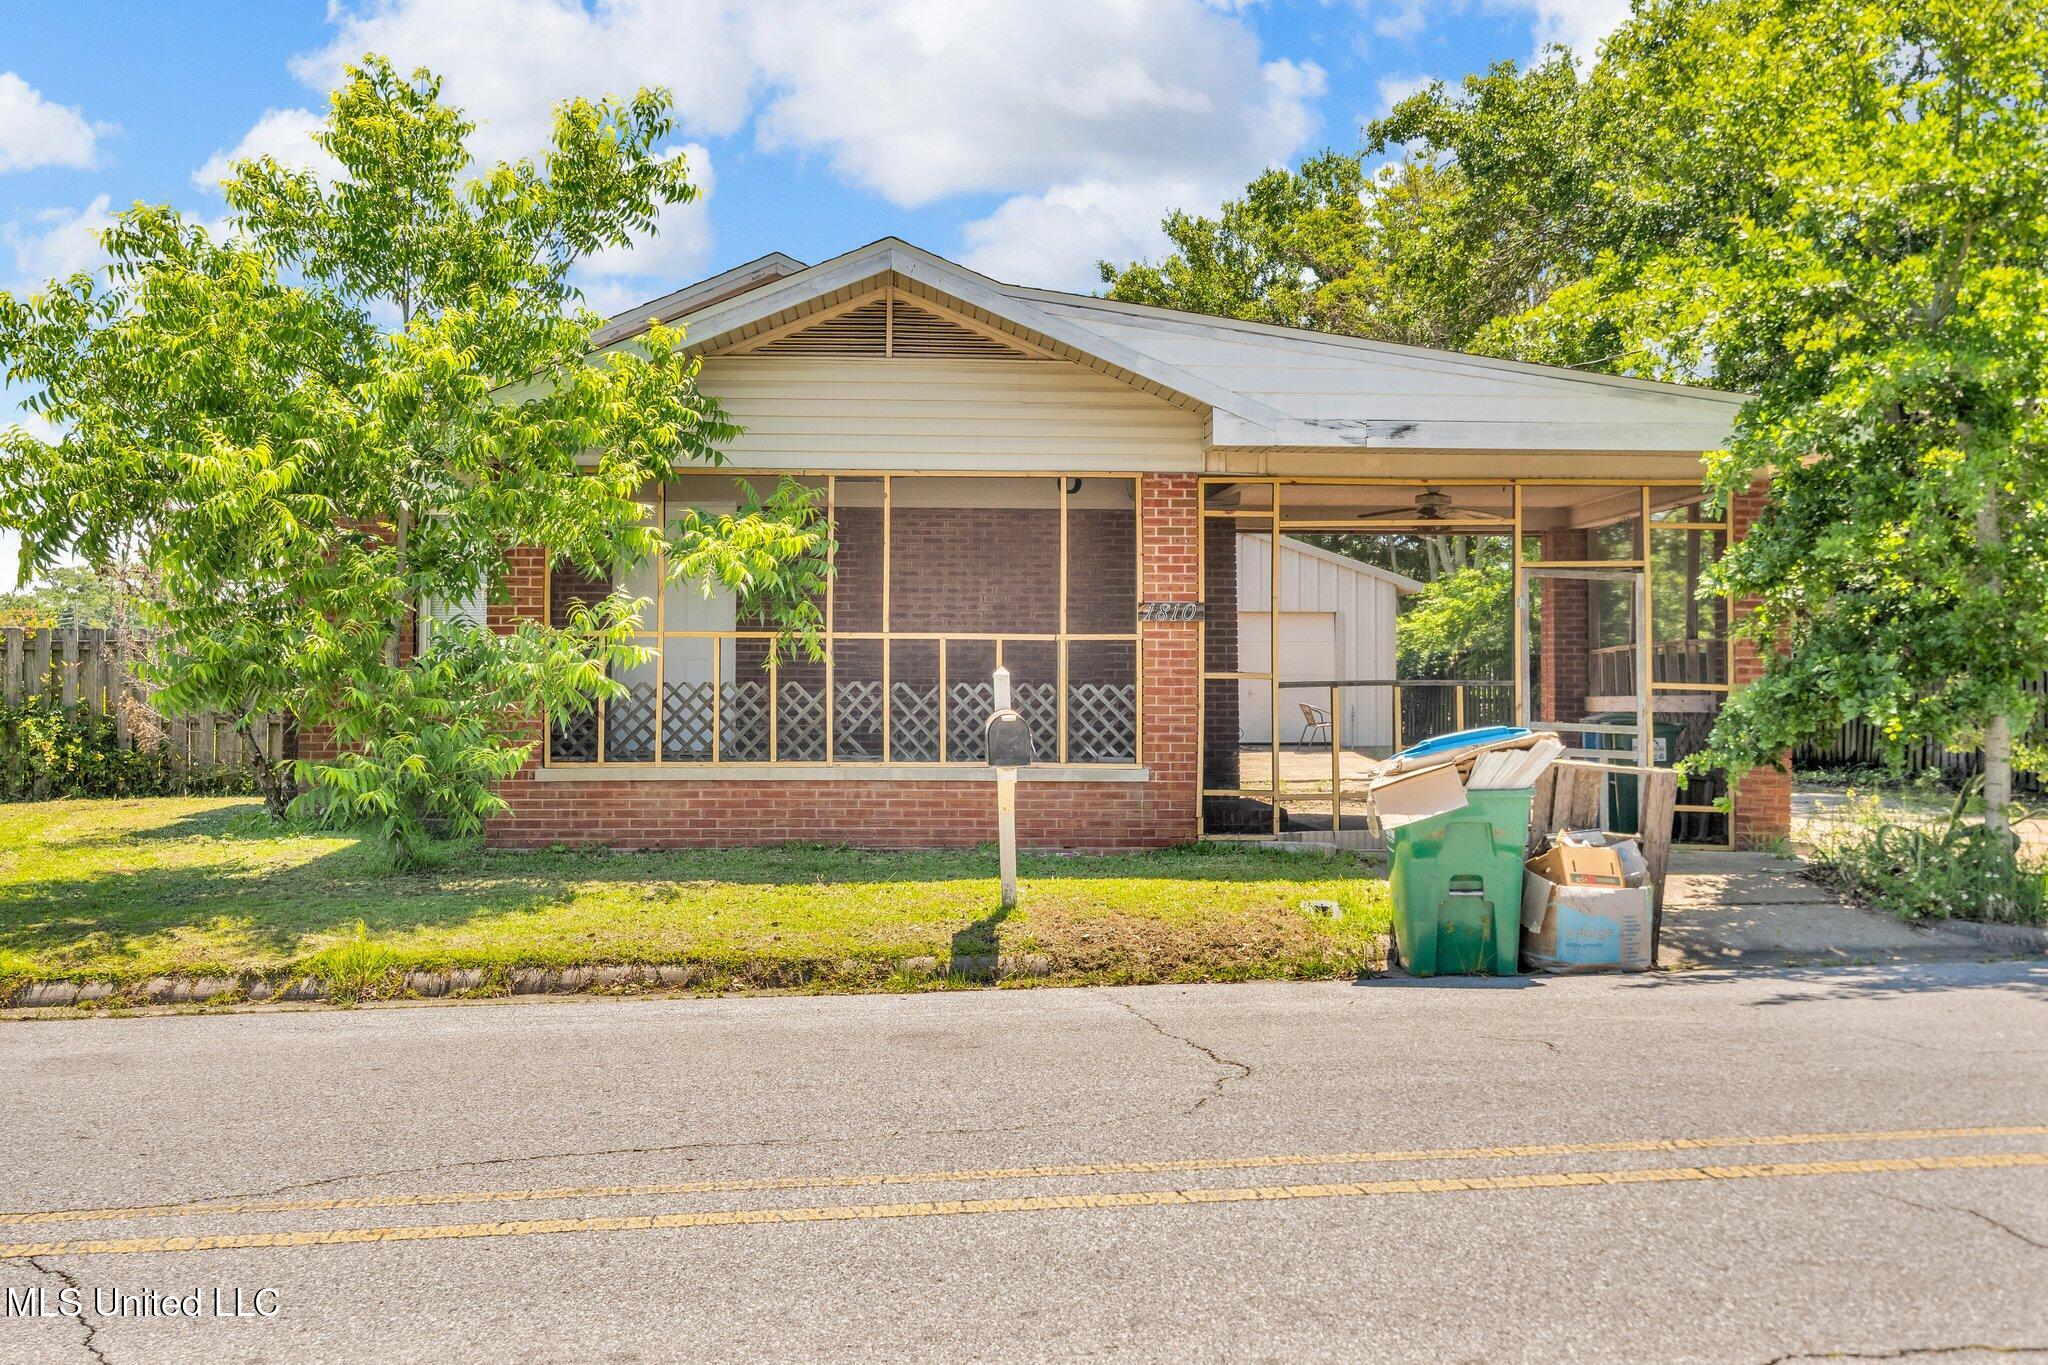
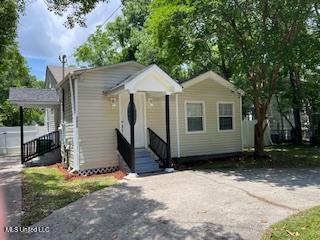
Active
$120,000
3
bds
|
2
ba
|
0
sqft
|
built
1945
1810 Roosevelt St, Pascagoula, MS 39567
$261
Cash flow
11.3%
Cash-on-Cash Return
8.3%
Cap rate
1.2%
Rent to Value Ratio
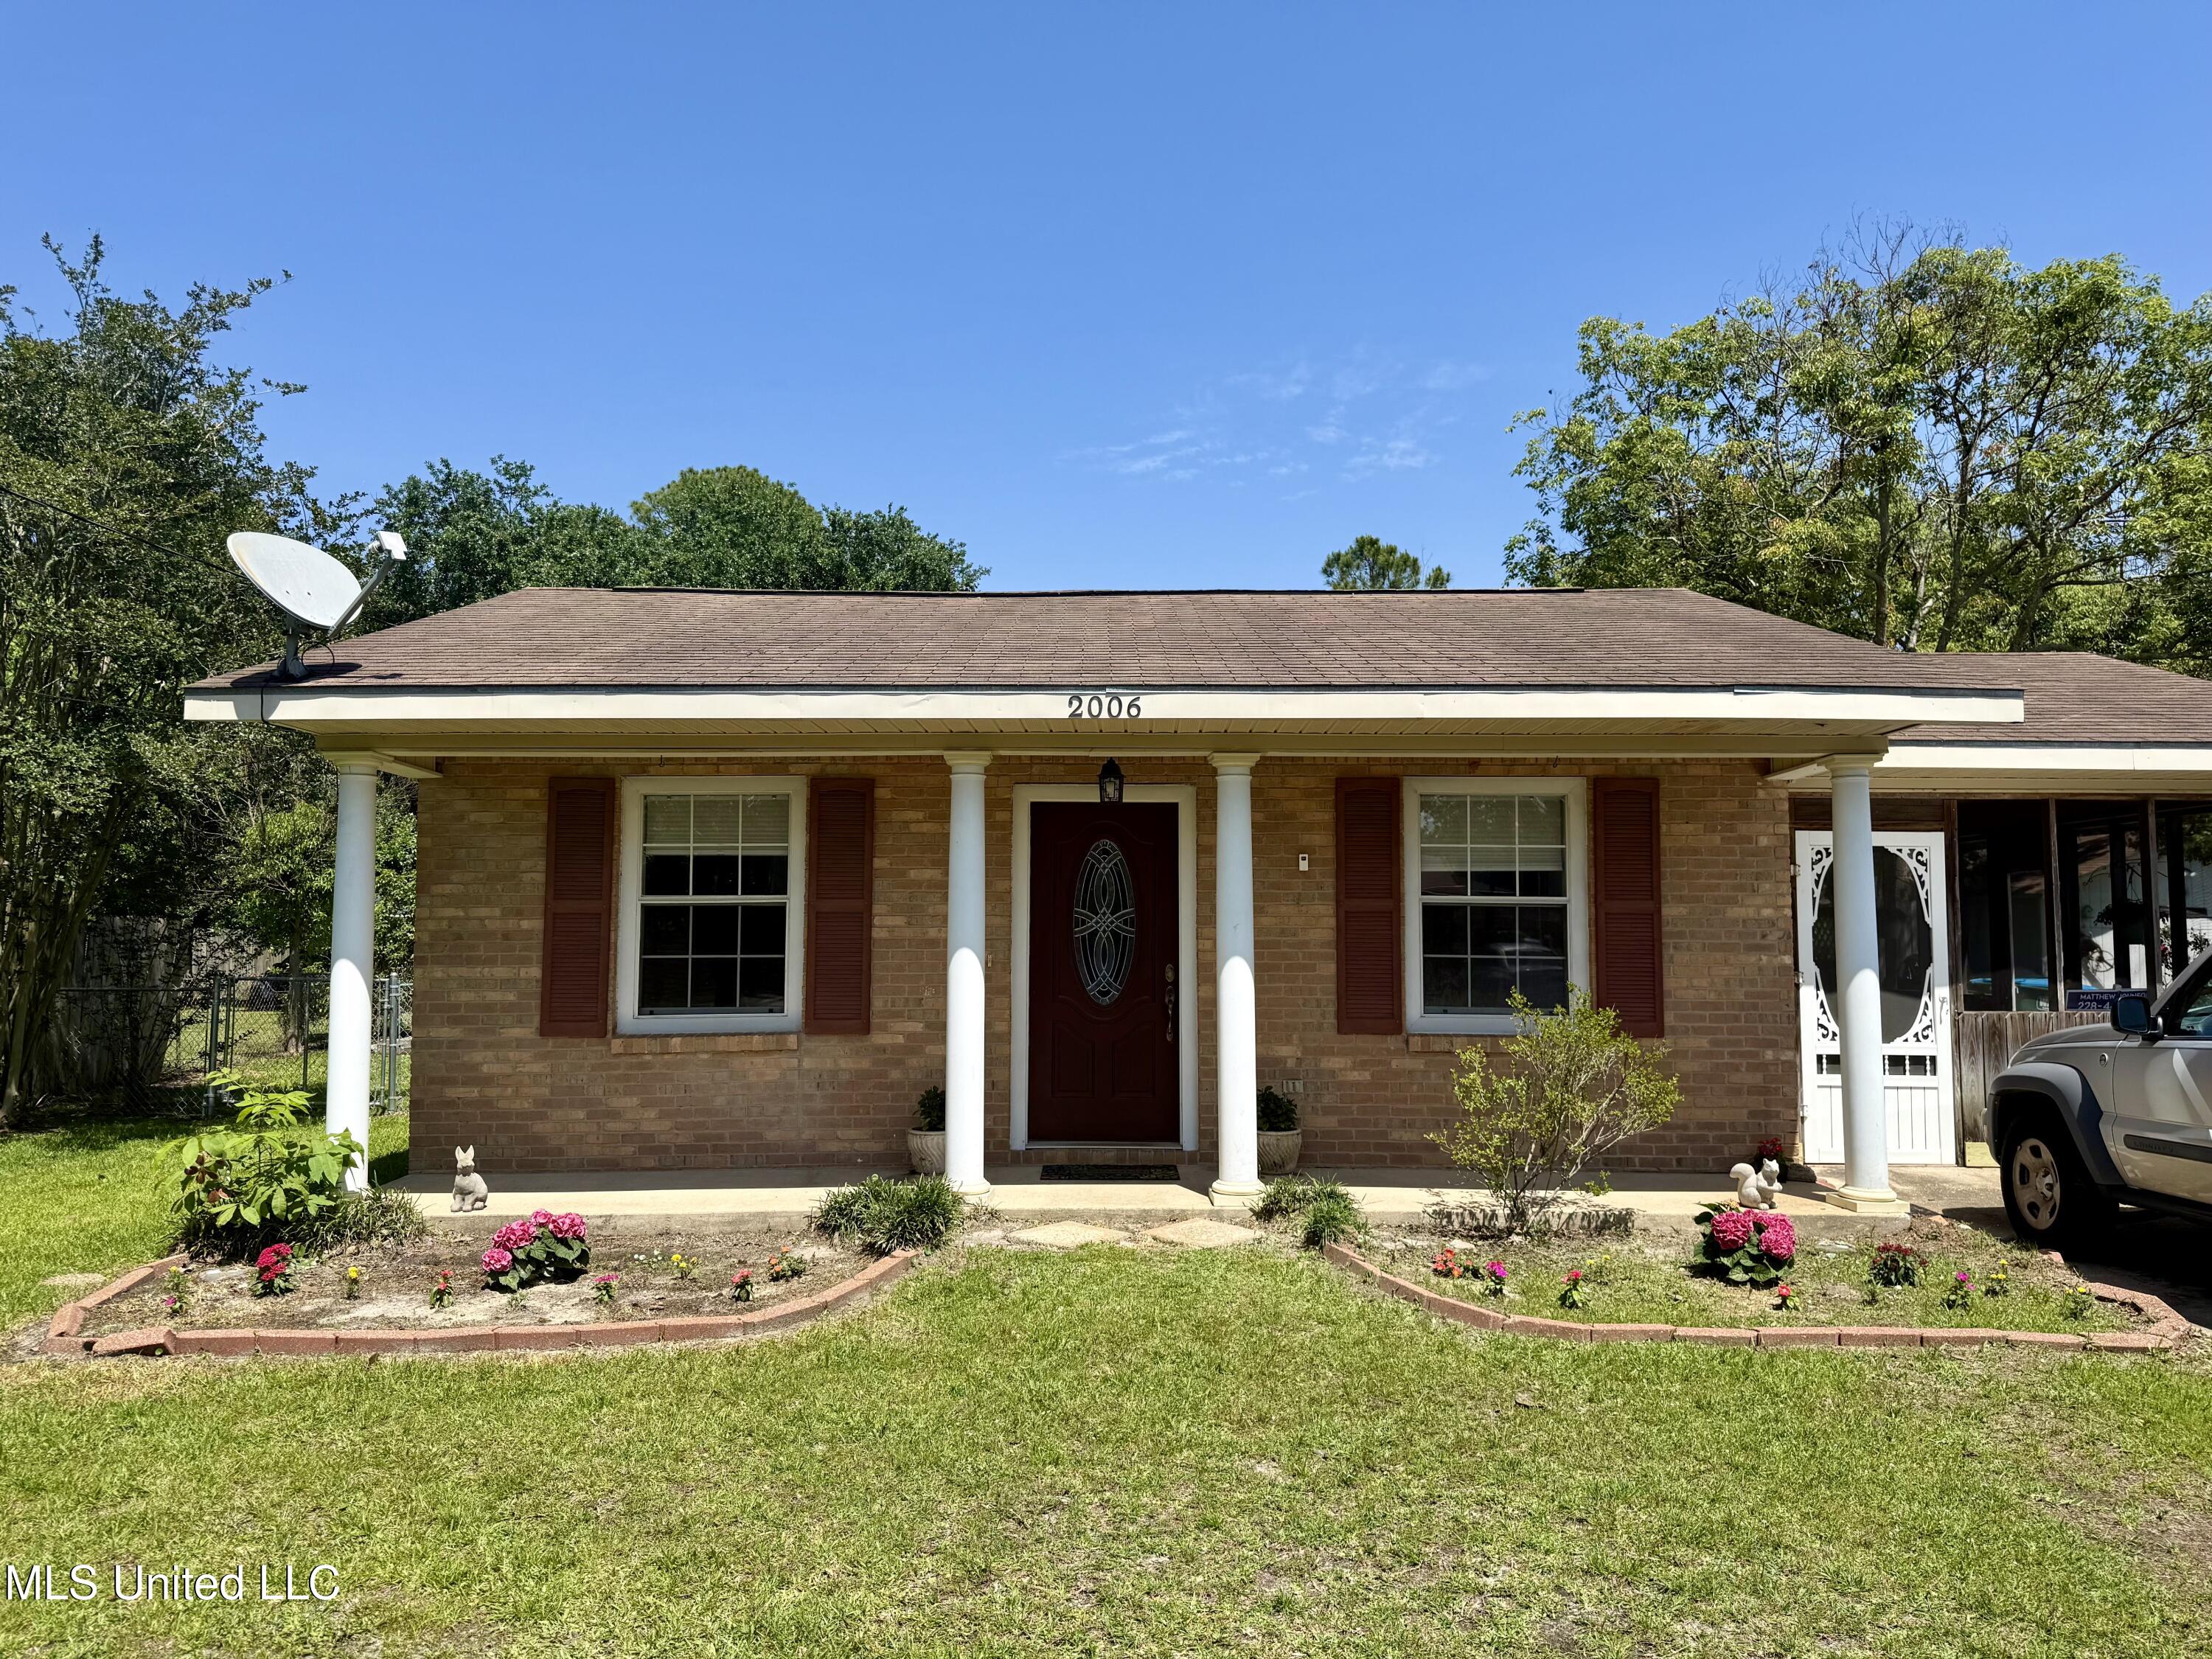
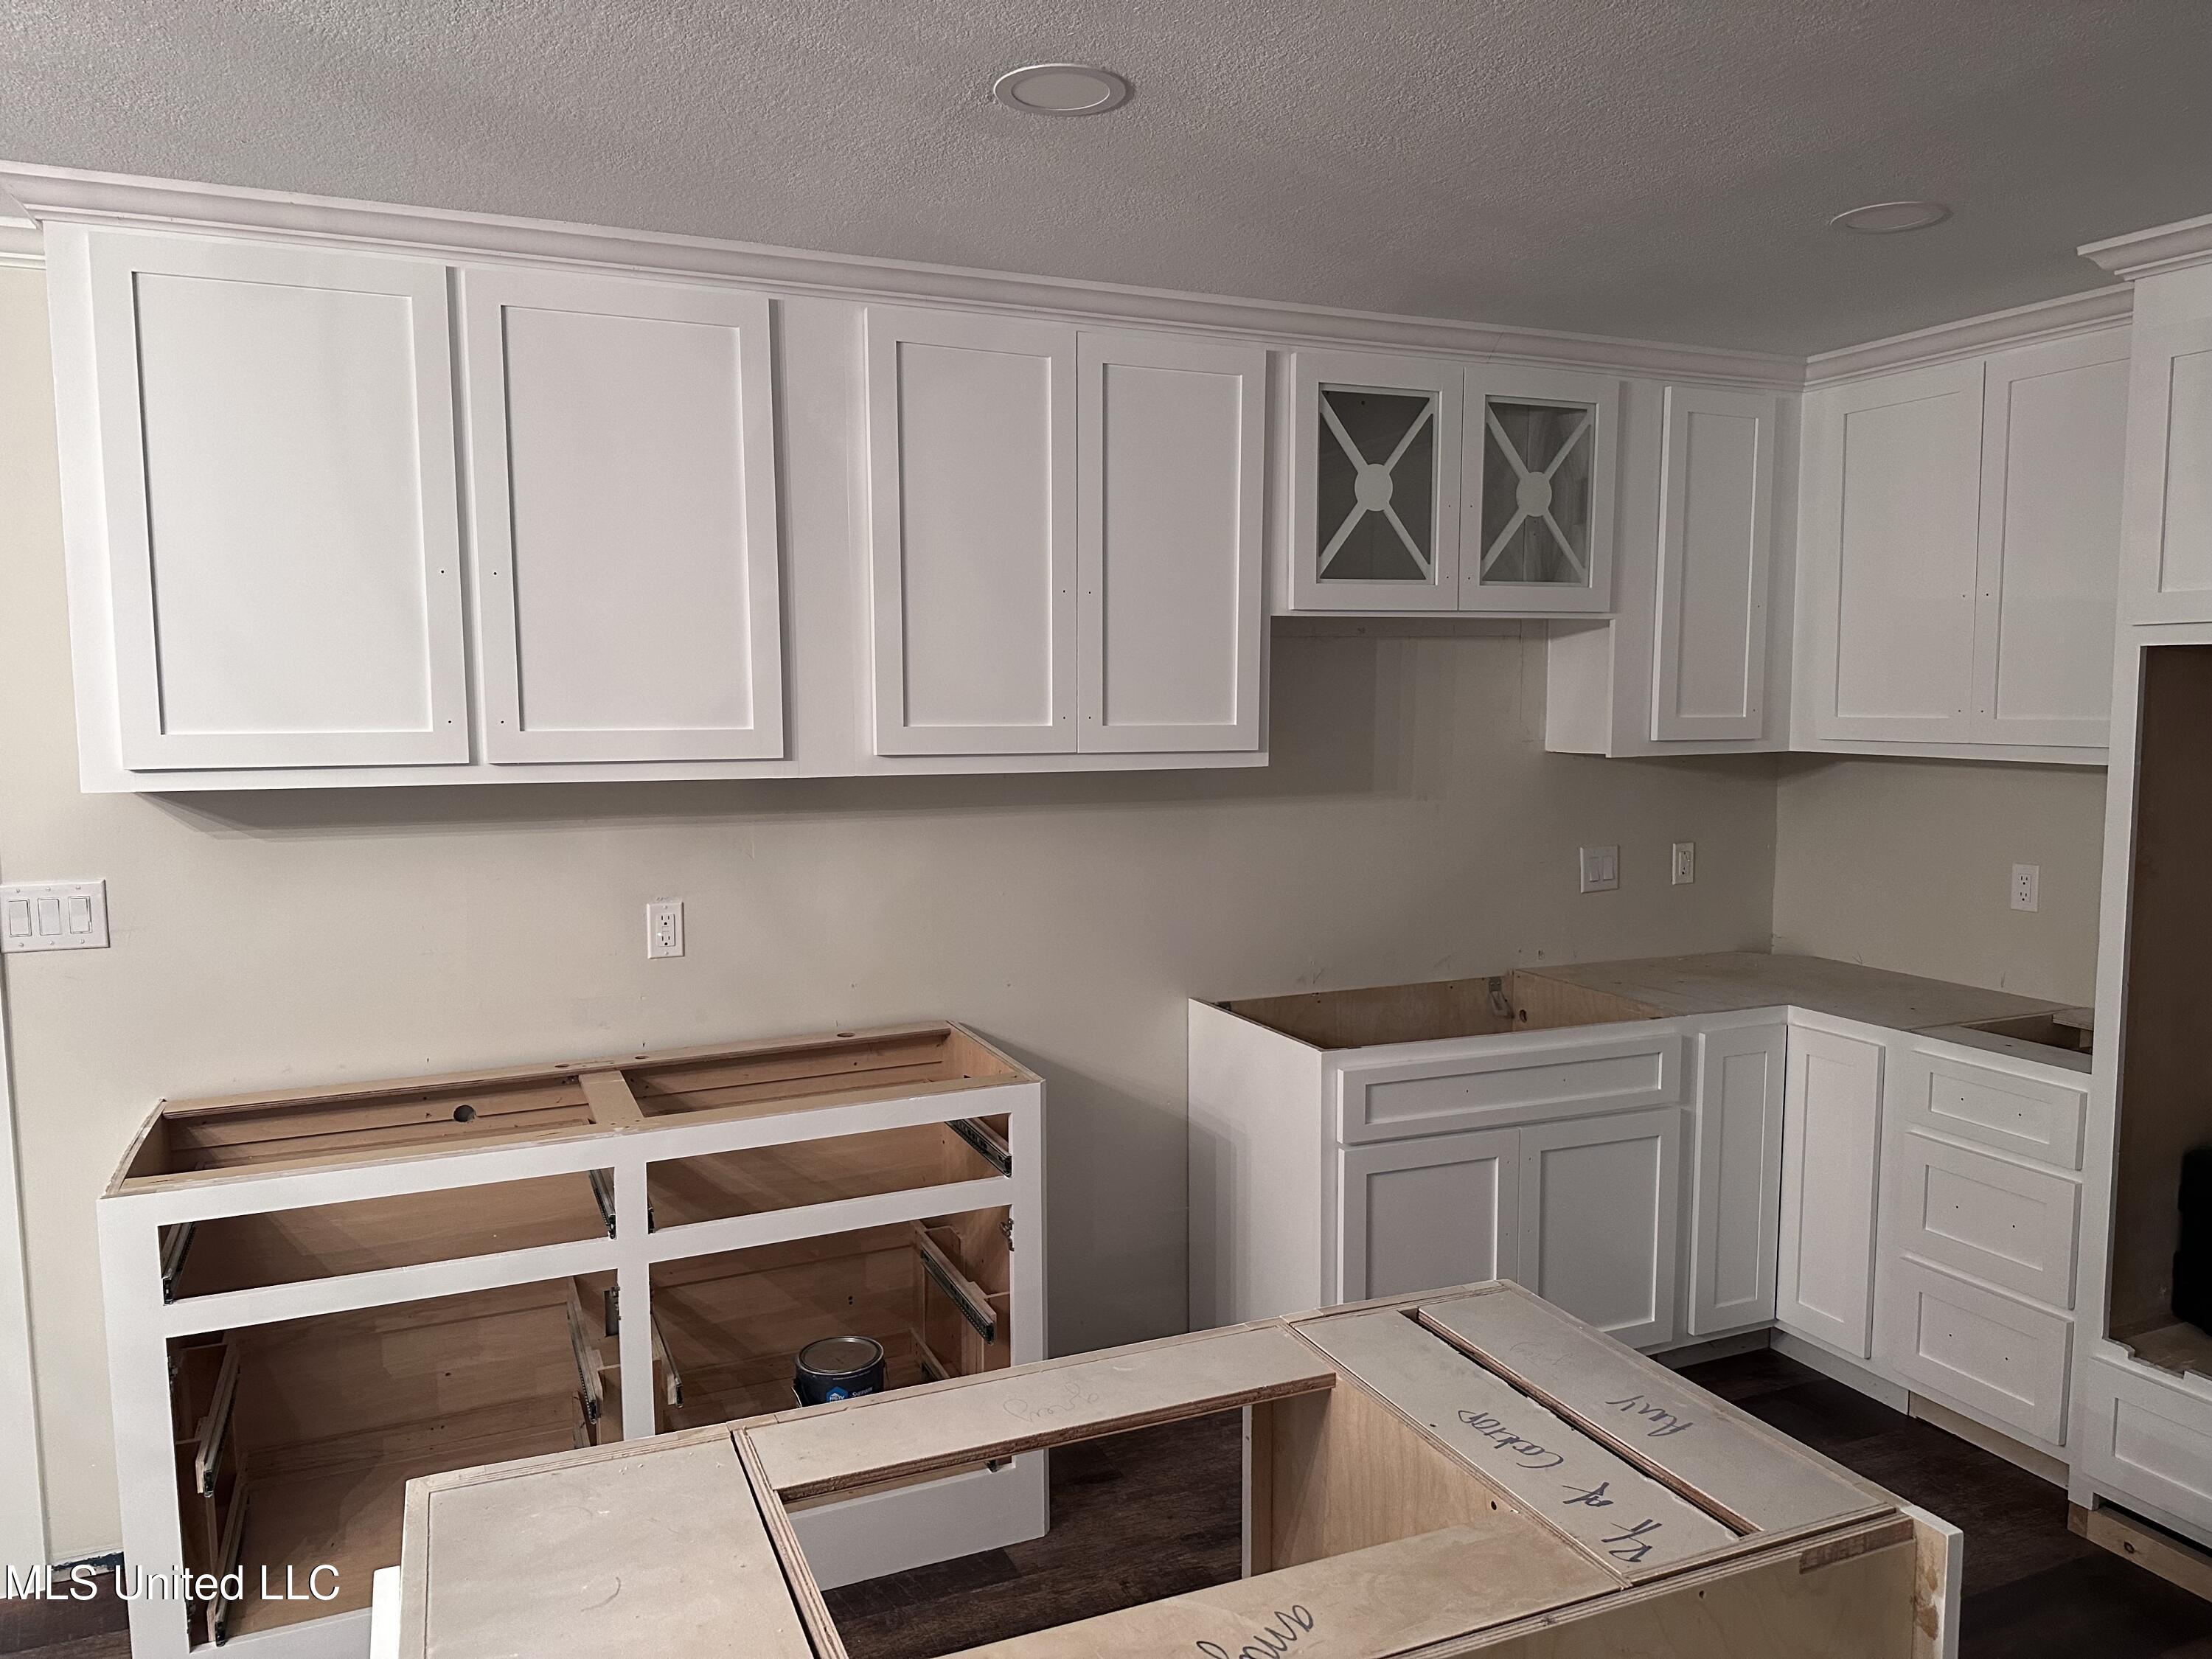
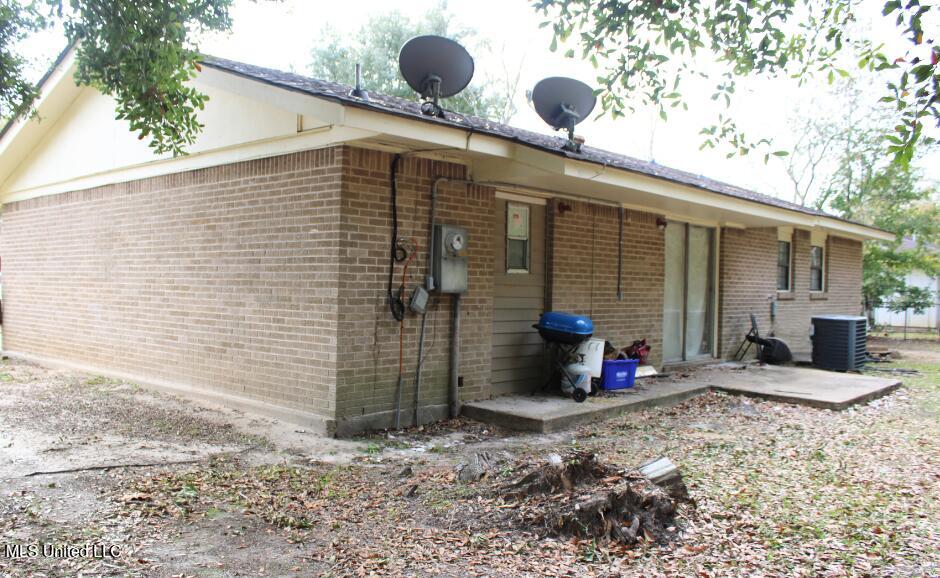
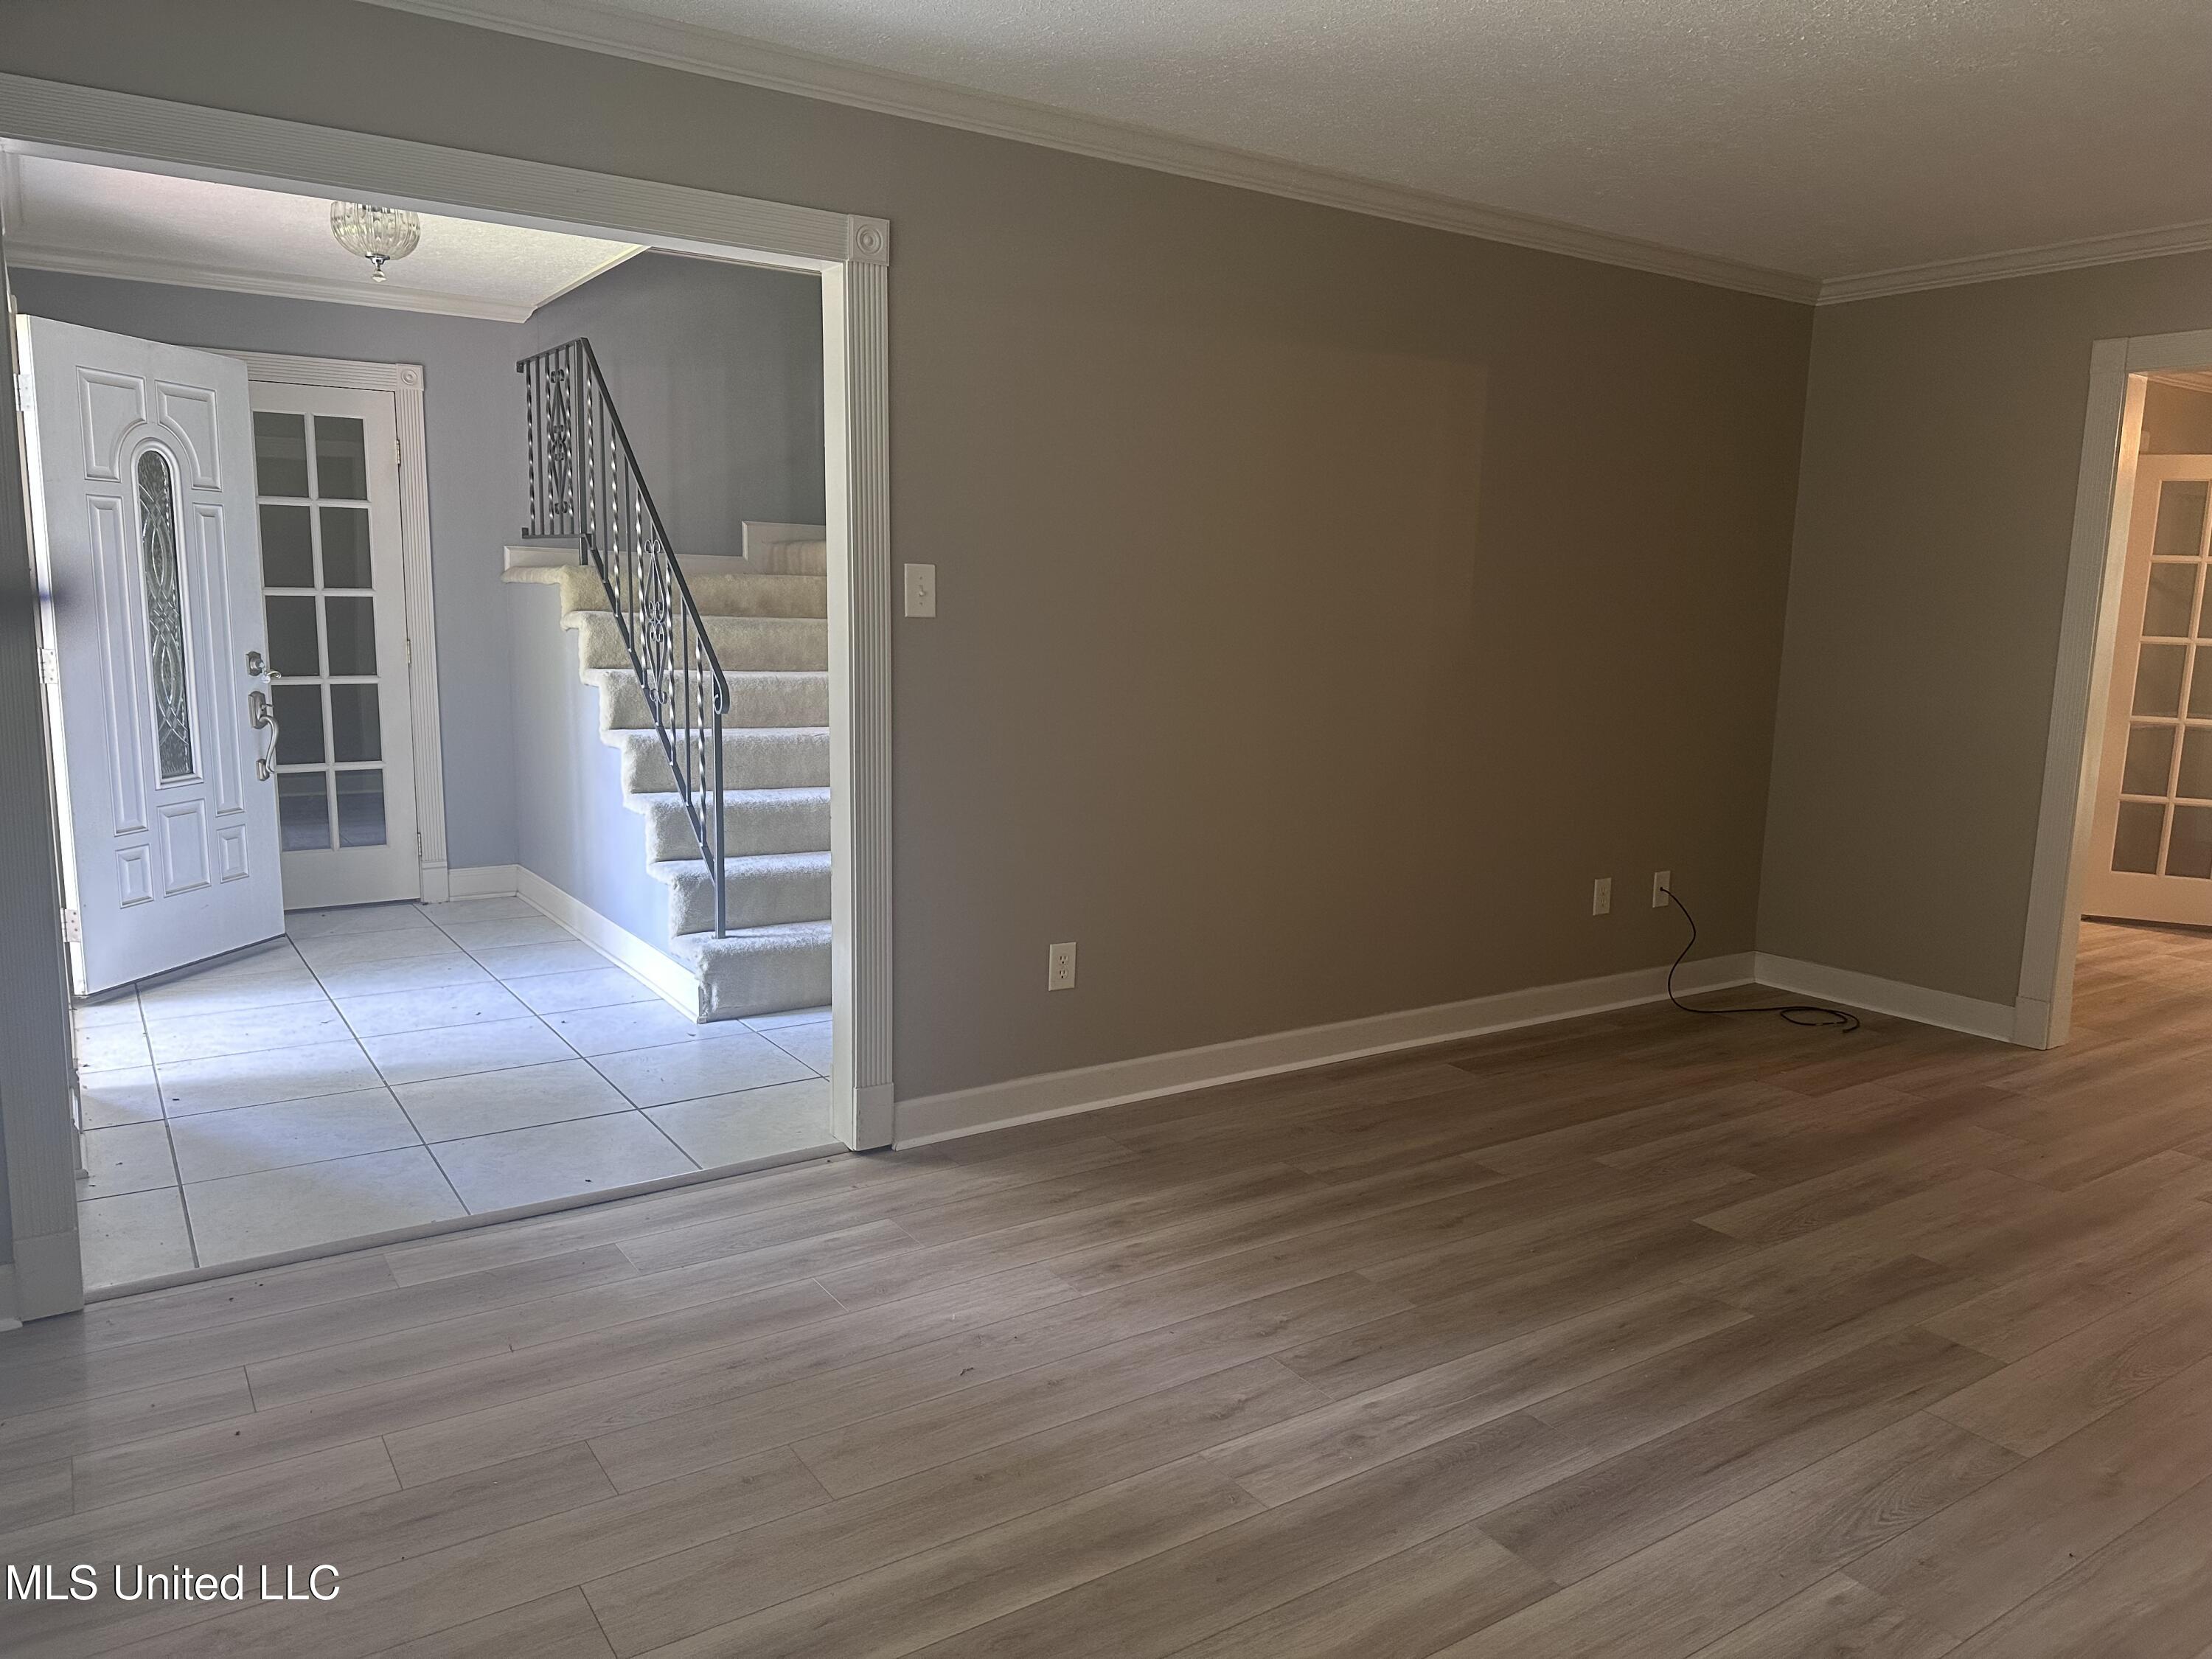
Active
$194,500
3
bds
|
3
ba
|
0
sqft
|
built
1994
2006 Eden St, Pascagoula, MS 39581
$253
Cash flow
6.8%
Cash-on-Cash Return
7.2%
Cap rate
0.9%
Rent to Value Ratio
Active under contract
$325,000
5
bds
|
4
ba
|
0
sqft
|
built
1960
1115 Westwood St, Pascagoula, MS 39567
$-375
Cash flow
-6.0%
Cash-on-Cash Return
4.3%
Cap rate
0.6%
Rent to Value Ratio
Pending
$115,000
3
bds
|
2
ba
|
0
sqft
|
built
1970
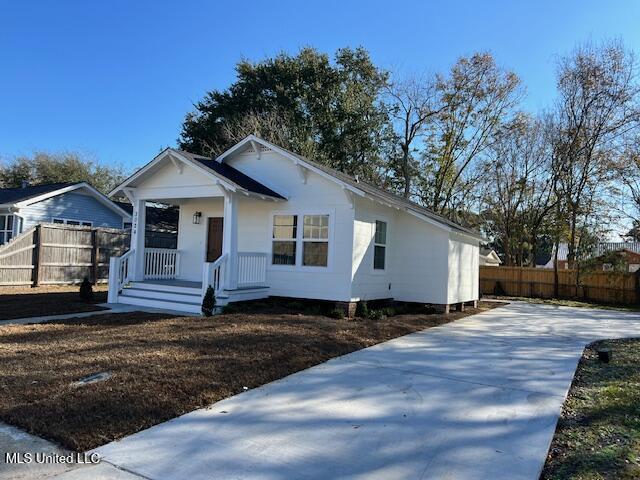
3311 Boston Ave, Pascagoula, MS 39581
$263
Cash flow
11.9%
Cash-on-Cash Return
8.4%
Cap rate
1.1%
Rent to Value Ratio
Active
$349,900
3
bds
|
3
ba
|
0
sqft
|
built
1963
903 Westwood St, Pascagoula, MS 39567
$-244
Cash flow
-3.6%
Cash-on-Cash Return
4.8%
Cap rate
0.7%
Rent to Value Ratio
Active
$134,500
3
bds
|
1
ba
|
0
sqft
|
built
1968
3313 Ronnie Ave, Pascagoula, MS 39581
$152
Cash flow
5.9%
Cash-on-Cash Return
7.0%
Cap rate
0.9%
Rent to Value Ratio
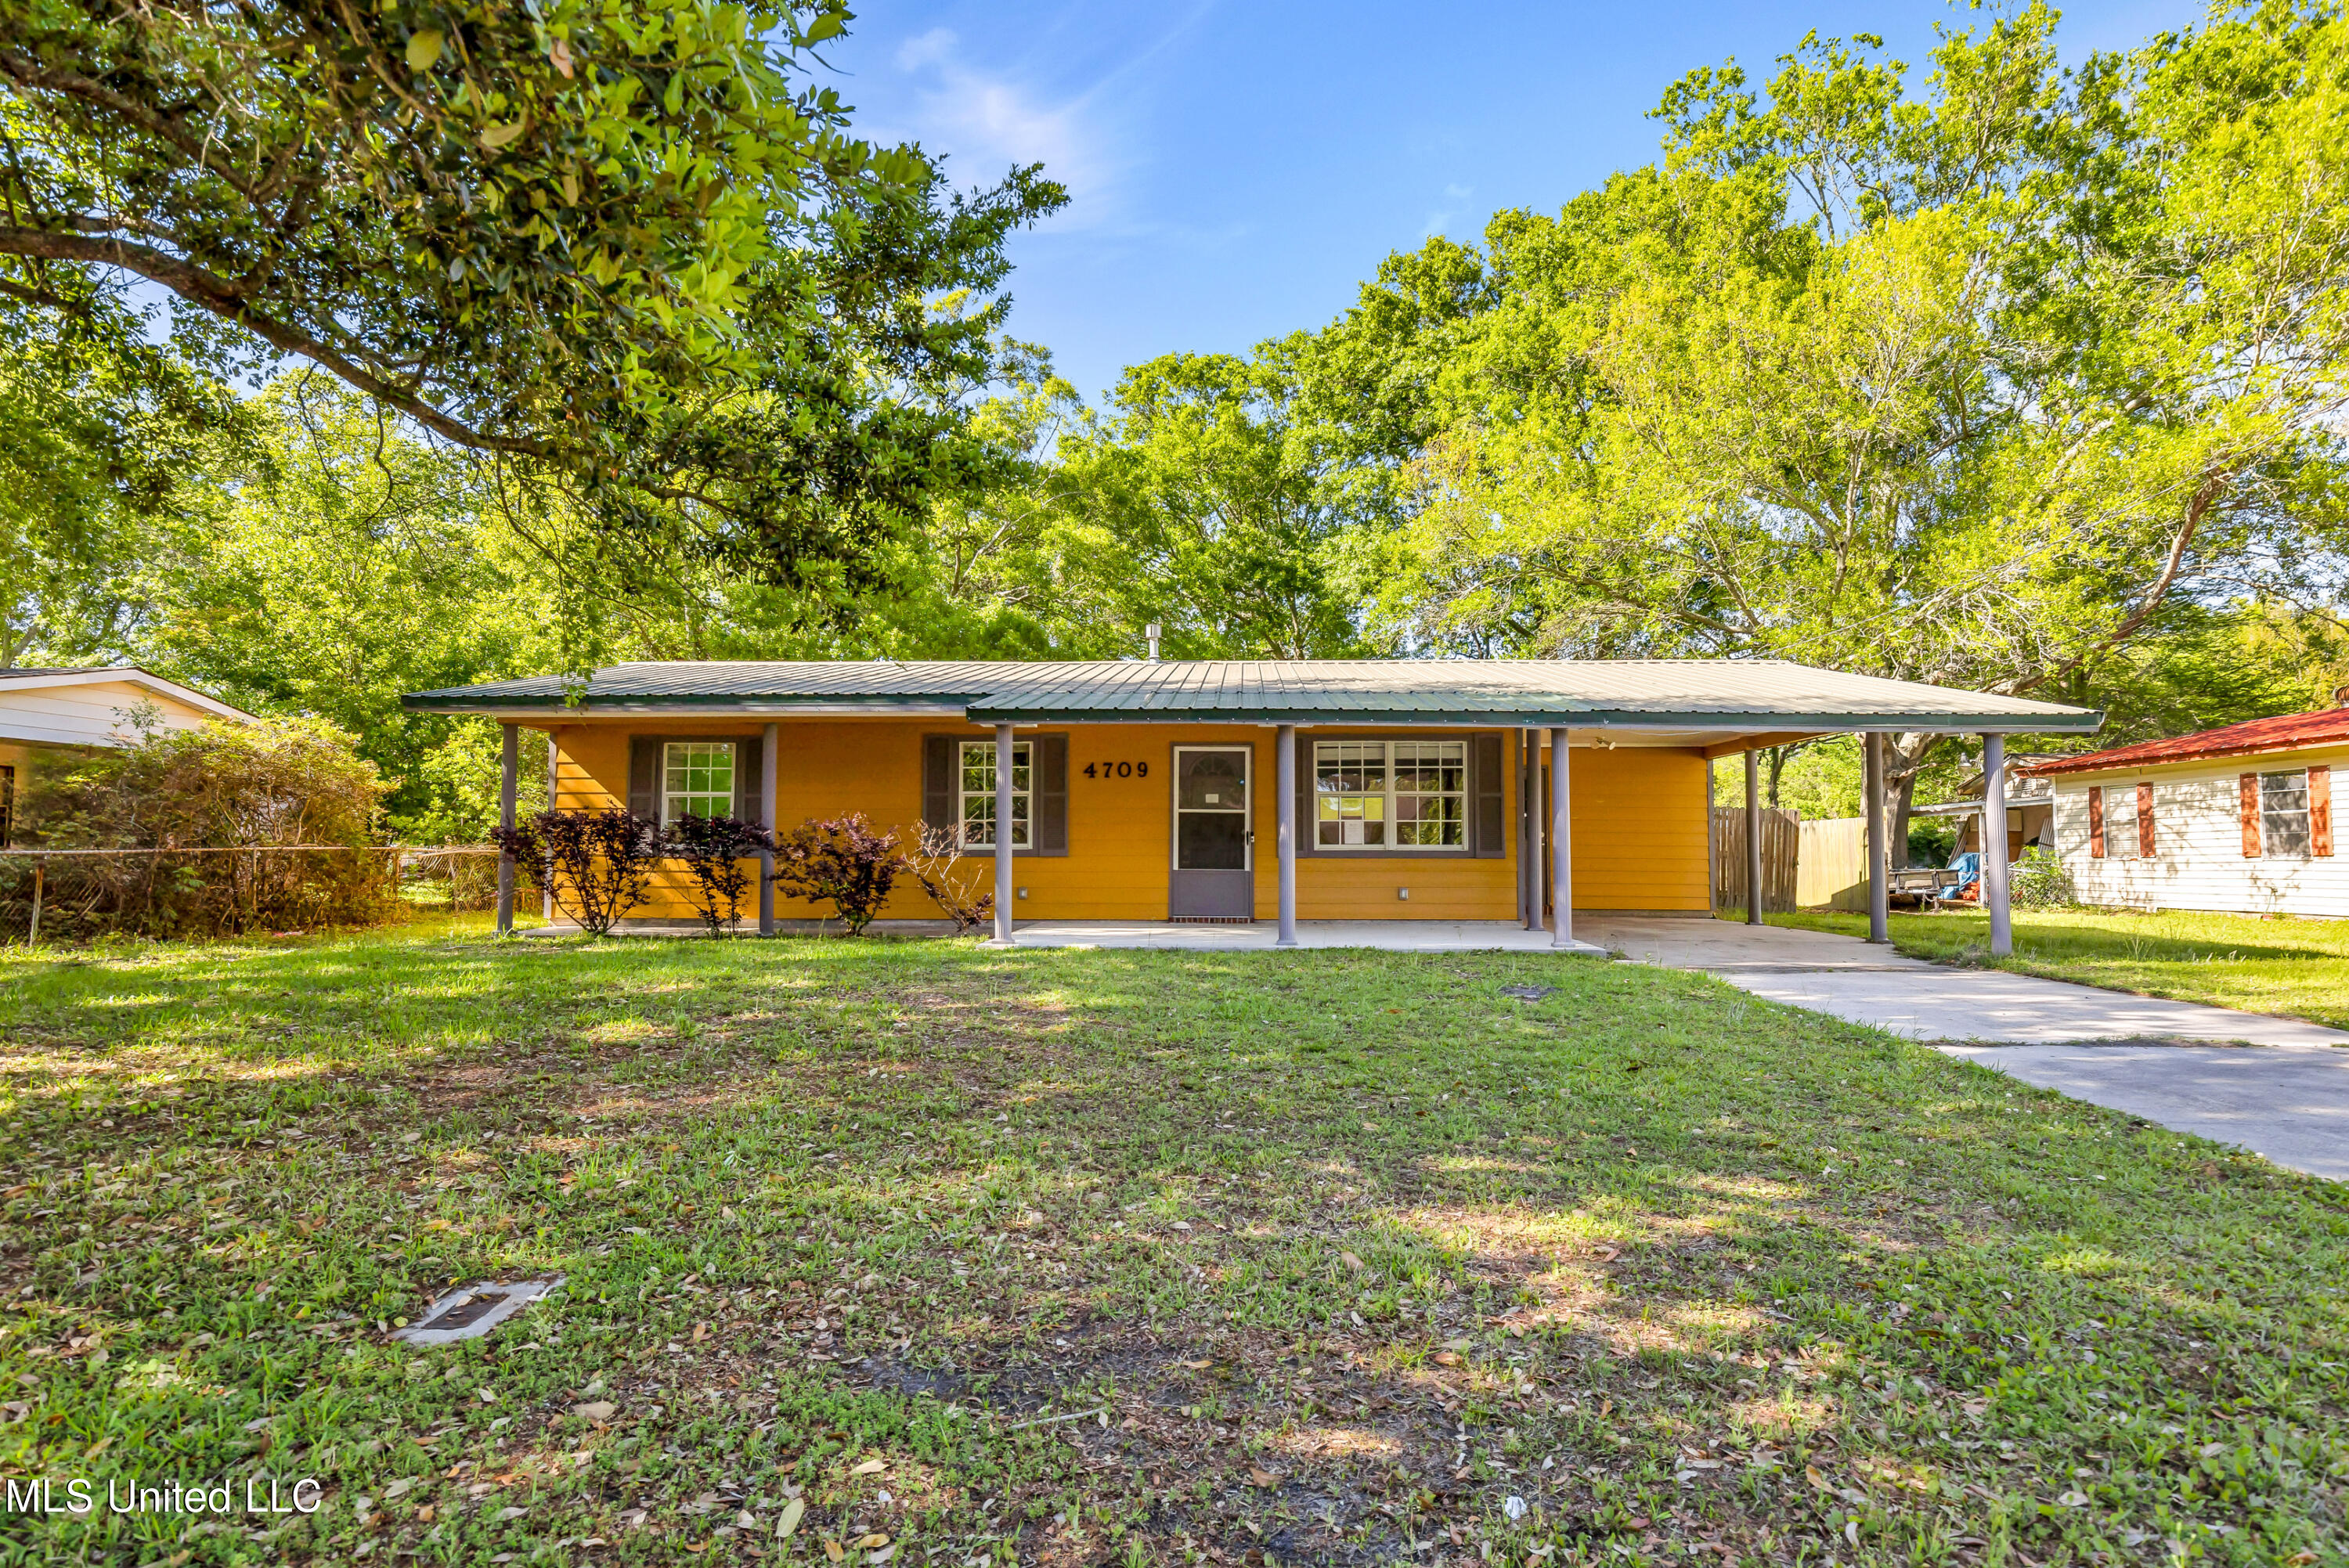
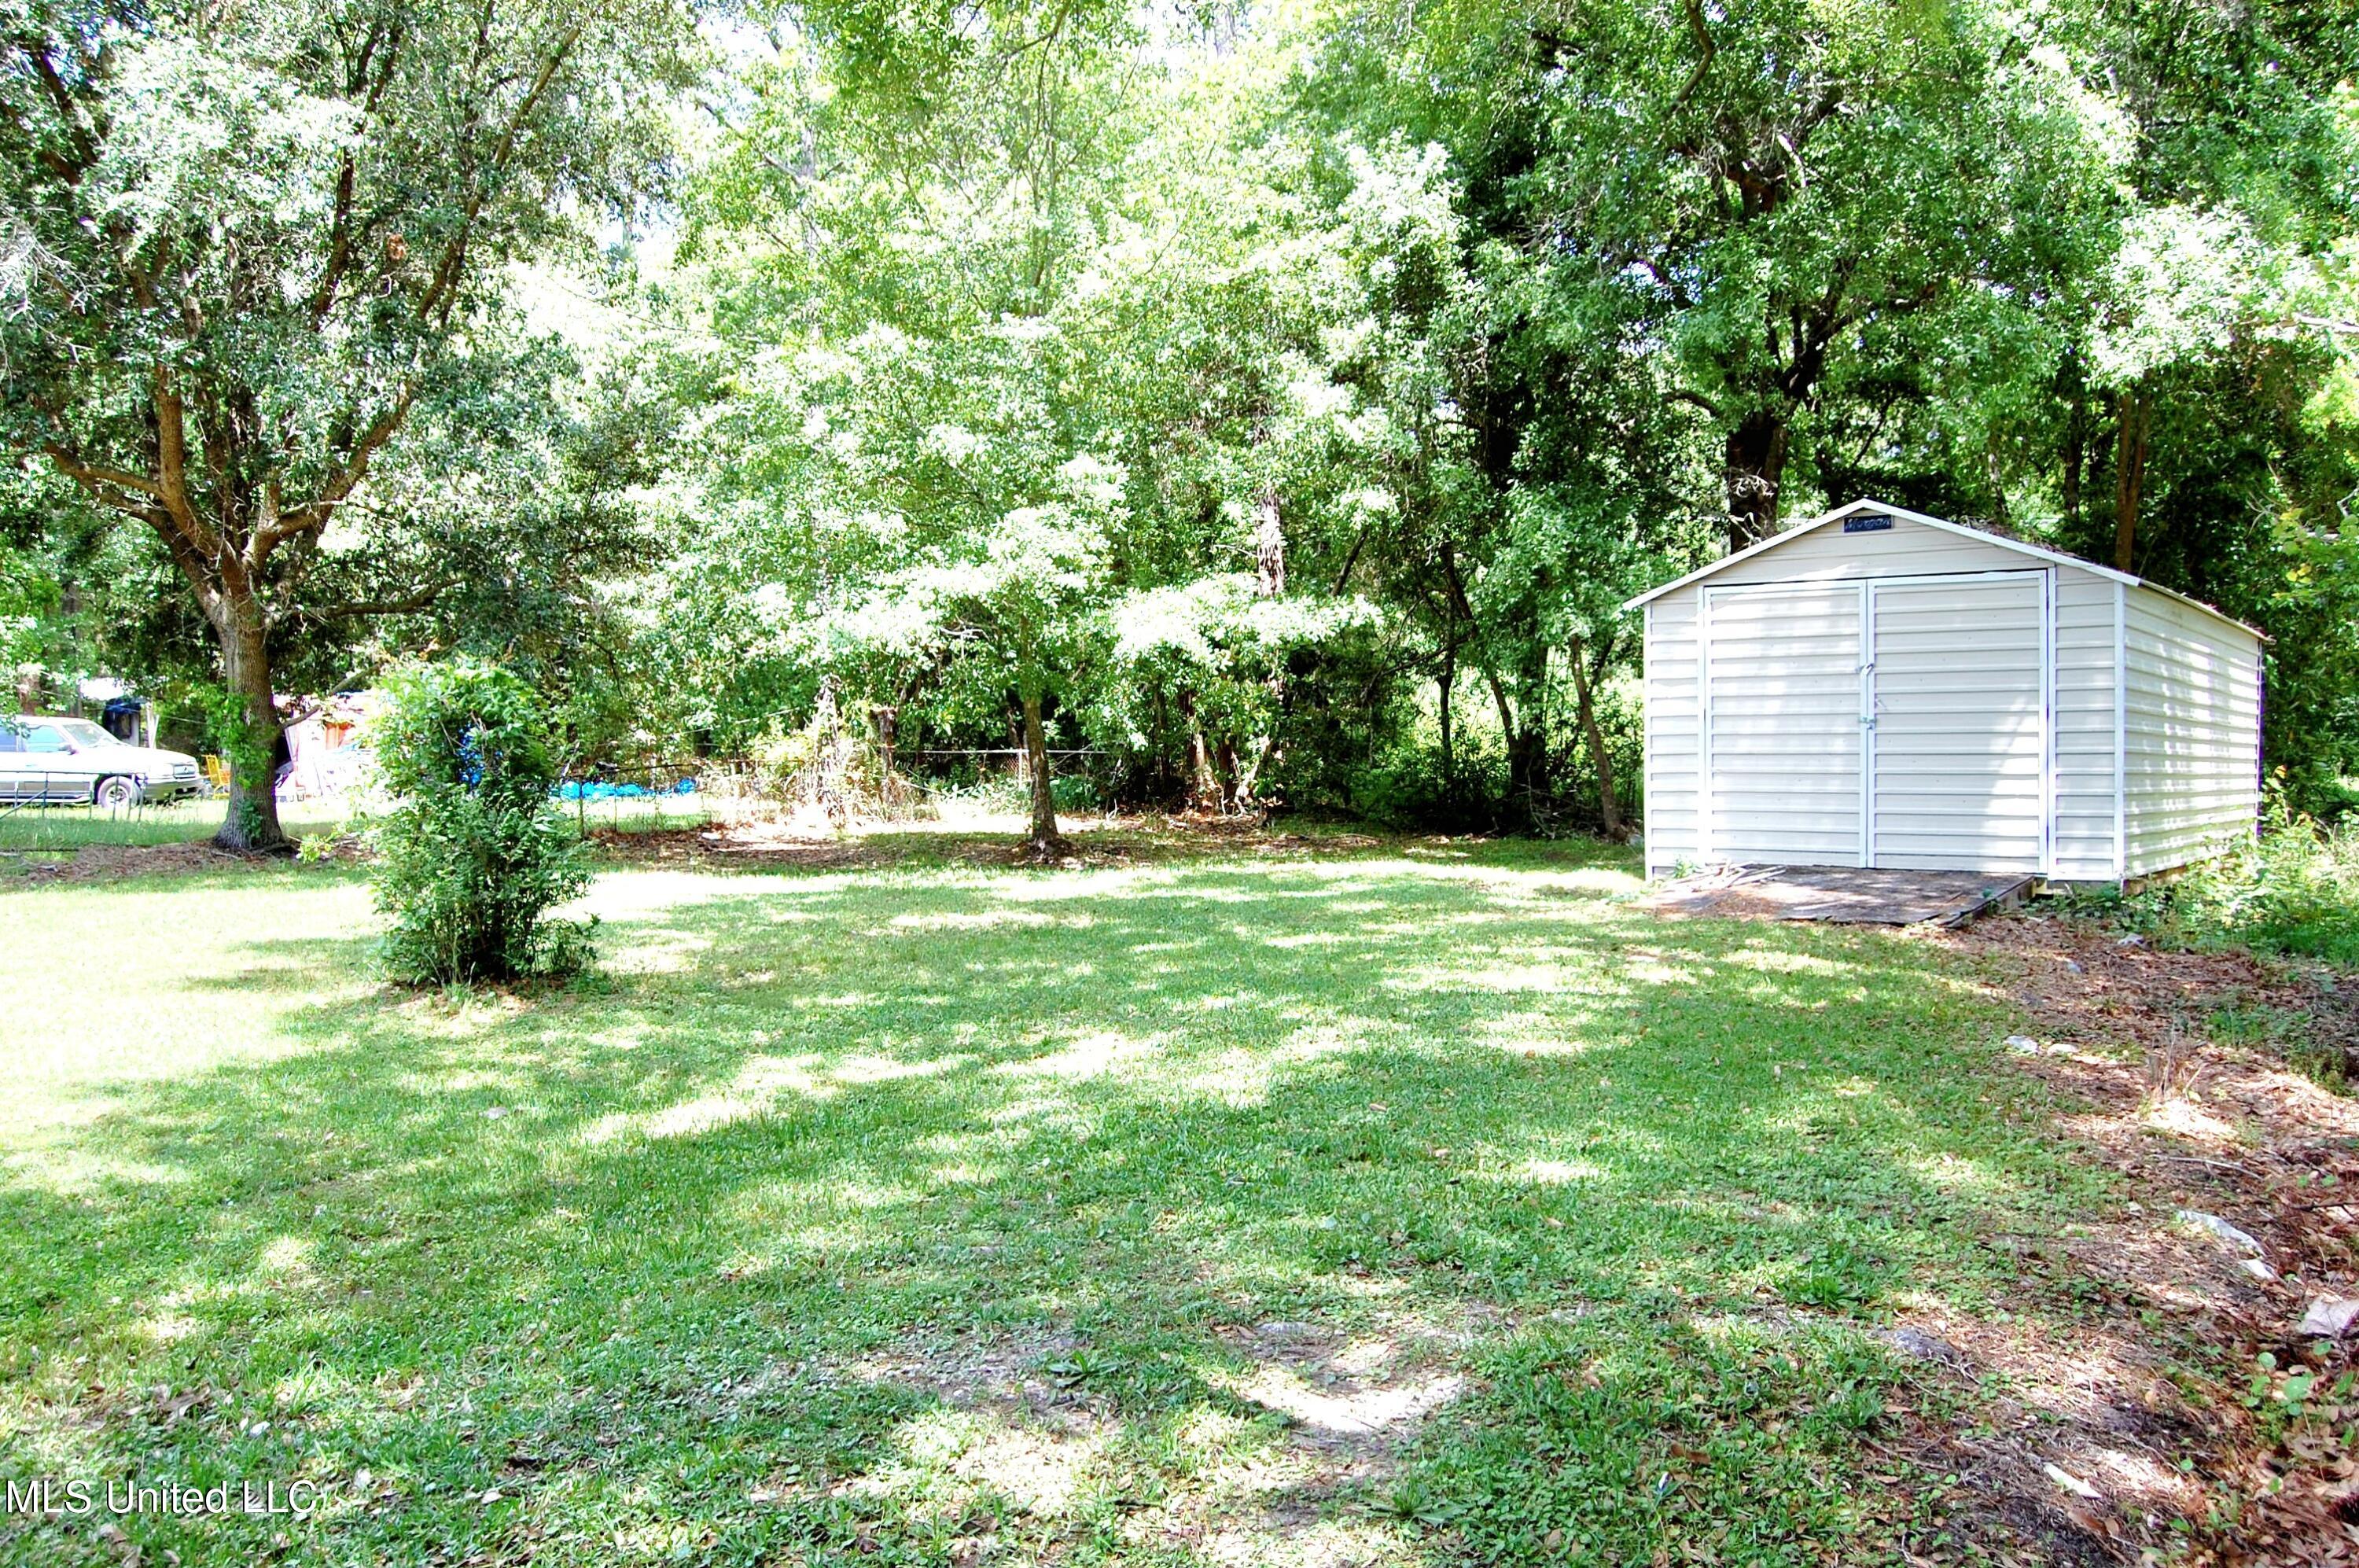
Pending
$129,720
3
bds
|
2
ba
|
0
sqft
|
built
1960
4709 New Hope Ave, Pascagoula, MS 39581
$423
Cash flow
17.0%
Cash-on-Cash Return
9.6%
Cap rate
1.2%
Rent to Value Ratio

Active
$185,500
3
bds
|
2
ba
|
0
sqft
|
built
1954
805 Mantou St, Pascagoula, MS 39567
$206
Cash flow
5.8%
Cash-on-Cash Return
7.0%
Cap rate
0.9%
Rent to Value Ratio

Active
$285,000
4
bds
|
3
ba
|
0
sqft
|
built
1982
1301 Heidenheim Dr, Pascagoula, MS 39581
$376
Cash flow
6.9%
Cash-on-Cash Return
7.3%
Cap rate
0.9%
Rent to Value Ratio

Active
$134,900
3
bds
|
2
ba
|
0
sqft
|
built
1971
3610 Alandale St, Pascagoula, MS 39581
$387
Cash flow
15.0%
Cash-on-Cash Return
9.1%
Cap rate
1.3%
Rent to Value Ratio
Active
$329,900
3
bds
|
3
ba
|
0
sqft
|
built
1997
605 Ford Ave, Pascagoula, MS 39567
$-257
Cash flow
-4.1%
Cash-on-Cash Return
4.7%
Cap rate
0.6%
Rent to Value Ratio
Active
$399,900
5
bds
|
4
ba
|
0
sqft
|
built
1969
712 Eastwood St, Pascagoula, MS 39567
$-325
Cash flow
-4.2%
Cash-on-Cash Return
4.7%
Cap rate
0.6%
Rent to Value Ratio
Active
$260,000
3
bds
|
4
ba
|
0
sqft
|
built
2006
4510 Washington Ave, Pascagoula, MS 39581
$-18
Cash flow
-0.4%
Cash-on-Cash Return
5.6%
Cap rate
0.8%
Rent to Value Ratio
Active
$94,700
3
bds
|
2
ba
|
0
sqft
|
built
1940
1106 Resca De La Palma St, Pascagoula, MS 39567
$524
Cash flow
28.9%
Cash-on-Cash Return
12.3%
Cap rate
1.7%
Rent to Value Ratio

Active
$135,000
3
bds
|
2
ba
|
0
sqft
|
built
1971
4813 King James Dr, Pascagoula, MS 39581
$273
Cash flow
10.6%
Cash-on-Cash Return
8.1%
Cap rate
1.0%
Rent to Value Ratio
Pending
$299,000
4
bds
|
3
ba
|
0
sqft
|
built
1904
1003 Grant Ave, Pascagoula, MS 39567
$61
Cash flow
1.1%
Cash-on-Cash Return
5.9%
Cap rate
0.9%
Rent to Value Ratio

Active
$699,000
4
bds
|
3
ba
|
0
sqft
|
built
1999
2112 Washington Ave, Pascagoula, MS 39567
$-1,169
Cash flow
-8.7%
Cash-on-Cash Return
3.7%
Cap rate
0.5%
Rent to Value Ratio
Pending
$131,900
4
bds
|
2
ba
|
0
sqft
|
built
1973
3105 Scovel Ave, Pascagoula, MS 39581
$240
Cash flow
9.5%
Cash-on-Cash Return
7.9%
Cap rate
1.1%
Rent to Value Ratio

Active
$135,000
3
bds
|
2
ba
|
0
sqft
|
built
1963
2714 Clairmont Ave, Pascagoula, MS 39567
$333
Cash flow
12.9%
Cash-on-Cash Return
8.6%
Cap rate
1.2%
Rent to Value Ratio
Active
$110,000
3
bds
|
2
ba
|
0
sqft
|
built
1940
2110 Cleveland Ave, Pascagoula, MS 39567
$317
Cash flow
15.0%
Cash-on-Cash Return
9.1%
Cap rate
1.3%
Rent to Value Ratio
Active
$659,900
5
bds
|
6
ba
|
0
sqft
|
built
1995
614 Grand Oaks Dr, Pascagoula, MS 39567
$-1,291
Cash flow
-10.2%
Cash-on-Cash Return
3.3%
Cap rate
0.5%
Rent to Value Ratio
Active
$350,000
3
bds
|
2
ba
|
0
sqft
|
built
1957
1112 Pascagoula St, Pascagoula, MS 39567
$-209
Cash flow
-3.1%
Cash-on-Cash Return
5.0%
Cap rate
0.7%
Rent to Value Ratio
Active
$172,950
2
bds
|
1
ba
|
0
sqft
|
built
1920
3024 Frederic St, Pascagoula, MS 39567
$203
Cash flow
6.1%
Cash-on-Cash Return
7.1%
Cap rate
0.9%
Rent to Value Ratio

Active
$264,999
3
bds
|
3
ba
|
0
sqft
|
built
2001
3510 Bramblewood Cir, Pascagoula, MS 39581
$261
Cash flow
5.1%
Cash-on-Cash Return
6.9%
Cap rate
0.9%
Rent to Value Ratio
Active
$625,000
3
bds
|
4
ba
|
0
sqft
|
built
2010
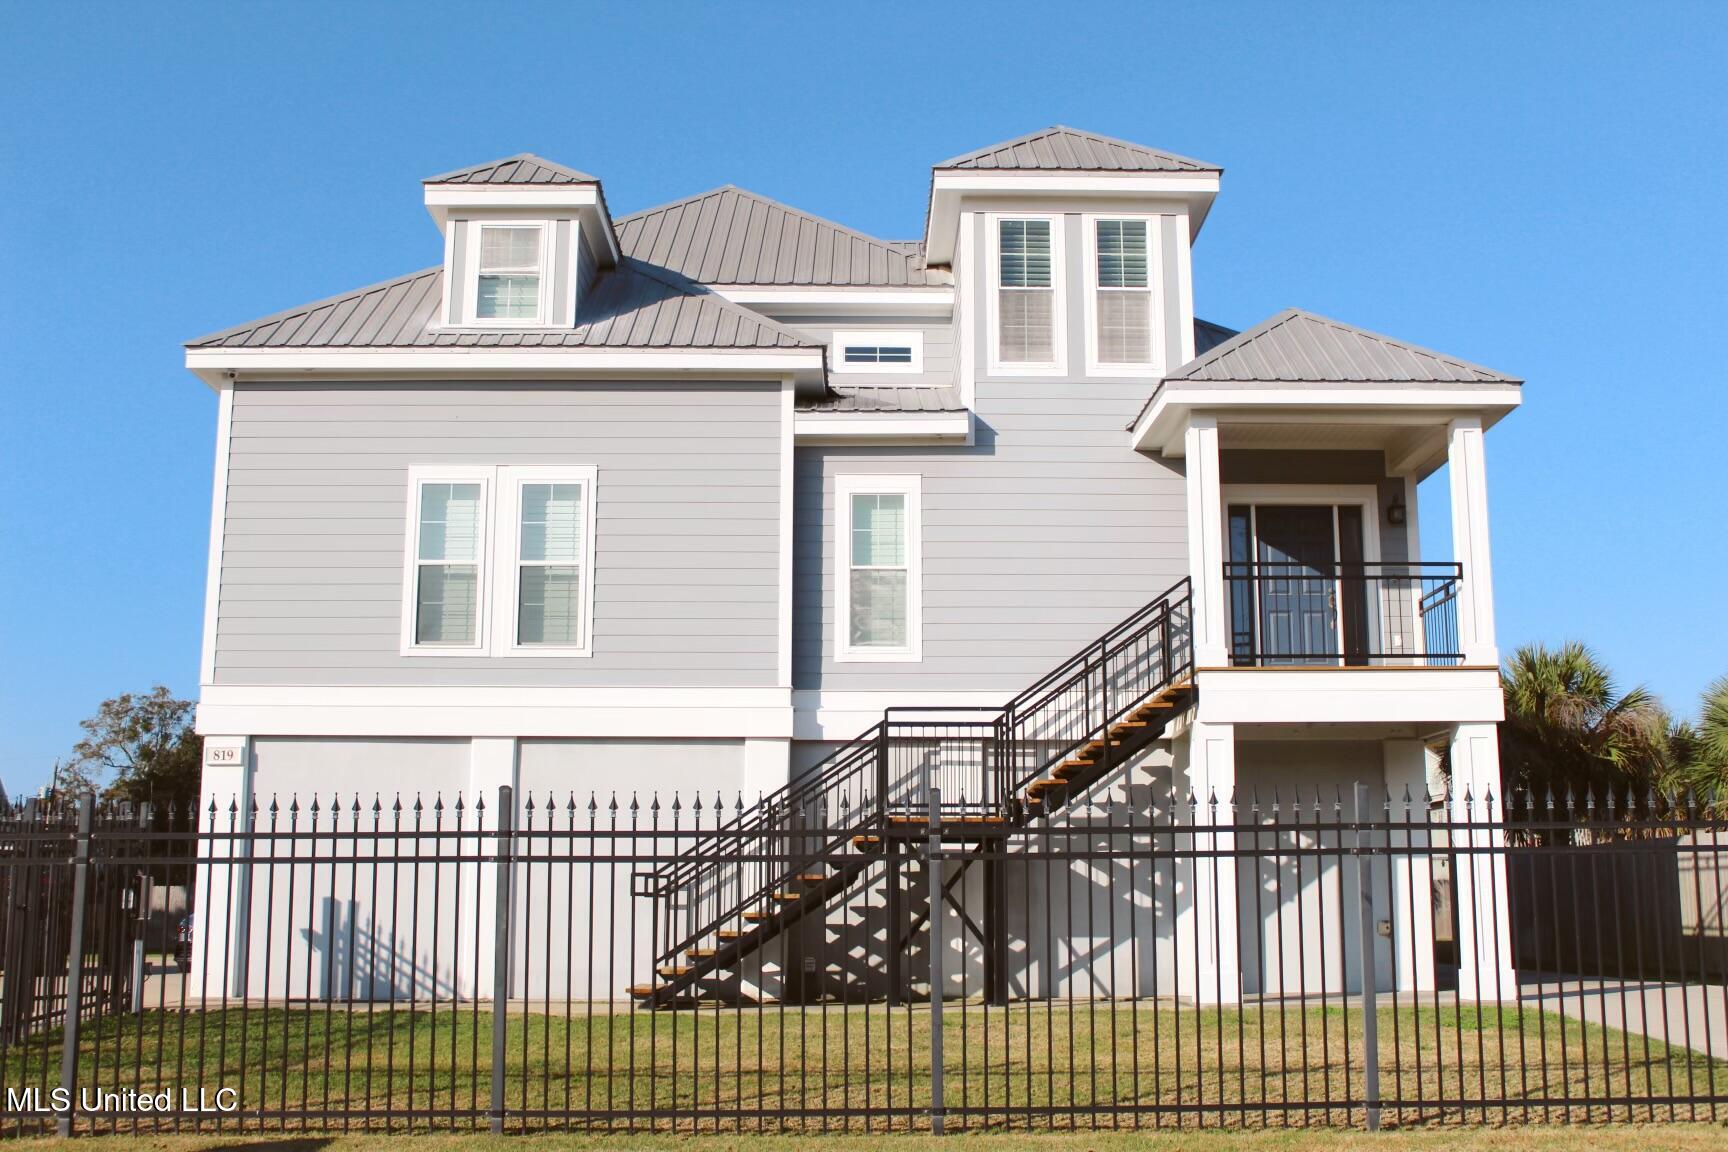
819 Country Club Dr, Pascagoula, MS 39567
$-643
Cash flow
-5.4%
Cash-on-Cash Return
4.4%
Cap rate
0.6%
Rent to Value Ratio
Active
$253,990
3
bds
|
2
ba
|
0
sqft
|
built
1968
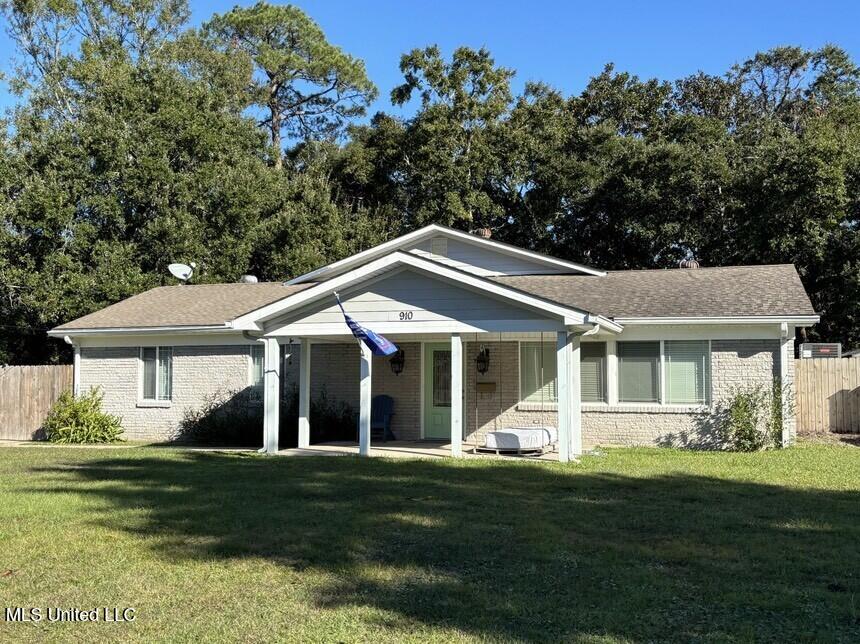
910 Williams St, Pascagoula, MS 39567
$392
Cash flow
8.1%
Cash-on-Cash Return
7.5%
Cap rate
1.0%
Rent to Value Ratio