Pascagoula, MS Investment Properties for Sale
Browse homes for sale and investment properties in Pascagoula, MS. Refine your search by price, property type, or more.
Best cash flowing properties in Pascagoula, MS
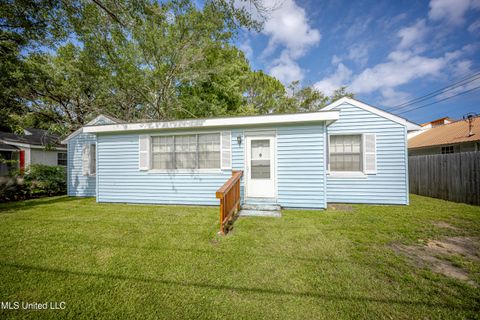
Active
$72,000
1
bds
|
1
ba
|
0
sqft
|
built
1965
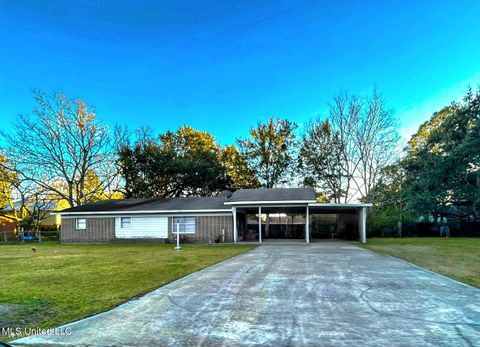
3310 Washington Ave, Pascagoula, MS 39581
$807
Cash flow
13.1%
Cash-on-Cash Return
13.5%
Cap rate
1.8%
Rent to Value Ratio
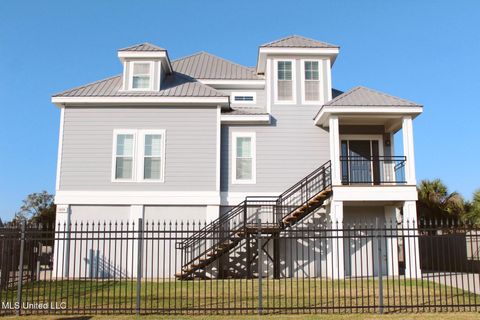
Active
$119,900
3
bds
|
2
ba
|
0
sqft
|
built
1966
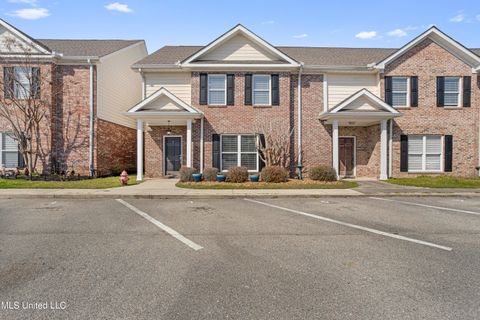
1717 Cherokee St, Pascagoula, MS 39581
$537
Cash flow
23.4%
Cash-on-Cash Return
11.0%
Cap rate
1.3%
Rent to Value Ratio
44 out of 45 properties for sale in Pascagoula, MS
Limited Results Shown
Create a free account, or log in to reveal all property listings and enjoy the complete experience.
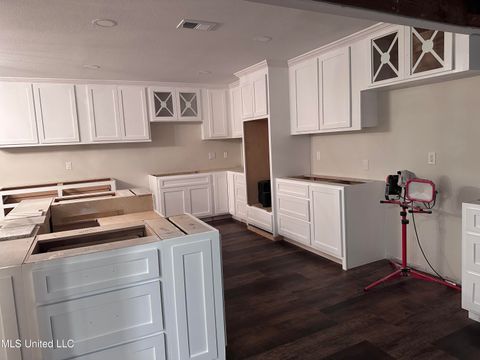
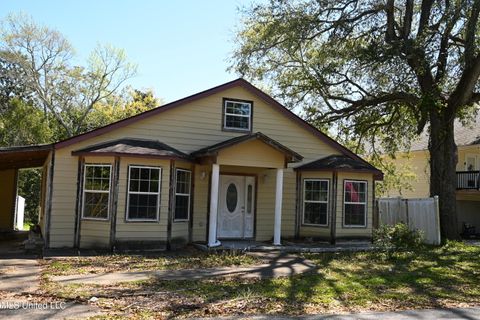
Active
$169,500
3
bds
|
2
ba
|
0
sqft
|
built
1949
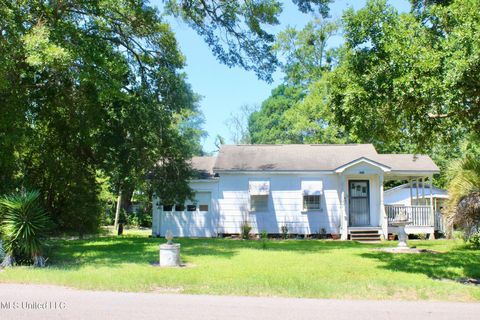
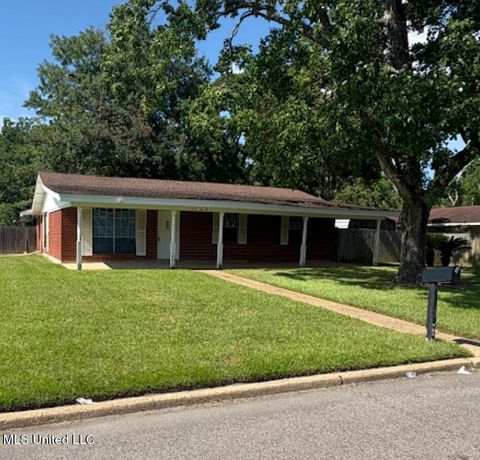
1219 Polk Ave, Pascagoula, MS 39567
$94
Cash flow
2.9%
Cash-on-Cash Return
6.3%
Cap rate
0.9%
Rent to Value Ratio
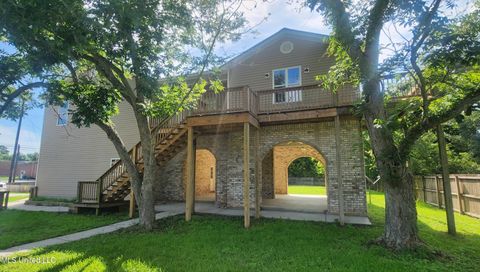
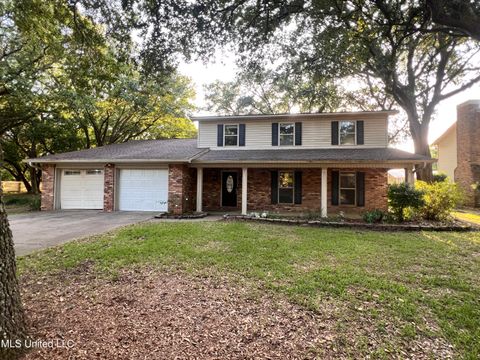
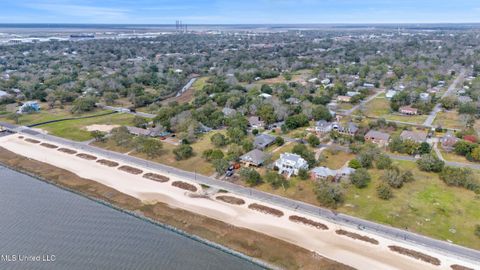
Active
$210,000
3
bds
|
3
ba
|
0
sqft
|
built
1978
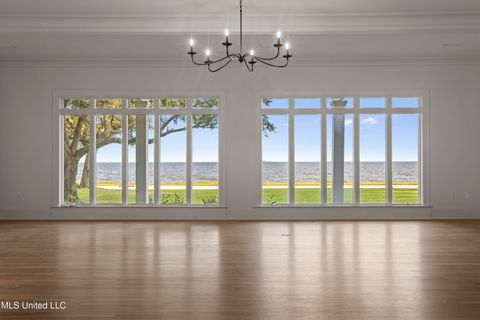
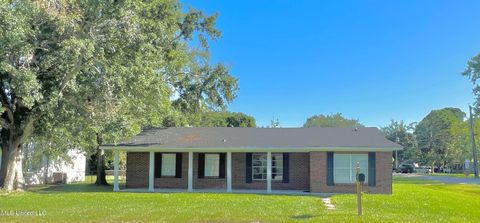
3900 Quinn Dr, Pascagoula, MS 39581
$203
Cash flow
5.0%
Cash-on-Cash Return
6.8%
Cap rate
0.9%
Rent to Value Ratio
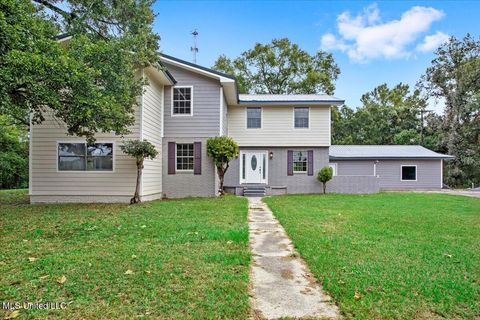
Active
$220,000
4
bds
|
2
ba
|
0
sqft
|
built
1914
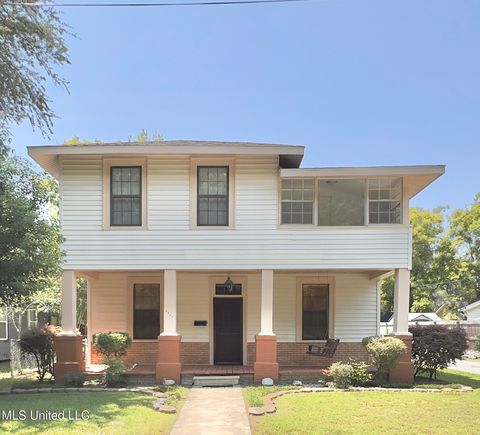
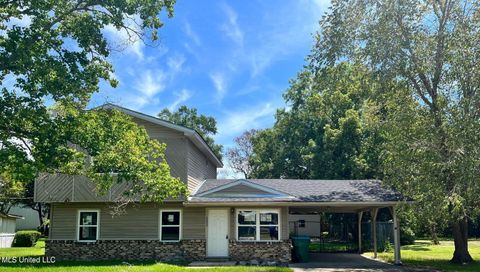
1603 Roosevelt St, Pascagoula, MS 39567
$317
Cash flow
7.5%
Cash-on-Cash Return
7.4%
Cap rate
0.9%
Rent to Value Ratio
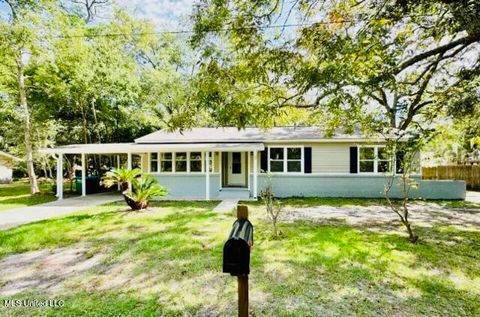
Active
$100,000
3
bds
|
2
ba
|
0
sqft
|
built
1958
1103 Kell Ave, Pascagoula, MS 39567
$385
Cash flow
20.1%
Cash-on-Cash Return
10.3%
Cap rate
1.4%
Rent to Value Ratio
Active
$399,900
5
bds
|
4
ba
|
0
sqft
|
built
1969
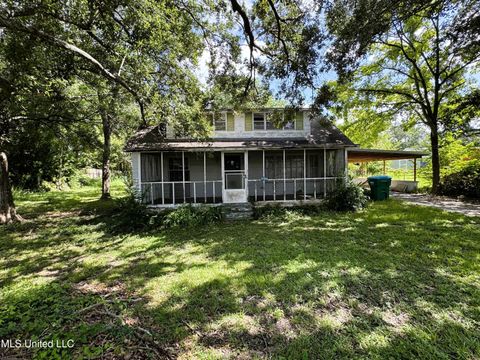
712 Eastwood St, Pascagoula, MS 39567
$-325
Cash flow
-4.2%
Cash-on-Cash Return
4.7%
Cap rate
0.6%
Rent to Value Ratio
Active
$449,000
4
bds
|
3
ba
|
0
sqft
|
built
2009
3534 Bramblewood Cir, Pascagoula, MS 39581
$-302
Cash flow
-3.5%
Cash-on-Cash Return
4.9%
Cap rate
0.7%
Rent to Value Ratio
Active
$120,000
3
bds
|
2
ba
|
0
sqft
|
built
1952
1915 Roosevelt St, Pascagoula, MS 39567
$282
Cash flow
12.3%
Cash-on-Cash Return
8.5%
Cap rate
1.2%
Rent to Value Ratio
Active
$1,750,000
6
bds
|
7
ba
|
0
sqft
|
built
1984
3007 Beach Blvd, Pascagoula, MS 39567
$-7,651
Cash flow
-22.8%
Cash-on-Cash Return
0.4%
Cap rate
0.2%
Rent to Value Ratio
Active
$119,000
2
bds
|
1
ba
|
0
sqft
|
built
1952
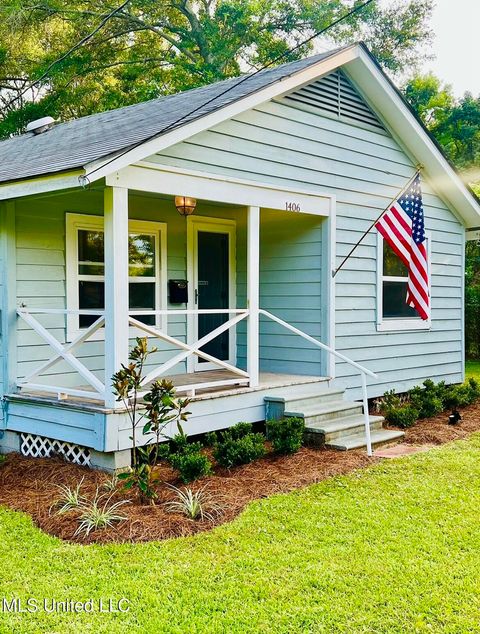
1406 Polk Ave, Pascagoula, MS 39567
$101
Cash flow
4.4%
Cash-on-Cash Return
6.7%
Cap rate
0.9%
Rent to Value Ratio
Active
$125,000
3
bds
|
2
ba
|
0
sqft
|
built
1965
2002 Forrest St, Pascagoula, MS 39581
$316
Cash flow
13.2%
Cash-on-Cash Return
8.7%
Cap rate
1.3%
Rent to Value Ratio
Active
$149,000
3
bds
|
2
ba
|
0
sqft
|
built
1975
4510 Fisher Ave, Pascagoula, MS 39581
$280
Cash flow
9.8%
Cash-on-Cash Return
7.9%
Cap rate
1.1%
Rent to Value Ratio

Active
$250,000
3
bds
|
3
ba
|
0
sqft
|
built
1995
724 Herrick Ave, Pascagoula, MS 39567
$74
Cash flow
1.5%
Cash-on-Cash Return
6.0%
Cap rate
0.9%
Rent to Value Ratio
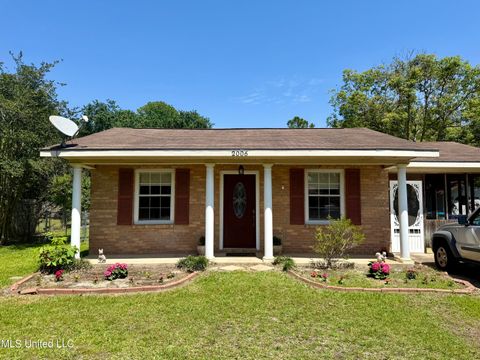
Active
$235,000
3
bds
|
3
ba
|
0
sqft
|
built
2006
1805 Geerkin St, Pascagoula, MS 39581
$-574
Cash flow
-12.7%
Cash-on-Cash Return
2.7%
Cap rate
0.8%
Rent to Value Ratio
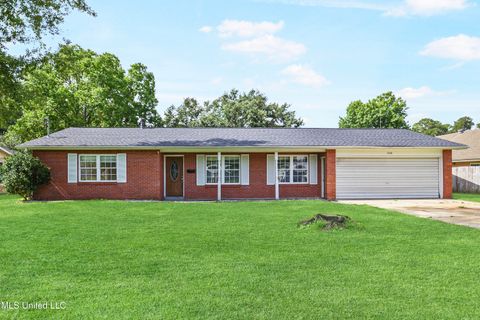
Active
$152,000
3
bds
|
2
ba
|
0
sqft
|
built
1971
3103 Baltimore Ave, Pascagoula, MS 39581
$281
Cash flow
9.6%
Cash-on-Cash Return
7.9%
Cap rate
1.1%
Rent to Value Ratio
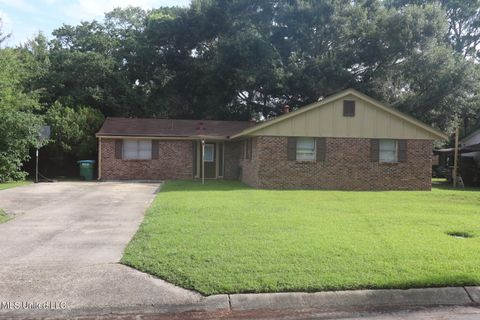
Active
$215,500
4
bds
|
2
ba
|
0
sqft
|
built
1953
2311 Parsley Ave, Pascagoula, MS 39567
$-56
Cash flow
-1.4%
Cash-on-Cash Return
5.4%
Cap rate
0.7%
Rent to Value Ratio
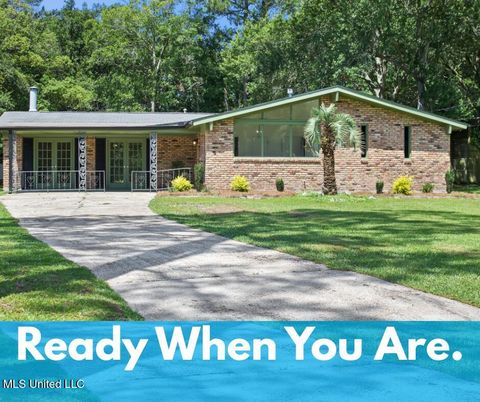
Active
$189,000
3
bds
|
2
ba
|
0
sqft
|
built
1940
1815 Cherubusco St, Pascagoula, MS 39567
$-57
Cash flow
-1.6%
Cash-on-Cash Return
5.3%
Cap rate
0.7%
Rent to Value Ratio
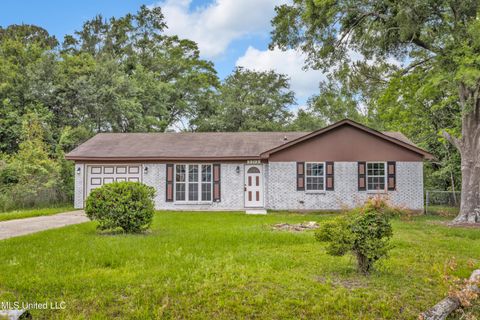
Active
$625,000
3
bds
|
4
ba
|
0
sqft
|
built
2010
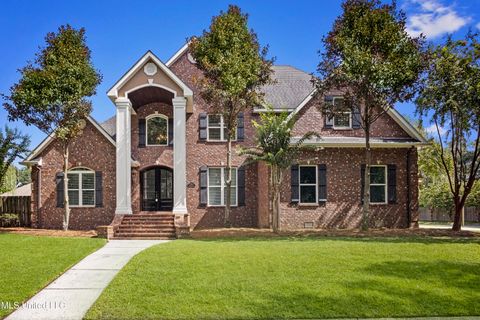
819 Country Club Dr, Pascagoula, MS 39567
$-643
Cash flow
-5.4%
Cash-on-Cash Return
4.4%
Cap rate
0.6%
Rent to Value Ratio
Active
$295,000
5
bds
|
4
ba
|
0
sqft
|
built
1960
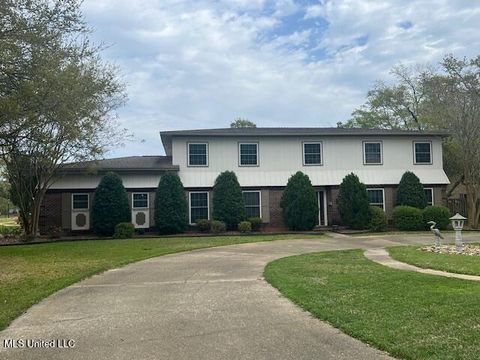
1115 Westwood St, Pascagoula, MS 39567
$-233
Cash flow
-4.1%
Cash-on-Cash Return
4.7%
Cap rate
0.7%
Rent to Value Ratio
Active
$210,000
3
bds
|
2
ba
|
0
sqft
|
built
2008
2708 Canty St, Pascagoula, MS 39567
$115
Cash flow
2.9%
Cash-on-Cash Return
6.3%
Cap rate
0.9%
Rent to Value Ratio
Active
$259,900
4
bds
|
3
ba
|
0
sqft
|
built
1965
3006 Altama Ave, Pascagoula, MS 39567
$199
Cash flow
4.0%
Cash-on-Cash Return
6.6%
Cap rate
0.9%
Rent to Value Ratio
Active
$149,000
3
bds
|
2
ba
|
0
sqft
|
built
1963
2807 Pinewood Ave, Pascagoula, MS 39567
$315
Cash flow
11.0%
Cash-on-Cash Return
8.2%
Cap rate
1.1%
Rent to Value Ratio
Active
$164,990
3
bds
|
2
ba
|
0
sqft
|
built
1967
4507 Pimlico St, Pascagoula, MS 39581
$323
Cash flow
10.2%
Cash-on-Cash Return
8.0%
Cap rate
1.0%
Rent to Value Ratio
Active
$130,000
3
bds
|
2
ba
|
0
sqft
|
built
1986
2713 Brazil St, Pascagoula, MS 39581
$428
Cash flow
17.2%
Cash-on-Cash Return
9.6%
Cap rate
1.2%
Rent to Value Ratio
Active
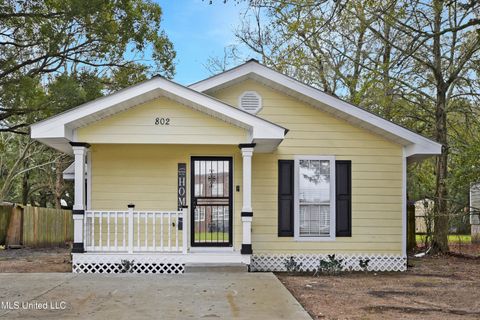
$139,900
3
bds
|
2
ba
|
0
sqft
|
built
1945
802 Dupont Ave, Pascagoula, MS 39567
$259
Cash flow
9.7%
Cash-on-Cash Return
7.9%
Cap rate
1.0%
Rent to Value Ratio
Active
$235,000
4
bds
|
3
ba
|
0
sqft
|
built
1975
1008 Swordfish St, Pascagoula, MS 39581
$250
Cash flow
5.6%
Cash-on-Cash Return
7.0%
Cap rate
0.9%
Rent to Value Ratio
Active
$136,000
3
bds
|
1
ba
|
0
sqft
|
built
1941
2411 14th St, Pascagoula, MS 39567
$172
Cash flow
6.6%
Cash-on-Cash Return
7.2%
Cap rate
1.0%
Rent to Value Ratio
Active
$152,768
3
bds
|
3
ba
|
0
sqft
|
built
1965
2208 22nd St, Pascagoula, MS 39581
$36
Cash flow
1.2%
Cash-on-Cash Return
6.0%
Cap rate
0.7%
Rent to Value Ratio
Active
$192,360
4
bds
|
3
ba
|
0
sqft
|
built
1984
1301 Abbeyville St, Pascagoula, MS 39581
$329
Cash flow
8.9%
Cash-on-Cash Return
7.7%
Cap rate
1.1%
Rent to Value Ratio
Active
$189,500
3
bds
|
3
ba
|
0
sqft
|
built
1994
2006 Eden St, Pascagoula, MS 39581
$276
Cash flow
7.6%
Cash-on-Cash Return
7.4%
Cap rate
0.9%
Rent to Value Ratio
Active
$349,900
3
bds
|
3
ba
|
0
sqft
|
built
1963
903 Westwood St, Pascagoula, MS 39567
$-244
Cash flow
-3.6%
Cash-on-Cash Return
4.8%
Cap rate
0.7%
Rent to Value Ratio
Active
$127,900
3
bds
|
2
ba
|
0
sqft
|
built
1971
3610 Alandale St, Pascagoula, MS 39581
$420
Cash flow
17.1%
Cash-on-Cash Return
9.6%
Cap rate
1.3%
Rent to Value Ratio
Active
$250,000
3
bds
|
4
ba
|
0
sqft
|
built
2006
4510 Washington Ave, Pascagoula, MS 39581
$29
Cash flow
0.6%
Cash-on-Cash Return
5.8%
Cap rate
0.8%
Rent to Value Ratio
Active
$94,700
3
bds
|
2
ba
|
0
sqft
|
built
1940
1106 Resca De La Palma St, Pascagoula, MS 39567
$524
Cash flow
28.9%
Cash-on-Cash Return
12.3%
Cap rate
1.7%
Rent to Value Ratio
Active
$699,000
4
bds
|
3
ba
|
0
sqft
|
built
1999
2112 Washington Ave, Pascagoula, MS 39567
$-1,169
Cash flow
-8.7%
Cash-on-Cash Return
3.7%
Cap rate
0.5%
Rent to Value Ratio
Active
$368,900
4
bds
|
4
ba
|
0
sqft
|
built
1965
3402 Tillman St, Pascagoula, MS 39581
$116
Cash flow
1.6%
Cash-on-Cash Return
6.1%
Cap rate
0.8%
Rent to Value Ratio
Active
$184,900
3
bds
|
2
ba
|
0
sqft
|
built
1960
1602 Sunset St, Pascagoula, MS 39567
$96
Cash flow
2.7%
Cash-on-Cash Return
6.3%
Cap rate
0.9%
Rent to Value Ratio
Active
$239,900
4
bds
|
3
ba
|
0
sqft
|
built
1965
1710 Bates St, Pascagoula, MS 39581
$317
Cash flow
6.9%
Cash-on-Cash Return
7.3%
Cap rate
1.0%
Rent to Value Ratio
Active
$350,000
3
bds
|
2
ba
|
0
sqft
|
built
1900
1009 Resca De La Palma St, Pascagoula, MS 39567
$-257
Cash flow
-3.8%
Cash-on-Cash Return
4.8%
Cap rate
0.7%
Rent to Value Ratio