Phoenix, AZ Investment Properties for Sale
Browse homes for sale and investment properties in Phoenix, AZ. Refine your search by price, property type, or more.
Best cash flowing properties in Phoenix, AZ

Active
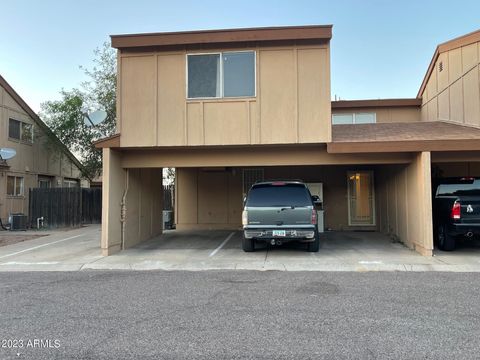
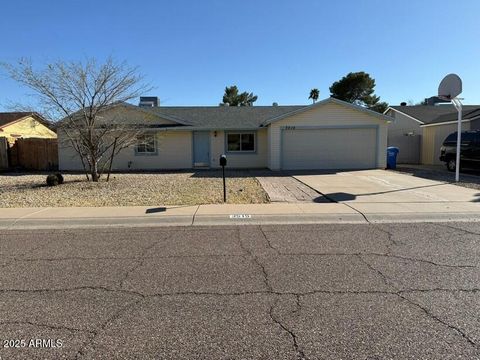
$109,999
2
bds
|
2
ba
|
980
sqft
|
built
1975
3840 N 43rd Ave, Phoenix, AZ 85031
$19
Cash flow
0.9%
Cash-on-Cash Return
6.5%
Cap rate
1.3%
Rent to Value Ratio
Active
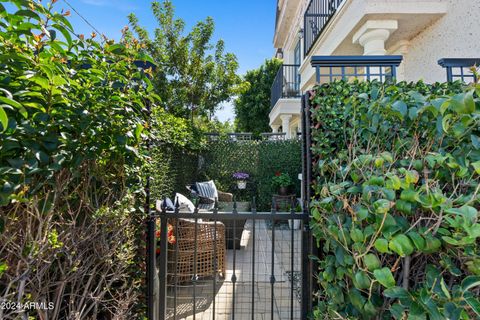
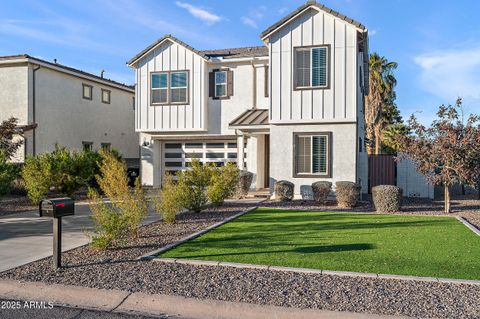
$699,000
2
bds
|
3
ba
|
1,520
sqft
|
built
2016
4438 N 27th St, Phoenix, AZ 85016
$-267
Cash flow
-2.0%
Cash-on-Cash Return
5.8%
Cap rate
0.8%
Rent to Value Ratio
3,573 out of 3,847 properties for sale in Phoenix, AZ
Limited Results Shown
Create a free account, or log in to reveal all property listings and enjoy the complete experience.
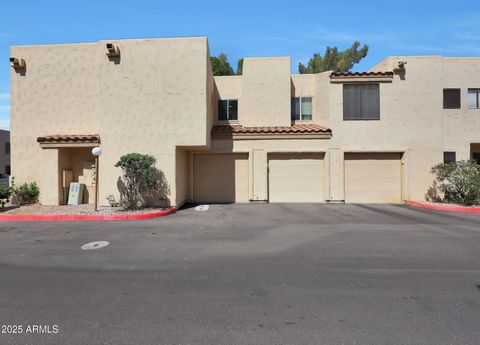
Active
$205,000
2
bds
|
2
ba
|
1,043
sqft
|
built
1981
12445 N 21st Ave, Phoenix, AZ 85029
$-327
Cash flow
-8.3%
Cash-on-Cash Return
4.3%
Cap rate
0.7%
Rent to Value Ratio
Active
$799,999
3
bds
|
2
ba
|
1,858
sqft
|
built
1971
7607 N 22nd Pl, Phoenix, AZ 85020
$-2,431
Cash flow
-15.9%
Cash-on-Cash Return
2.6%
Cap rate
0.4%
Rent to Value Ratio

Active
$424,900
3
bds
|
2
ba
|
1,148
sqft
|
built
1979
3508 E Gelding Dr, Phoenix, AZ 85032
$-922
Cash flow
-11.3%
Cash-on-Cash Return
3.7%
Cap rate
0.5%
Rent to Value Ratio
Active
$352,000
3
bds
|
2
ba
|
1,264
sqft
|
built
1960
402 W Darrow St, Phoenix, AZ 85041
$-778
Cash flow
-11.5%
Cash-on-Cash Return
3.6%
Cap rate
0.5%
Rent to Value Ratio
Active
$849,500
4
bds
|
3
ba
|
3,002
sqft
|
built
2006
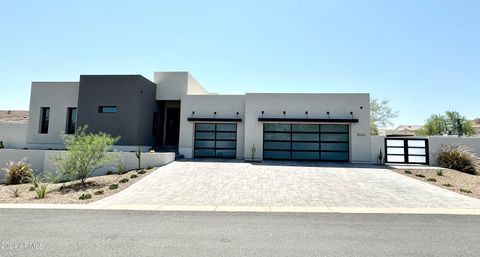
5026 W Parsons Rd, Phoenix, AZ 85083
$-2,063
Cash flow
-12.7%
Cash-on-Cash Return
3.4%
Cap rate
0.5%
Rent to Value Ratio
Active
$427,000
4
bds
|
2
ba
|
1,735
sqft
|
built
2008
2441 W Beverly Rd, Phoenix, AZ 85041
$-831
Cash flow
-10.2%
Cash-on-Cash Return
3.9%
Cap rate
0.6%
Rent to Value Ratio
Active
$599,900
3
bds
|
2
ba
|
1,407
sqft
|
built
2000
20917 N 37th Pl, Phoenix, AZ 85050
$-1,787
Cash flow
-15.5%
Cash-on-Cash Return
2.7%
Cap rate
0.4%
Rent to Value Ratio
Active
$254,900
2
bds
|
2
ba
|
870
sqft
|
built
1982
2842 E Beck Ln, Phoenix, AZ 85032
$-662
Cash flow
-13.6%
Cash-on-Cash Return
3.1%
Cap rate
0.5%
Rent to Value Ratio
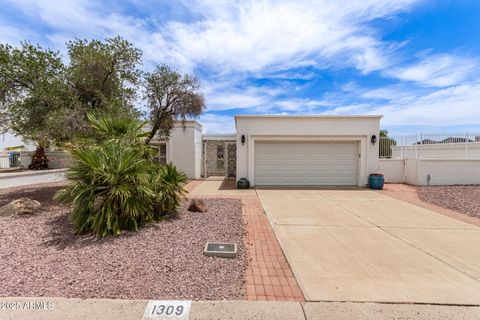
Active
$510,990
2
bds
|
2
ba
|
1,757
sqft
|
built
1981
1309 E Meadow Ln, Phoenix, AZ 85022
$-1,183
Cash flow
-12.1%
Cash-on-Cash Return
3.5%
Cap rate
0.5%
Rent to Value Ratio
Active
$1,970,000
6
bds
|
6
ba
|
4,365
sqft
|
built
1979
1955 E Greenway Rd, Phoenix, AZ 85022
$-5,808
Cash flow
-15.4%
Cash-on-Cash Return
2.7%
Cap rate
0.4%
Rent to Value Ratio
Active
$628,000
3
bds
|
2
ba
|
1,661
sqft
|
built
1996
4350 E Abraham Ln, Phoenix, AZ 85050
$-1,508
Cash flow
-12.5%
Cash-on-Cash Return
3.4%
Cap rate
0.5%
Rent to Value Ratio
Active
$265,000
2
bds
|
2
ba
|
890
sqft
|
built
1986
2228 N 52nd St, Phoenix, AZ 85008
$-591
Cash flow
-11.6%
Cash-on-Cash Return
3.6%
Cap rate
0.6%
Rent to Value Ratio
Active
$997,999
4
bds
|
3
ba
|
2,589
sqft
|
built
2021
3750 E Earll Dr, Phoenix, AZ 85018
$-2,058
Cash flow
-10.8%
Cash-on-Cash Return
3.8%
Cap rate
0.5%
Rent to Value Ratio
Active
$435,000
3
bds
|
2
ba
|
1,488
sqft
|
built
2020
2723 W Apollo Rd, Phoenix, AZ 85041
$-989
Cash flow
-11.9%
Cash-on-Cash Return
3.5%
Cap rate
0.5%
Rent to Value Ratio
Active
$410,000
3
bds
|
2
ba
|
1,648
sqft
|
built
1978
3515 E Winchcomb Dr, Phoenix, AZ 85032
$-695
Cash flow
-8.8%
Cash-on-Cash Return
4.2%
Cap rate
0.6%
Rent to Value Ratio
Active
$425,000
3
bds
|
2
ba
|
1,213
sqft
|
built
1986
3441 N 31st St, Phoenix, AZ 85016
$-1,393
Cash flow
-17.1%
Cash-on-Cash Return
2.3%
Cap rate
0.4%
Rent to Value Ratio
Active
$2,300,000
5
bds
|
5
ba
|
3,685
sqft
|
built
2022
27222 N 64th Dr, Phoenix, AZ 85083
$-5,715
Cash flow
-13.0%
Cash-on-Cash Return
3.3%
Cap rate
0.4%
Rent to Value Ratio
Active
$238,900
2
bds
|
2
ba
|
946
sqft
|
built
1984
15402 N 28th St, Phoenix, AZ 85032
$-570
Cash flow
-12.4%
Cash-on-Cash Return
3.4%
Cap rate
0.6%
Rent to Value Ratio
Active
$400,000
2
bds
|
2
ba
|
1,208
sqft
|
built
2008
535 W Thomas Rd, Phoenix, AZ 85013
$-663
Cash flow
-8.6%
Cash-on-Cash Return
4.3%
Cap rate
0.8%
Rent to Value Ratio
Active
$535,000
2
bds
|
2
ba
|
1,494
sqft
|
built
1981
3401 N 37th St, Phoenix, AZ 85018
$-1,890
Cash flow
-18.4%
Cash-on-Cash Return
2.0%
Cap rate
0.4%
Rent to Value Ratio

Active
$350,000
3
bds
|
2
ba
|
1,408
sqft
|
built
1966
3828 N 30th St, Phoenix, AZ 85016
$-919
Cash flow
-13.7%
Cash-on-Cash Return
3.1%
Cap rate
0.6%
Rent to Value Ratio

Active
$255,000
2
bds
|
2
ba
|
1,080
sqft
|
built
1981
12445 N 21st Ave, Phoenix, AZ 85029
$-654
Cash flow
-13.4%
Cash-on-Cash Return
3.2%
Cap rate
0.5%
Rent to Value Ratio
Active
$1,075,000
4
bds
|
4
ba
|
3,461
sqft
|
built
2004
2011 W Calle De Las Estrella, Phoenix, AZ 85085
$-1,757
Cash flow
-8.5%
Cash-on-Cash Return
4.3%
Cap rate
0.6%
Rent to Value Ratio
Active
$109,999
2
bds
|
2
ba
|
980
sqft
|
built
1975
3840 N 43rd Ave, Phoenix, AZ 85031
$19
Cash flow
0.9%
Cash-on-Cash Return
6.5%
Cap rate
1.3%
Rent to Value Ratio
Active
$625,000
5
bds
|
3
ba
|
3,727
sqft
|
built
2002
8813 S 13th Pl, Phoenix, AZ 85042
$-861
Cash flow
-7.2%
Cash-on-Cash Return
4.6%
Cap rate
0.7%
Rent to Value Ratio
Active
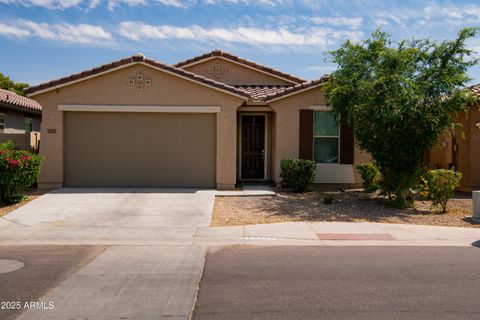
$345,000
3
bds
|
3
ba
|
1,934
sqft
|
built
2020
3713 S 54th Ln, Phoenix, AZ 85043
$-702
Cash flow
-10.6%
Cash-on-Cash Return
3.8%
Cap rate
0.6%
Rent to Value Ratio
Active
$699,000
2
bds
|
3
ba
|
1,520
sqft
|
built
2016
4438 N 27th St, Phoenix, AZ 85016
$-267
Cash flow
-2.0%
Cash-on-Cash Return
5.8%
Cap rate
0.8%
Rent to Value Ratio
Active
$980,000
4
bds
|
4
ba
|
2,460
sqft
|
built
2019
6503 E Bluefield Ave, Phoenix, AZ 85054
$-2,405
Cash flow
-12.8%
Cash-on-Cash Return
3.3%
Cap rate
0.5%
Rent to Value Ratio

Active
$749,000
4
bds
|
3
ba
|
2,403
sqft
|
built
1953
1215 E Cambridge Ave, Phoenix, AZ 85006
$-1,031
Cash flow
-7.2%
Cash-on-Cash Return
4.6%
Cap rate
0.6%
Rent to Value Ratio
Active
$699,000
4
bds
|
3
ba
|
3,006
sqft
|
built
2005
2221 W Steed Rdg, Phoenix, AZ 85085
$-1,742
Cash flow
-13.0%
Cash-on-Cash Return
3.3%
Cap rate
0.5%
Rent to Value Ratio
Active
$2,750,000
3
bds
|
4
ba
|
3,414
sqft
|
built
1957
3817 E Highland Ave, Phoenix, AZ 85018
$-12,669
Cash flow
-24.0%
Cash-on-Cash Return
0.7%
Cap rate
0.1%
Rent to Value Ratio
Active
$2,500,000
bds
|
0
ba
|
0
sqft
|
built
1964
2017 N 17th St, Phoenix, AZ 85006
$-12,285
Cash flow
-25.6%
Cash-on-Cash Return
0.4%
Cap rate
0.0%
Rent to Value Ratio

Active
$639,000
3
bds
|
3
ba
|
2,021
sqft
|
built
2001
2168 E Vista Bonita Dr, Phoenix, AZ 85024
$-1,448
Cash flow
-11.8%
Cash-on-Cash Return
3.5%
Cap rate
0.5%
Rent to Value Ratio
Active
$349,900
2
bds
|
3
ba
|
1,207
sqft
|
built
2002
17610 N 17th Pl, Phoenix, AZ 85022
$-878
Cash flow
-13.1%
Cash-on-Cash Return
3.3%
Cap rate
0.5%
Rent to Value Ratio
Active
$340,000
3
bds
|
2
ba
|
1,640
sqft
|
built
1962
100 W Maryland Ave, Phoenix, AZ 85013
$-964
Cash flow
-14.8%
Cash-on-Cash Return
2.9%
Cap rate
0.6%
Rent to Value Ratio
Active
$224,900
2
bds
|
2
ba
|
930
sqft
|
built
1979
11026 N 28th Dr, Phoenix, AZ 85029
$-591
Cash flow
-13.7%
Cash-on-Cash Return
3.1%
Cap rate
0.6%
Rent to Value Ratio
Active
$219,990
2
bds
|
2
ba
|
946
sqft
|
built
1984
15402 N 28th St, Phoenix, AZ 85032
$-479
Cash flow
-11.4%
Cash-on-Cash Return
3.7%
Cap rate
0.6%
Rent to Value Ratio

Active
$240,000
1
bds
|
1
ba
|
720
sqft
|
built
1964
805 N 4th Ave, Phoenix, AZ 85003
$-599
Cash flow
-13.0%
Cash-on-Cash Return
3.3%
Cap rate
0.8%
Rent to Value Ratio
Active
$475,000
4
bds
|
2
ba
|
1,806
sqft
|
built
1974
13805 N 31st Ave, Phoenix, AZ 85053
$-1,280
Cash flow
-14.1%
Cash-on-Cash Return
3.0%
Cap rate
0.4%
Rent to Value Ratio
Active
$248,900
2
bds
|
2
ba
|
965
sqft
|
built
1986
10610 S 48th St, Phoenix, AZ 85044
$-546
Cash flow
-11.4%
Cash-on-Cash Return
3.6%
Cap rate
0.6%
Rent to Value Ratio