Phoenix, AZ Investment Properties for Sale
Browse homes for sale and investment properties in Phoenix, AZ. Refine your search by price, property type, or more.
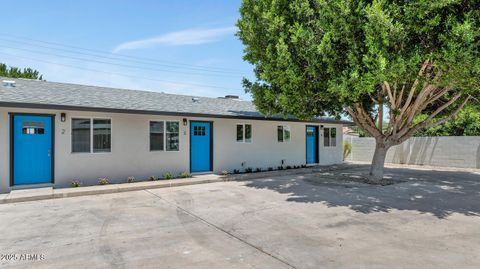
Best cash flowing properties in Phoenix, AZ
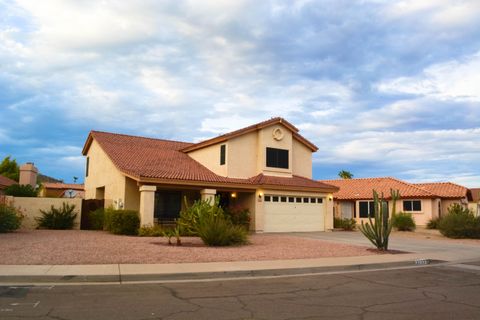
Closed
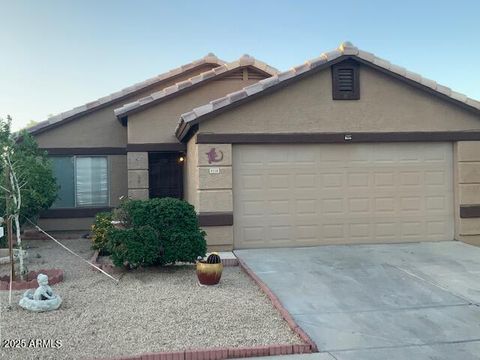
$302,900
4
bds
|
3
ba
|
2,082
sqft
|
built
1990
3732 E South Fork Dr, Phoenix, AZ 85044
$169
Cash flow
2.9%
Cash-on-Cash Return
6.3%
Cap rate
0.9%
Rent to Value Ratio
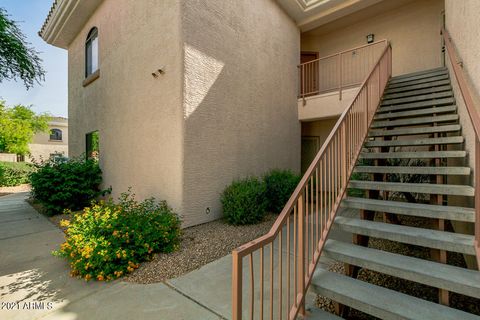
Closed
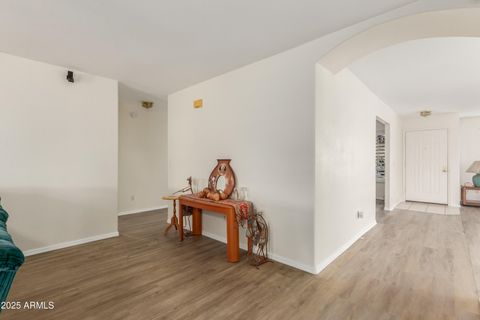
$196,900
2
bds
|
2
ba
|
1,037
sqft
|
built
1999
10030 W Indian School Rd, Phoenix, AZ 85037
$-159
Cash flow
-4.2%
Cash-on-Cash Return
4.7%
Cap rate
0.8%
Rent to Value Ratio
3,486 out of 3,755 properties for sale in Phoenix, AZ
Limited Results Shown
Create a free account, or log in to reveal all property listings and enjoy the complete experience.

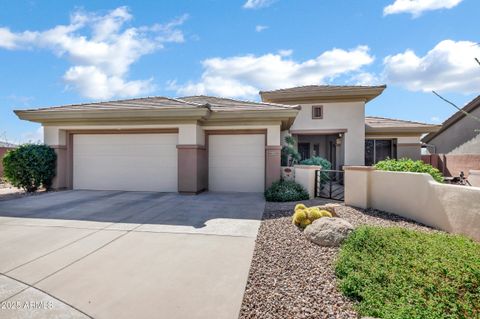
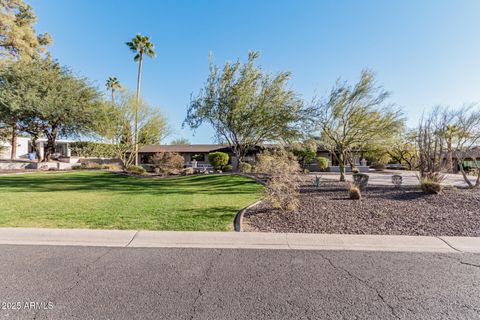
Active
$340,000
3
bds
|
3
ba
|
1,537
sqft
|
built
2017
2049 N 77th Dr, Phoenix, AZ 85035
$-573
Cash flow
-8.8%
Cash-on-Cash Return
3.7%
Cap rate
0.6%
Rent to Value Ratio
Closed
$196,900
2
bds
|
2
ba
|
1,037
sqft
|
built
1999
10030 W Indian School Rd, Phoenix, AZ 85037
$-159
Cash flow
-4.2%
Cash-on-Cash Return
4.7%
Cap rate
0.8%
Rent to Value Ratio
Active
$714,999
3
bds
|
3
ba
|
2,544
sqft
|
built
2004
41215 N Lytham Ct, Phoenix, AZ 85086
$-1,689
Cash flow
-12.3%
Cash-on-Cash Return
2.8%
Cap rate
0.5%
Rent to Value Ratio
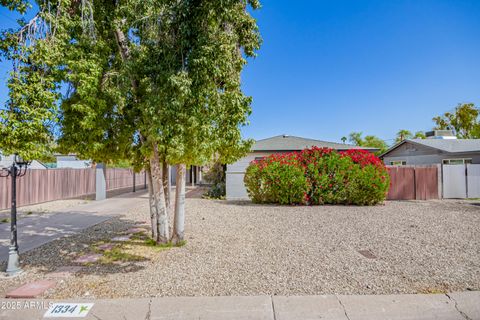
Active
$625,000
3
bds
|
2
ba
|
1,408
sqft
|
built
1952
1334 W Sells Dr, Phoenix, AZ 85013
$-1,075
Cash flow
-9.0%
Cash-on-Cash Return
3.6%
Cap rate
0.5%
Rent to Value Ratio
Active
$1,140,000
bds
|
0
ba
|
0
sqft
|
built
1987
2122 W Augusta Ave, Phoenix, AZ 85021
$-3,780
Cash flow
-17.3%
Cash-on-Cash Return
1.7%
Cap rate
0.2%
Rent to Value Ratio
Active
$374,990
3
bds
|
2
ba
|
1,208
sqft
|
built
1997
8338 W Coolidge St, Phoenix, AZ 85037
$-659
Cash flow
-9.2%
Cash-on-Cash Return
3.6%
Cap rate
0.5%
Rent to Value Ratio
Active
$465,000
3
bds
|
2
ba
|
1,888
sqft
|
built
1997
3363 W Lone Cactus Dr, Phoenix, AZ 85027
$-825
Cash flow
-9.3%
Cash-on-Cash Return
3.6%
Cap rate
0.5%
Rent to Value Ratio
Active
$3,249,000
5
bds
|
5
ba
|
4,111
sqft
|
built
1964
4605 E Orange Dr, Phoenix, AZ 85018
$-9,920
Cash flow
-15.9%
Cash-on-Cash Return
2.0%
Cap rate
0.3%
Rent to Value Ratio

Active
$394,998
2
bds
|
1
ba
|
1,131
sqft
|
built
1950
3302 E Yale St, Phoenix, AZ 85008
$-599
Cash flow
-7.9%
Cash-on-Cash Return
3.9%
Cap rate
0.5%
Rent to Value Ratio
Active
$870,000
bds
|
0
ba
|
0
sqft
|
built
1961
1917 E Monroe St, Phoenix, AZ 85034
$-3,194
Cash flow
-19.2%
Cash-on-Cash Return
1.3%
Cap rate
0.2%
Rent to Value Ratio
Active
$549,900
3
bds
|
2
ba
|
1,618
sqft
|
built
1950
1009 E Bethany Home Rd, Phoenix, AZ 85014
$-1,078
Cash flow
-10.2%
Cash-on-Cash Return
3.3%
Cap rate
0.5%
Rent to Value Ratio

Active
$875,000
3
bds
|
2
ba
|
1,814
sqft
|
built
1952
6314 N 14th Pl, Phoenix, AZ 85014
$-2,413
Cash flow
-14.4%
Cash-on-Cash Return
2.4%
Cap rate
0.3%
Rent to Value Ratio

Active
$375,000
3
bds
|
3
ba
|
1,767
sqft
|
built
2002
4234 S 62nd Ln, Phoenix, AZ 85043
$-589
Cash flow
-8.2%
Cash-on-Cash Return
3.8%
Cap rate
0.5%
Rent to Value Ratio

Active
$560,000
3
bds
|
3
ba
|
2,376
sqft
|
built
1993
4753 E Bighorn Ave, Phoenix, AZ 85044
$-965
Cash flow
-9.0%
Cash-on-Cash Return
3.6%
Cap rate
0.5%
Rent to Value Ratio
Active
$320,000
4
bds
|
2
ba
|
1,930
sqft
|
built
1963
5937 W Coolidge St, Phoenix, AZ 85033
$-387
Cash flow
-6.3%
Cash-on-Cash Return
4.2%
Cap rate
0.6%
Rent to Value Ratio

Active
$325,000
2
bds
|
2
ba
|
1,178
sqft
|
built
1999
3302 N 7th St, Phoenix, AZ 85014
$-697
Cash flow
-11.2%
Cash-on-Cash Return
3.1%
Cap rate
0.6%
Rent to Value Ratio

Active
$799,900
5
bds
|
5
ba
|
1,906
sqft
|
built
1927
2546 N 9th St, Phoenix, AZ 85006
$-2,064
Cash flow
-13.5%
Cash-on-Cash Return
2.6%
Cap rate
0.3%
Rent to Value Ratio

Active
$569,000
2
bds
|
2
ba
|
1,577
sqft
|
built
2008
5450 E Deer Valley Dr, Phoenix, AZ 85054
$-1,826
Cash flow
-16.7%
Cash-on-Cash Return
1.8%
Cap rate
0.4%
Rent to Value Ratio
Pending
$230,000
2
bds
|
2
ba
|
863
sqft
|
built
1984
520 W Hononegh Dr, Phoenix, AZ 85027
$-337
Cash flow
-7.6%
Cash-on-Cash Return
3.9%
Cap rate
0.6%
Rent to Value Ratio

Active
$1,185,000
5
bds
|
4
ba
|
4,427
sqft
|
built
1993
15413 S 31st Pl, Phoenix, AZ 85048
$-3,384
Cash flow
-14.9%
Cash-on-Cash Return
2.3%
Cap rate
0.3%
Rent to Value Ratio

Pending
$649,000
4
bds
|
2
ba
|
1,930
sqft
|
built
1980
4229 E Pearce Rd, Phoenix, AZ 85044
$-1,477
Cash flow
-11.9%
Cash-on-Cash Return
2.9%
Cap rate
0.4%
Rent to Value Ratio
Active
$799,000
4
bds
|
2
ba
|
2,494
sqft
|
built
2001
6719 N 15th Ave, Phoenix, AZ 85015
$-1,371
Cash flow
-9.0%
Cash-on-Cash Return
3.6%
Cap rate
0.5%
Rent to Value Ratio
Active under contract
$499,000
4
bds
|
3
ba
|
2,244
sqft
|
built
2021
6338 W Raymond St, Phoenix, AZ 85043
$-1,034
Cash flow
-10.8%
Cash-on-Cash Return
3.2%
Cap rate
0.5%
Rent to Value Ratio
Active
$829,900
6
bds
|
5
ba
|
3,432
sqft
|
built
1993
753 E Mountain Sky Ave, Phoenix, AZ 85048
$-1,656
Cash flow
-10.4%
Cash-on-Cash Return
3.3%
Cap rate
0.5%
Rent to Value Ratio
Closed
$519,000
3
bds
|
2
ba
|
1,764
sqft
|
built
1954
519 E El Camino Dr, Phoenix, AZ 85020
$-258
Cash flow
-2.6%
Cash-on-Cash Return
5.1%
Cap rate
0.7%
Rent to Value Ratio

Active
$499,000
3
bds
|
3
ba
|
2,446
sqft
|
built
2006
2050 W Davis Rd, Phoenix, AZ 85023
$-961
Cash flow
-10.0%
Cash-on-Cash Return
3.4%
Cap rate
0.5%
Rent to Value Ratio
Active
$298,900
3
bds
|
3
ba
|
1,608
sqft
|
built
1967
4614 N 19th Ave, Phoenix, AZ 85015
$-457
Cash flow
-8.0%
Cash-on-Cash Return
3.8%
Cap rate
0.6%
Rent to Value Ratio
Active
$580,000
3
bds
|
3
ba
|
1,805
sqft
|
built
2001
12841 N 19th St, Phoenix, AZ 85022
$-1,353
Cash flow
-12.2%
Cash-on-Cash Return
2.9%
Cap rate
0.4%
Rent to Value Ratio
Active
$1,100,000
5
bds
|
3
ba
|
2,693
sqft
|
built
1970
10240 N 34th Pl, Phoenix, AZ 85028
$-1,722
Cash flow
-8.2%
Cash-on-Cash Return
3.8%
Cap rate
0.5%
Rent to Value Ratio
Active
$440,000
3
bds
|
2
ba
|
1,326
sqft
|
built
1952
1818 E Monterey Way, Phoenix, AZ 85016
$-436
Cash flow
-5.2%
Cash-on-Cash Return
4.5%
Cap rate
0.6%
Rent to Value Ratio
Active
$399,950
3
bds
|
2
ba
|
1,936
sqft
|
built
1969
3217 E Friess Dr, Phoenix, AZ 85032
$-506
Cash flow
-6.6%
Cash-on-Cash Return
4.2%
Cap rate
0.6%
Rent to Value Ratio
Active under contract
$449,000
4
bds
|
3
ba
|
1,889
sqft
|
built
1961
3600 N 5th Ave, Phoenix, AZ 85013
$-1,056
Cash flow
-12.3%
Cash-on-Cash Return
2.9%
Cap rate
0.6%
Rent to Value Ratio
Closed
$302,900
4
bds
|
3
ba
|
2,082
sqft
|
built
1990
3732 E South Fork Dr, Phoenix, AZ 85044
$169
Cash flow
2.9%
Cash-on-Cash Return
6.3%
Cap rate
0.9%
Rent to Value Ratio
Active
$950,000
bds
|
0
ba
|
0
sqft
|
built
1965
2421 W Glenrosa Ave, Phoenix, AZ 85015
$-2,725
Cash flow
-15.0%
Cash-on-Cash Return
2.2%
Cap rate
0.3%
Rent to Value Ratio
Active
$370,000
2
bds
|
2
ba
|
1,436
sqft
|
built
1993
10249 N 12th Pl, Phoenix, AZ 85020
$-944
Cash flow
-13.3%
Cash-on-Cash Return
2.6%
Cap rate
0.5%
Rent to Value Ratio
Active
$689,900
3
bds
|
2
ba
|
900
sqft
|
built
1949
4130 N Longview Ave, Phoenix, AZ 85014
$-1,774
Cash flow
-13.4%
Cash-on-Cash Return
2.6%
Cap rate
0.3%
Rent to Value Ratio
Pending
$834,900
4
bds
|
3
ba
|
2,336
sqft
|
built
1974
10801 N 45th St, Phoenix, AZ 85028
$-960
Cash flow
-6.0%
Cash-on-Cash Return
4.3%
Cap rate
0.6%
Rent to Value Ratio
Active
$500,000
4
bds
|
3
ba
|
1,841
sqft
|
built
2000
7204 S Golfside Ln, Phoenix, AZ 85042
$-748
Cash flow
-7.8%
Cash-on-Cash Return
3.9%
Cap rate
0.6%
Rent to Value Ratio
Active
$469,900
4
bds
|
2
ba
|
2,000
sqft
|
built
1970
3408 W Carol Ave, Phoenix, AZ 85051
$-545
Cash flow
-6.1%
Cash-on-Cash Return
4.3%
Cap rate
0.6%
Rent to Value Ratio
Active
$370,000
3
bds
|
2
ba
|
1,180
sqft
|
built
1954
8836 N 28th Dr, Phoenix, AZ 85051
$-562
Cash flow
-7.9%
Cash-on-Cash Return
3.9%
Cap rate
0.5%
Rent to Value Ratio