Phoenix, AZ Investment Properties for Sale
Browse homes for sale and investment properties in Phoenix, AZ. Refine your search by price, property type, or more.
Best cash flowing properties in Phoenix, AZ

Active
$335,000
2
bds
|
2
ba
|
1,017
sqft
|
built
2004
9820 N Central Ave, Phoenix, AZ 85020
$-50
Cash flow
-0.8%
Cash-on-Cash Return
5.5%
Cap rate
0.8%
Rent to Value Ratio
Active
$215,000
2
bds
|
1
ba
|
700
sqft
|
built
1982
3645 N 71st Ave, Phoenix, AZ 85033
$-202
Cash flow
-4.9%
Cash-on-Cash Return
4.5%
Cap rate
0.7%
Rent to Value Ratio
3,486 out of 3,755 properties for sale in Phoenix, AZ
Limited Results Shown
Create a free account, or log in to reveal all property listings and enjoy the complete experience.
Active
$875,000
3
bds
|
2
ba
|
1,814
sqft
|
built
1952
6314 N 14th Pl, Phoenix, AZ 85014
$-2,413
Cash flow
-14.4%
Cash-on-Cash Return
2.4%
Cap rate
0.3%
Rent to Value Ratio
Active
$375,000
3
bds
|
3
ba
|
1,767
sqft
|
built
2002
4234 S 62nd Ln, Phoenix, AZ 85043
$-589
Cash flow
-8.2%
Cash-on-Cash Return
3.8%
Cap rate
0.5%
Rent to Value Ratio
Active
$560,000
3
bds
|
3
ba
|
2,376
sqft
|
built
1993
4753 E Bighorn Ave, Phoenix, AZ 85044
$-965
Cash flow
-9.0%
Cash-on-Cash Return
3.6%
Cap rate
0.5%
Rent to Value Ratio
Active
$320,000
4
bds
|
2
ba
|
1,930
sqft
|
built
1963
5937 W Coolidge St, Phoenix, AZ 85033
$-387
Cash flow
-6.3%
Cash-on-Cash Return
4.2%
Cap rate
0.6%
Rent to Value Ratio
Active
$739,999
4
bds
|
3
ba
|
1,677
sqft
|
built
1953
5812 N 18th Pl, Phoenix, AZ 85016
$-1,121
Cash flow
-7.9%
Cash-on-Cash Return
3.9%
Cap rate
0.5%
Rent to Value Ratio
Active
$325,000
2
bds
|
2
ba
|
1,178
sqft
|
built
1999
3302 N 7th St, Phoenix, AZ 85014
$-697
Cash flow
-11.2%
Cash-on-Cash Return
3.1%
Cap rate
0.6%
Rent to Value Ratio
Active
$799,900
5
bds
|
5
ba
|
1,906
sqft
|
built
1927
2546 N 9th St, Phoenix, AZ 85006
$-2,064
Cash flow
-13.5%
Cash-on-Cash Return
2.6%
Cap rate
0.3%
Rent to Value Ratio
Active
$569,000
2
bds
|
2
ba
|
1,577
sqft
|
built
2008
5450 E Deer Valley Dr, Phoenix, AZ 85054
$-1,826
Cash flow
-16.7%
Cash-on-Cash Return
1.8%
Cap rate
0.4%
Rent to Value Ratio
Pending
$649,000
4
bds
|
2
ba
|
1,930
sqft
|
built
1980
4229 E Pearce Rd, Phoenix, AZ 85044
$-1,477
Cash flow
-11.9%
Cash-on-Cash Return
2.9%
Cap rate
0.4%
Rent to Value Ratio
Active
$734,900
4
bds
|
3
ba
|
2,849
sqft
|
built
1993
15273 S 31st St, Phoenix, AZ 85048
$-1,342
Cash flow
-9.5%
Cash-on-Cash Return
3.5%
Cap rate
0.5%
Rent to Value Ratio
Active
$618,999
4
bds
|
3
ba
|
2,714
sqft
|
built
2005
2122 W Red Range Way, Phoenix, AZ 85085
$-1,151
Cash flow
-9.7%
Cash-on-Cash Return
3.4%
Cap rate
0.5%
Rent to Value Ratio
Active
$499,000
3
bds
|
3
ba
|
2,446
sqft
|
built
2006
2050 W Davis Rd, Phoenix, AZ 85023
$-961
Cash flow
-10.0%
Cash-on-Cash Return
3.4%
Cap rate
0.5%
Rent to Value Ratio
Active
$391,000
3
bds
|
2
ba
|
1,759
sqft
|
built
1977
909 W Danbury Rd, Phoenix, AZ 85023
$-486
Cash flow
-6.5%
Cash-on-Cash Return
4.2%
Cap rate
0.5%
Rent to Value Ratio

Active
$500,000
5
bds
|
4
ba
|
2,388
sqft
|
built
1968
14001 N 34th Dr, Phoenix, AZ 85053
$-787
Cash flow
-8.2%
Cash-on-Cash Return
3.8%
Cap rate
0.5%
Rent to Value Ratio
Active
$1,020,000
6
bds
|
4
ba
|
3,561
sqft
|
built
1955
1801 E Berridge Ln, Phoenix, AZ 85016
$-1,445
Cash flow
-7.4%
Cash-on-Cash Return
4.0%
Cap rate
0.6%
Rent to Value Ratio

Active
$325,000
2
bds
|
1
ba
|
950
sqft
|
built
2004
7118 S 37th Gln, Phoenix, AZ 85041
$-602
Cash flow
-9.7%
Cash-on-Cash Return
3.5%
Cap rate
0.5%
Rent to Value Ratio

Active
$529,995
4
bds
|
3
ba
|
2,187
sqft
|
built
2003
2526 W Florentine Rd, Phoenix, AZ 85086
$-984
Cash flow
-9.7%
Cash-on-Cash Return
3.5%
Cap rate
0.5%
Rent to Value Ratio

Active
$799,000
6
bds
|
3
ba
|
4,708
sqft
|
built
2005
7419 S 25th Dr, Phoenix, AZ 85041
$-1,933
Cash flow
-12.6%
Cash-on-Cash Return
2.8%
Cap rate
0.4%
Rent to Value Ratio

Active
$415,000
3
bds
|
2
ba
|
1,780
sqft
|
built
1966
3719 W Griswold Rd, Phoenix, AZ 85051
$-819
Cash flow
-10.3%
Cash-on-Cash Return
3.3%
Cap rate
0.4%
Rent to Value Ratio

Active
$489,900
4
bds
|
2
ba
|
1,702
sqft
|
built
1973
2339 W Ponderosa Ln, Phoenix, AZ 85023
$-954
Cash flow
-10.2%
Cash-on-Cash Return
3.3%
Cap rate
0.4%
Rent to Value Ratio

Active under contract
$449,999
4
bds
|
2
ba
|
1,465
sqft
|
built
1994
22615 N 31st Dr, Phoenix, AZ 85027
$-752
Cash flow
-8.7%
Cash-on-Cash Return
3.7%
Cap rate
0.5%
Rent to Value Ratio
Active
$335,000
2
bds
|
2
ba
|
1,017
sqft
|
built
2004
9820 N Central Ave, Phoenix, AZ 85020
$-50
Cash flow
-0.8%
Cash-on-Cash Return
5.5%
Cap rate
0.8%
Rent to Value Ratio
Active
$699,000
3
bds
|
3
ba
|
1,861
sqft
|
built
1987
4020 E Laurel Ln, Phoenix, AZ 85028
$-1,715
Cash flow
-12.8%
Cash-on-Cash Return
2.7%
Cap rate
0.4%
Rent to Value Ratio
Active
$215,000
2
bds
|
1
ba
|
700
sqft
|
built
1982
3645 N 71st Ave, Phoenix, AZ 85033
$-202
Cash flow
-4.9%
Cash-on-Cash Return
4.5%
Cap rate
0.7%
Rent to Value Ratio

Active
$385,000
3
bds
|
2
ba
|
1,360
sqft
|
built
1956
5635 N 35th Dr, Phoenix, AZ 85019
$-499
Cash flow
-6.8%
Cash-on-Cash Return
4.1%
Cap rate
0.5%
Rent to Value Ratio
Active
$384,999
2
bds
|
2
ba
|
1,634
sqft
|
built
1986
902 W Glendale Ave, Phoenix, AZ 85021
$-1,106
Cash flow
-15.0%
Cash-on-Cash Return
2.2%
Cap rate
0.5%
Rent to Value Ratio
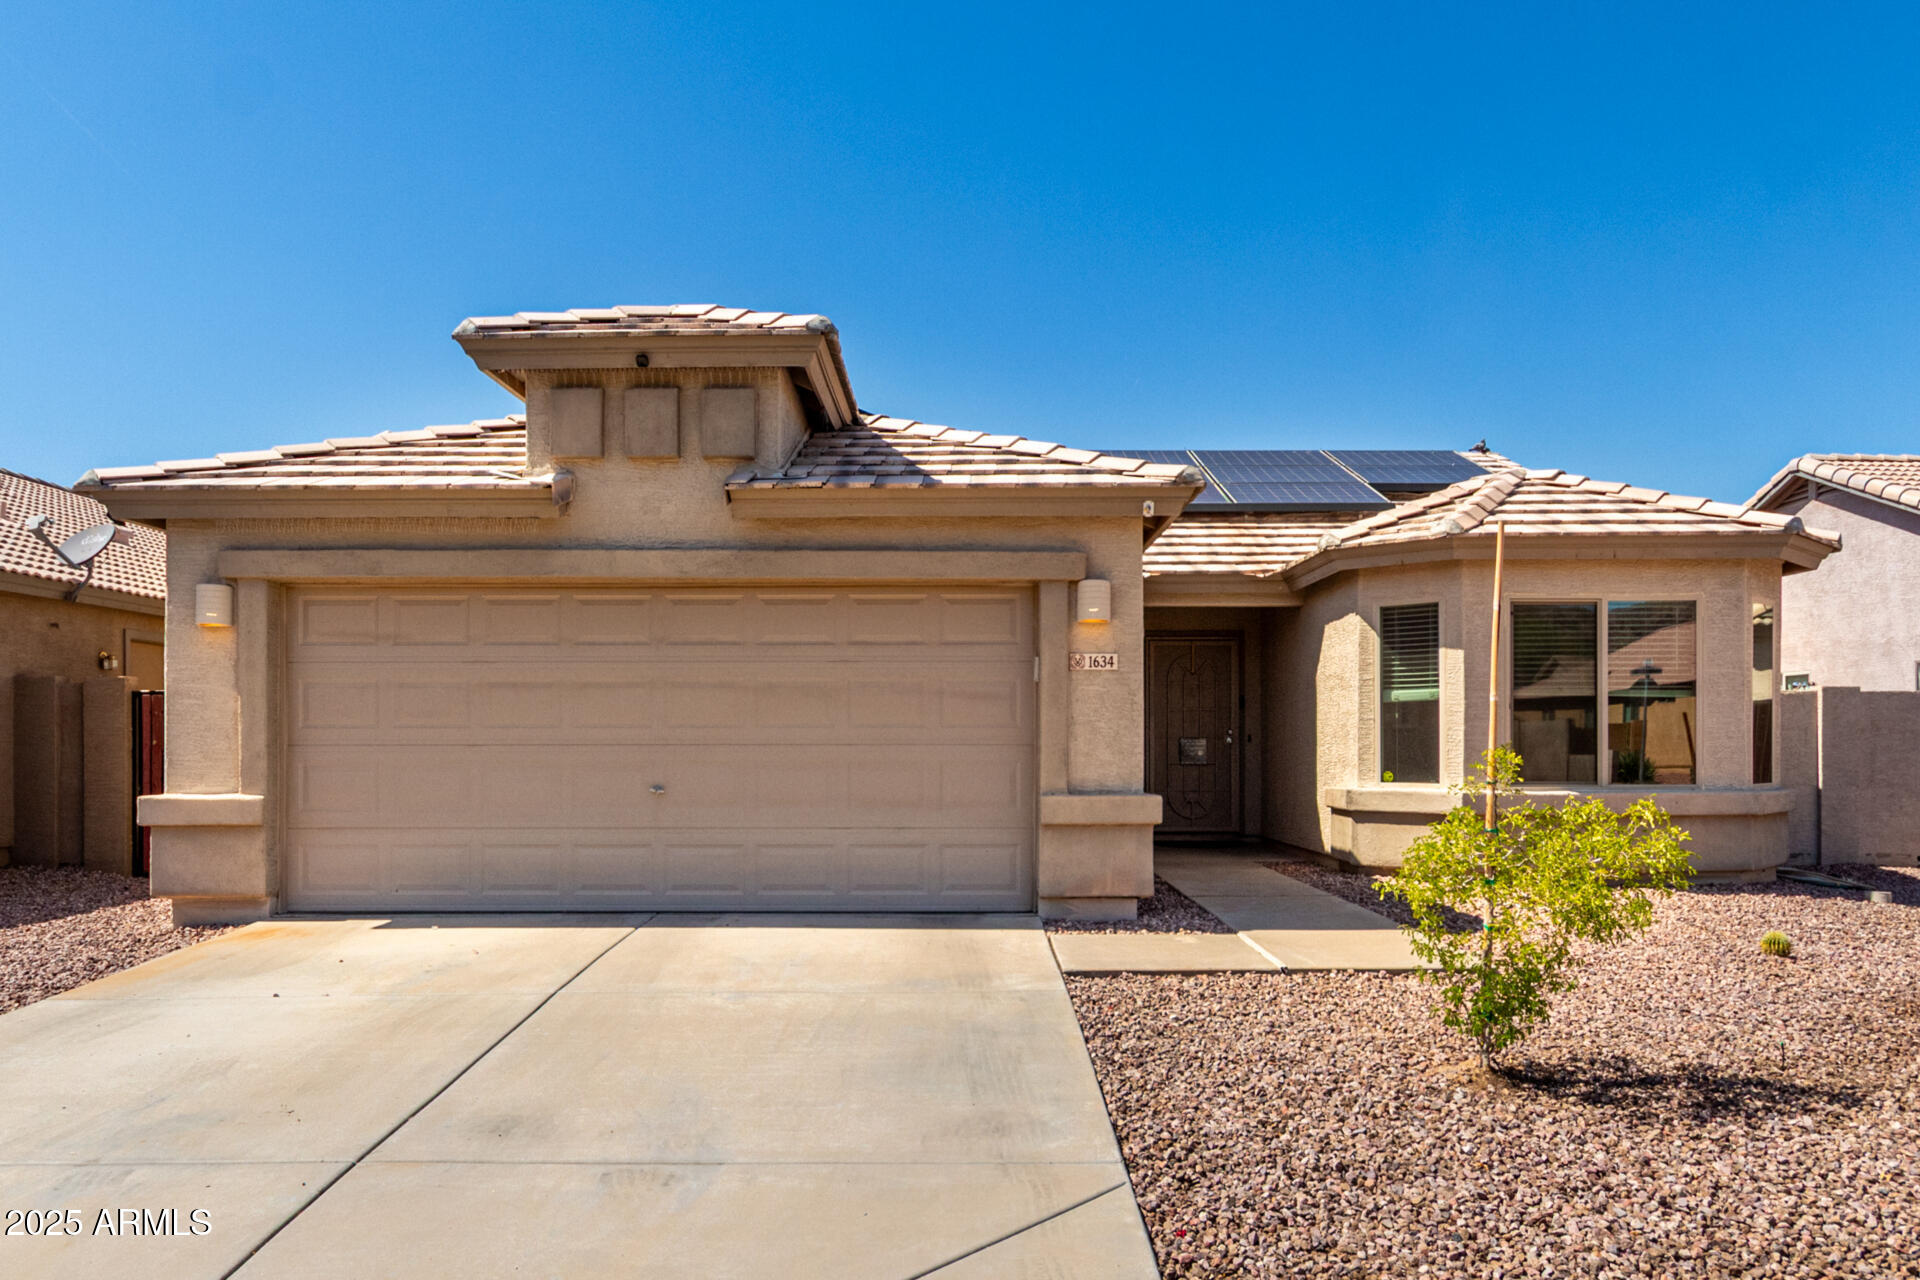
Active
$449,000
3
bds
|
2
ba
|
1,374
sqft
|
built
2003
1634 E Harwell Rd, Phoenix, AZ 85042
$-1,005
Cash flow
-11.7%
Cash-on-Cash Return
3.0%
Cap rate
0.5%
Rent to Value Ratio

Active
$445,000
5
bds
|
3
ba
|
2,196
sqft
|
built
2004
2519 W Burgess Ln, Phoenix, AZ 85041
$-635
Cash flow
-7.4%
Cash-on-Cash Return
4.0%
Cap rate
0.6%
Rent to Value Ratio

Active
$393,000
4
bds
|
3
ba
|
1,941
sqft
|
built
2005
2150 E Sunland Ave, Phoenix, AZ 85040
$-642
Cash flow
-8.5%
Cash-on-Cash Return
3.7%
Cap rate
0.6%
Rent to Value Ratio
Active
$544,000
4
bds
|
2
ba
|
1,672
sqft
|
built
1930
1642 E Turney Ave, Phoenix, AZ 85016
$-1,210
Cash flow
-11.6%
Cash-on-Cash Return
3.0%
Cap rate
0.4%
Rent to Value Ratio

Active
$1,200,000
4
bds
|
3
ba
|
2,847
sqft
|
built
1954
301 W Royal Palm Rd, Phoenix, AZ 85021
$-1,717
Cash flow
-7.5%
Cash-on-Cash Return
4.0%
Cap rate
0.5%
Rent to Value Ratio

Active
$285,000
2
bds
|
2
ba
|
879
sqft
|
built
1983
1449 E Highland Ave, Phoenix, AZ 85014
$-747
Cash flow
-13.7%
Cash-on-Cash Return
2.5%
Cap rate
0.5%
Rent to Value Ratio

Active
$999,500
5
bds
|
4
ba
|
2,729
sqft
|
built
2020
16226 S 35th Dr, Phoenix, AZ 85045
$-2,746
Cash flow
-14.3%
Cash-on-Cash Return
2.4%
Cap rate
0.4%
Rent to Value Ratio
Active
$650,000
4
bds
|
3
ba
|
2,261
sqft
|
built
1953
3330 E Cypress St, Phoenix, AZ 85008
$-804
Cash flow
-6.5%
Cash-on-Cash Return
4.2%
Cap rate
0.6%
Rent to Value Ratio

Active
$1,625,000
4
bds
|
5
ba
|
7,700
sqft
|
built
2001
37218 N 29th Ave, Phoenix, AZ 85086
$-4,100
Cash flow
-13.2%
Cash-on-Cash Return
2.7%
Cap rate
0.4%
Rent to Value Ratio

Active
$459,900
4
bds
|
2
ba
|
1,290
sqft
|
built
1961
4049 N 81st Ave, Phoenix, AZ 85033
$-661
Cash flow
-7.5%
Cash-on-Cash Return
4.0%
Cap rate
0.5%
Rent to Value Ratio

Active
$425,000
2
bds
|
3
ba
|
1,387
sqft
|
built
2016
2315 N 52nd St, Phoenix, AZ 85008
$-827
Cash flow
-10.2%
Cash-on-Cash Return
3.3%
Cap rate
0.6%
Rent to Value Ratio

Active
$349,000
4
bds
|
2
ba
|
1,395
sqft
|
built
1977
2840 W Marlette Ave, Phoenix, AZ 85017
$-345
Cash flow
-5.2%
Cash-on-Cash Return
4.5%
Cap rate
0.6%
Rent to Value Ratio

Active
$397,000
3
bds
|
2
ba
|
1,372
sqft
|
built
1961
2608 W Columbine Dr, Phoenix, AZ 85029
$-237
Cash flow
-3.1%
Cash-on-Cash Return
5.0%
Cap rate
0.6%
Rent to Value Ratio
Active
$309,900
3
bds
|
2
ba
|
1,243
sqft
|
built
1964
2414 W Cholla St, Phoenix, AZ 85029
$-424
Cash flow
-7.1%
Cash-on-Cash Return
4.0%
Cap rate
0.5%
Rent to Value Ratio