Plantation, FL Investment Properties for Sale
Browse homes for sale and investment properties in Plantation, FL. Refine your search by price, property type, or more.
Best cash flowing properties in Plantation, FL
Active
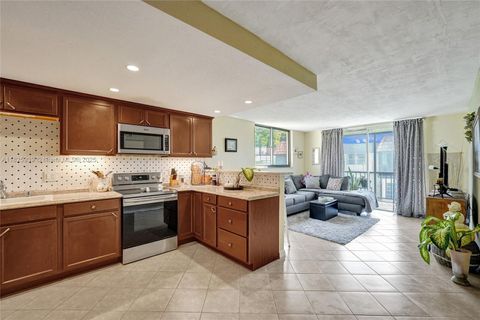
$169,900
1
bds
|
2
ba
|
960
sqft
|
built
1973
7100 NW 17th St, Plantation, FL 33313
$-241
Cash flow
-7.4%
Cash-on-Cash Return
4.4%
Cap rate
1.1%
Rent to Value Ratio
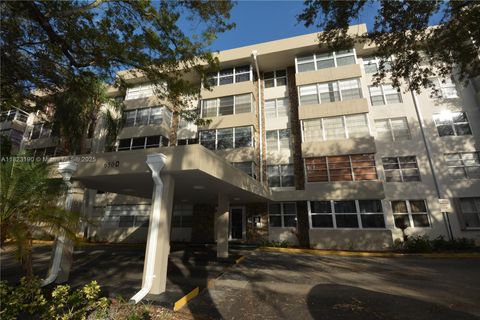
Active
$150,000
1
bds
|
2
ba
|
680
sqft
|
built
1979
6500 Cypress Rd, Plantation, FL 33317
$-288
Cash flow
-10.0%
Cash-on-Cash Return
4.0%
Cap rate
1.1%
Rent to Value Ratio
386 out of 427 properties for sale in Plantation, FL
Limited Results Shown
Create a free account, or log in to reveal all property listings and enjoy the complete experience.

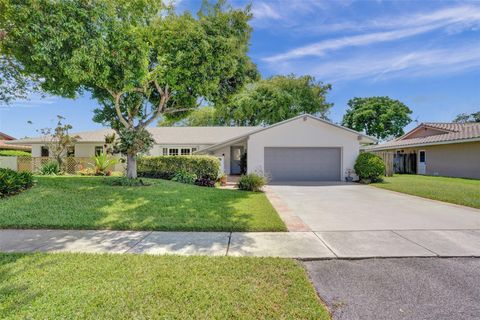
Active
$774,999
3
bds
|
2
ba
|
2,010
sqft
|
built
1979
11600 NW 26th St, Plantation, FL 33323
$-1,435
Cash flow
-9.7%
Cash-on-Cash Return
3.9%
Cap rate
0.7%
Rent to Value Ratio

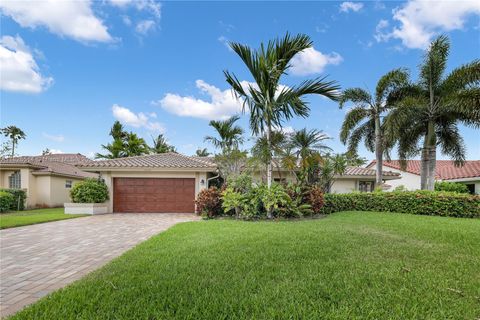
Active
$4,599,000
5
bds
|
4
ba
|
4,905
sqft
|
built
2000
12301 NW 18th St, Plantation, FL 33323
$-19,323
Cash flow
-21.9%
Cash-on-Cash Return
1.2%
Cap rate
0.2%
Rent to Value Ratio

Active
$599,000
3
bds
|
2
ba
|
1,724
sqft
|
built
1972
1321 NW 75th Ter, Plantation, FL 33313
$-827
Cash flow
-7.2%
Cash-on-Cash Return
4.6%
Cap rate
0.7%
Rent to Value Ratio

Active
$775,000
3
bds
|
2
ba
|
1,940
sqft
|
built
1976
770 NW 77th Ave, Plantation, FL 33324
$-1,268
Cash flow
-8.5%
Cash-on-Cash Return
4.3%
Cap rate
0.6%
Rent to Value Ratio
Active
$695,000
3
bds
|
2
ba
|
2,253
sqft
|
built
1977
1521 SW 73rd Ave, Plantation, FL 33317
$-1,485
Cash flow
-11.1%
Cash-on-Cash Return
3.7%
Cap rate
0.5%
Rent to Value Ratio
Active
$889,000
4
bds
|
3
ba
|
2,604
sqft
|
built
1989
10070 NW 10th St, Plantation, FL 33322
$-2,045
Cash flow
-12.0%
Cash-on-Cash Return
3.5%
Cap rate
0.5%
Rent to Value Ratio

Active
$875,000
3
bds
|
3
ba
|
1,949
sqft
|
built
1989
820 SW 87th Ter, Plantation, FL 33324
$-2,221
Cash flow
-13.2%
Cash-on-Cash Return
3.2%
Cap rate
0.5%
Rent to Value Ratio

Active
$945,000
4
bds
|
3
ba
|
3,009
sqft
|
built
1994
649 NW 110th Ave, Plantation, FL 33324
$-2,026
Cash flow
-11.2%
Cash-on-Cash Return
3.7%
Cap rate
0.6%
Rent to Value Ratio
Active
$295,000
2
bds
|
2
ba
|
903
sqft
|
built
1986
9852 NW 3rd Ct, Plantation, FL 33324
$-912
Cash flow
-16.1%
Cash-on-Cash Return
2.6%
Cap rate
0.7%
Rent to Value Ratio
Active
$220,000
2
bds
|
2
ba
|
1,370
sqft
|
built
1981
6800 Cypress Rd, Plantation, FL 33317
$-732
Cash flow
-17.4%
Cash-on-Cash Return
2.2%
Cap rate
1.0%
Rent to Value Ratio

Active
$1,199,000
4
bds
|
3
ba
|
2,140
sqft
|
built
1958
5890 SW 13th St, Plantation, FL 33317
$-3,411
Cash flow
-14.8%
Cash-on-Cash Return
2.7%
Cap rate
0.4%
Rent to Value Ratio

Active
$1,075,000
4
bds
|
3
ba
|
2,358
sqft
|
built
1977
431 SW 112th Ave, Plantation, FL 33325
$-1,702
Cash flow
-8.3%
Cash-on-Cash Return
4.4%
Cap rate
0.6%
Rent to Value Ratio

Active
$340,000
3
bds
|
2
ba
|
1,150
sqft
|
built
1990
10631 NW 14th St, Plantation, FL 33322
$-928
Cash flow
-14.2%
Cash-on-Cash Return
3.0%
Cap rate
0.7%
Rent to Value Ratio

Active
$769,900
4
bds
|
3
ba
|
2,691
sqft
|
built
1989
1838 NW 94th Ave, Plantation, FL 33322
$-1,458
Cash flow
-9.9%
Cash-on-Cash Return
4.0%
Cap rate
0.6%
Rent to Value Ratio
Active
$349,000
3
bds
|
2
ba
|
1,150
sqft
|
built
1991
10730 NW 14th St, Plantation, FL 33322
$-1,095
Cash flow
-16.4%
Cash-on-Cash Return
2.5%
Cap rate
0.7%
Rent to Value Ratio

Active
$874,900
4
bds
|
2
ba
|
2,397
sqft
|
built
1985
9700 NW 10th St, Plantation, FL 33322
$-2,259
Cash flow
-13.5%
Cash-on-Cash Return
3.0%
Cap rate
0.5%
Rent to Value Ratio
Active
$949,000
4
bds
|
2
ba
|
1,764
sqft
|
built
1969
1321 SW 57th Ave, Plantation, FL 33317
$-2,969
Cash flow
-16.3%
Cash-on-Cash Return
2.5%
Cap rate
0.4%
Rent to Value Ratio
Active
$700,000
3
bds
|
2
ba
|
1,707
sqft
|
built
1977
9070 NW 16th St, Plantation, FL 33322
$-2,171
Cash flow
-16.2%
Cash-on-Cash Return
2.5%
Cap rate
0.5%
Rent to Value Ratio

Active
$175,500
2
bds
|
2
ba
|
1,120
sqft
|
built
1975
6555 W Broward Blvd, Plantation, FL 33317
$-617
Cash flow
-18.3%
Cash-on-Cash Return
1.9%
Cap rate
1.1%
Rent to Value Ratio

Active
$1,090,000
5
bds
|
3
ba
|
3,555
sqft
|
built
1968
581 W Tropical Way, Plantation, FL 33317
$-2,652
Cash flow
-12.7%
Cash-on-Cash Return
3.3%
Cap rate
0.5%
Rent to Value Ratio

Active
$860,000
5
bds
|
3
ba
|
2,472
sqft
|
built
1981
1460 NW 99th Ave, Plantation, FL 33322
$-1,809
Cash flow
-11.0%
Cash-on-Cash Return
3.7%
Cap rate
0.5%
Rent to Value Ratio
Active
$705,000
3
bds
|
2
ba
|
2,195
sqft
|
built
1973
156 SW 126th Ave, Plantation, FL 33325
$-2,098
Cash flow
-15.5%
Cash-on-Cash Return
2.7%
Cap rate
0.5%
Rent to Value Ratio

Active
$1,199,000
5
bds
|
4
ba
|
3,000
sqft
|
built
1995
10948 NW 5th Ct, Plantation, FL 33324
$-3,153
Cash flow
-13.7%
Cash-on-Cash Return
3.1%
Cap rate
0.5%
Rent to Value Ratio
Active
$750,000
3
bds
|
2
ba
|
2,082
sqft
|
built
1977
1600 SW 72nd Ave, Plantation, FL 33317
$-2,270
Cash flow
-15.8%
Cash-on-Cash Return
2.6%
Cap rate
0.5%
Rent to Value Ratio

Active
$775,000
4
bds
|
3
ba
|
2,011
sqft
|
built
1961
280 SW 63rd Ave, Plantation, FL 33317
$-1,624
Cash flow
-10.9%
Cash-on-Cash Return
3.8%
Cap rate
0.5%
Rent to Value Ratio
Active
$510,000
3
bds
|
2
ba
|
1,548
sqft
|
built
1987
464 NW 94th Ter, Plantation, FL 33324
$-1,048
Cash flow
-10.7%
Cash-on-Cash Return
3.8%
Cap rate
0.7%
Rent to Value Ratio

Active
$179,000
2
bds
|
2
ba
|
1,120
sqft
|
built
1974
6855 W Broward Blvd, Plantation, FL 33317
$-613
Cash flow
-17.9%
Cash-on-Cash Return
2.2%
Cap rate
1.1%
Rent to Value Ratio
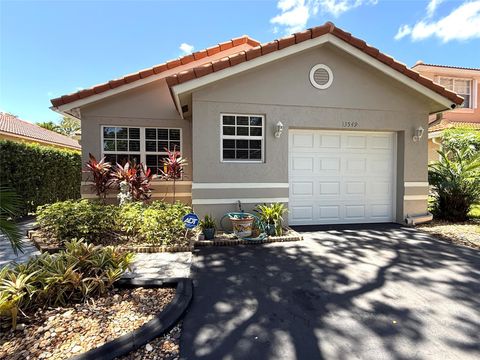
Active
$589,000
3
bds
|
2
ba
|
1,452
sqft
|
built
1993
13549 NW 5th Ct, Plantation, FL 33325
$-1,234
Cash flow
-10.9%
Cash-on-Cash Return
3.8%
Cap rate
0.5%
Rent to Value Ratio
Active
$899,899
4
bds
|
2
ba
|
2,472
sqft
|
built
1988
1581 NW 100th Way, Plantation, FL 33322
$-2,681
Cash flow
-15.5%
Cash-on-Cash Return
2.7%
Cap rate
0.4%
Rent to Value Ratio
Active
$850,000
4
bds
|
3
ba
|
2,643
sqft
|
built
1988
1180 NW 100th Way, Plantation, FL 33322
$-2,209
Cash flow
-13.6%
Cash-on-Cash Return
3.1%
Cap rate
0.5%
Rent to Value Ratio

Active
$798,500
4
bds
|
2
ba
|
1,936
sqft
|
built
1972
7011 SW 11th St, Plantation, FL 33317
$-1,969
Cash flow
-12.9%
Cash-on-Cash Return
3.3%
Cap rate
0.6%
Rent to Value Ratio

Active
$359,000
3
bds
|
3
ba
|
1,520
sqft
|
built
1980
8216 NW 8th St, Plantation, FL 33324
$-1,099
Cash flow
-16.0%
Cash-on-Cash Return
2.5%
Cap rate
0.8%
Rent to Value Ratio
Active
$315,000
3
bds
|
3
ba
|
1,770
sqft
|
built
1980
8239 NW 8th Ct, Plantation, FL 33324
$-866
Cash flow
-14.3%
Cash-on-Cash Return
2.9%
Cap rate
0.9%
Rent to Value Ratio

Active
$229,900
1
bds
|
1
ba
|
743
sqft
|
built
1991
12510 Vista Isles Dr, Plantation, FL 33325
$-642
Cash flow
-14.6%
Cash-on-Cash Return
2.9%
Cap rate
0.9%
Rent to Value Ratio
Active
$3,950,000
7
bds
|
6
ba
|
5,828
sqft
|
built
2016
11901 NW 12th St, Plantation, FL 33323
$-18,931
Cash flow
-25.0%
Cash-on-Cash Return
0.5%
Cap rate
0.2%
Rent to Value Ratio

Active
$425,000
2
bds
|
3
ba
|
1,550
sqft
|
built
1974
700 E Coco Plum Cir, Plantation, FL 33324
$-804
Cash flow
-9.9%
Cash-on-Cash Return
4.0%
Cap rate
0.8%
Rent to Value Ratio

Active
$849,900
5
bds
|
3
ba
|
2,863
sqft
|
built
2003
12471 SW 1st St, Plantation, FL 33325
$-1,655
Cash flow
-10.2%
Cash-on-Cash Return
3.9%
Cap rate
0.7%
Rent to Value Ratio
Active
$3,800,000
5
bds
|
6
ba
|
5,492
sqft
|
built
1994
11720 NW 9th St, Plantation, FL 33325
$-13,991
Cash flow
-19.2%
Cash-on-Cash Return
1.7%
Cap rate
0.3%
Rent to Value Ratio