Portage, MI Investment Properties for Sale
Browse homes for sale and investment properties in Portage, MI. Refine your search by price, property type, or more.
Best cash flowing properties in Portage, MI
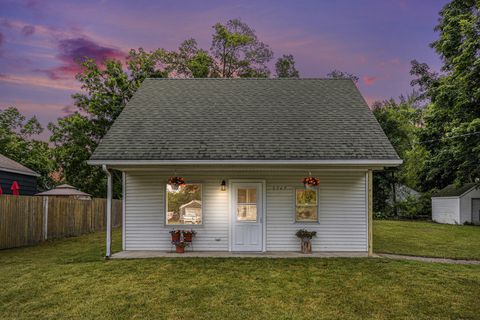
Active
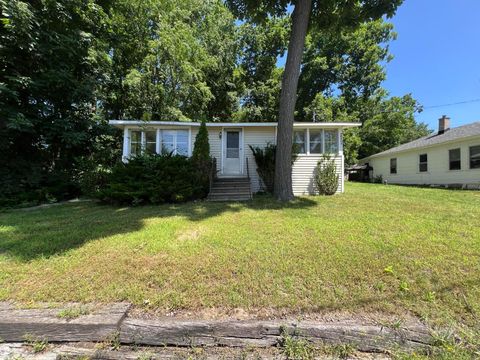
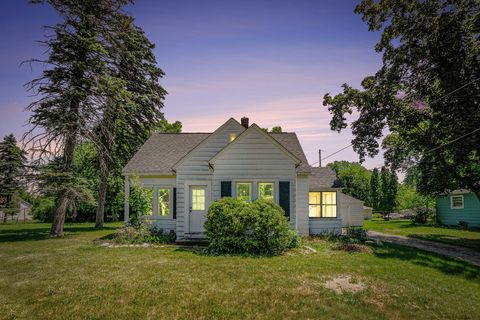
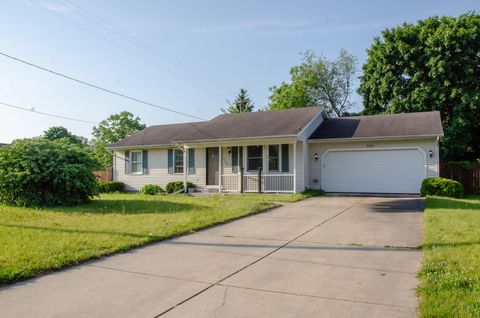
$99,900
2
bds
|
1
ba
|
930
sqft
|
built
1950
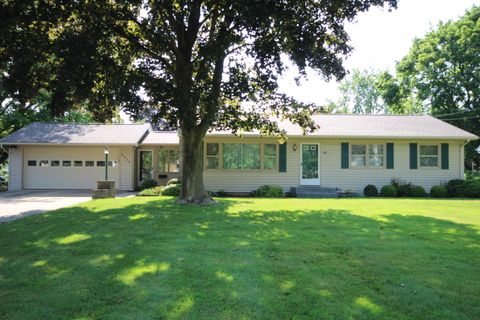
10904 Cora Dr, Portage, MI 49002
$265
Cash flow
13.8%
Cash-on-Cash Return
9.3%
Cap rate
1.3%
Rent to Value Ratio
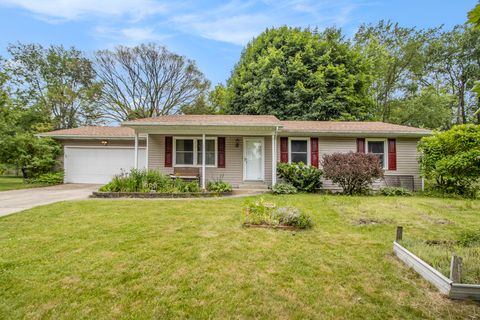
Active
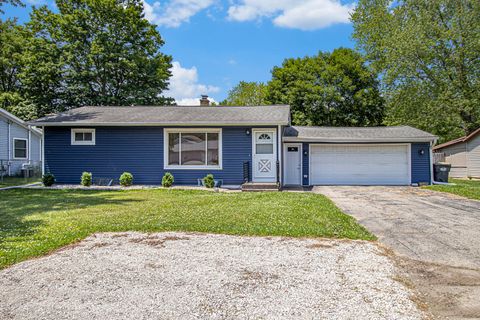
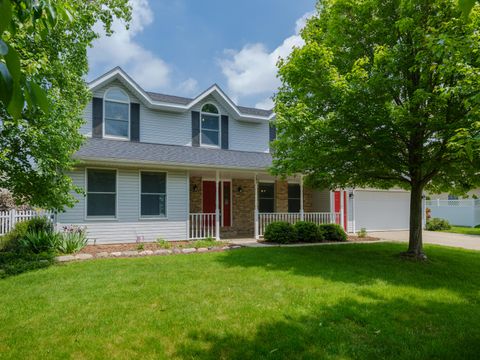
$215,000
3
bds
|
1
ba
|
1,176
sqft
|
built
1959
8814 S Sprinkle Rd, Portage, MI 49002
$-205
Cash flow
-5.0%
Cash-on-Cash Return
5.1%
Cap rate
0.7%
Rent to Value Ratio
72 out of 75 properties for sale in Portage, MI
Limited Results Shown
Create a free account, or log in to reveal all property listings and enjoy the complete experience.
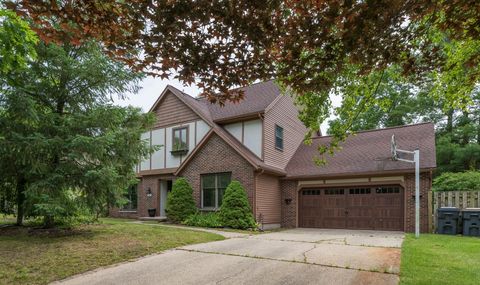
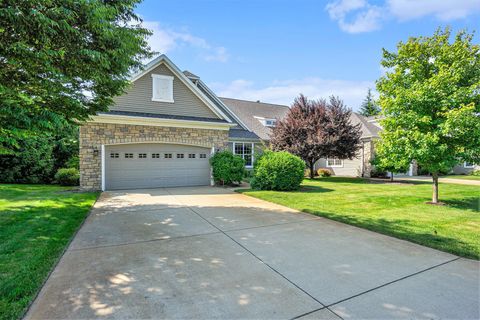
Active
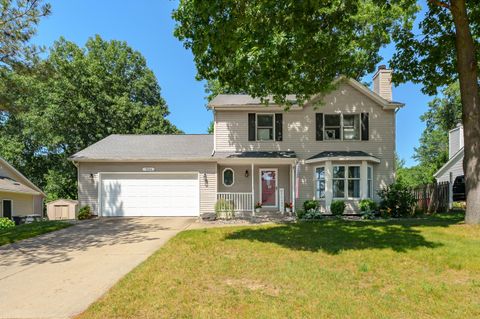
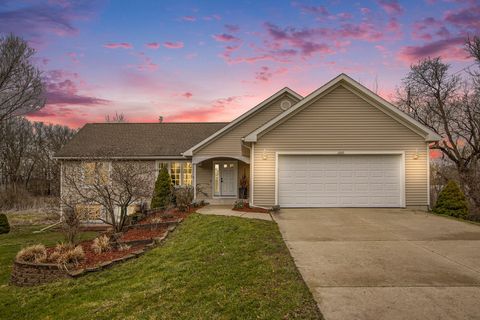
$365,000
4
bds
|
3
ba
|
2,411
sqft
|
built
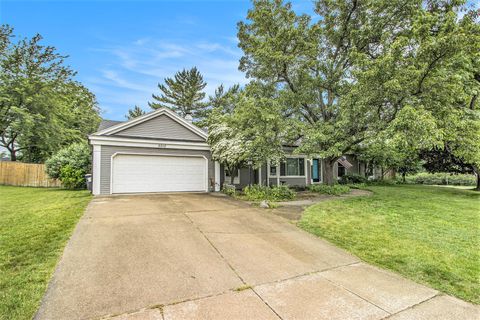
1990
7154 Sandpiper St, Portage, MI 49024
$-570
Cash flow
-8.1%
Cash-on-Cash Return
4.3%
Cap rate
0.7%
Rent to Value Ratio
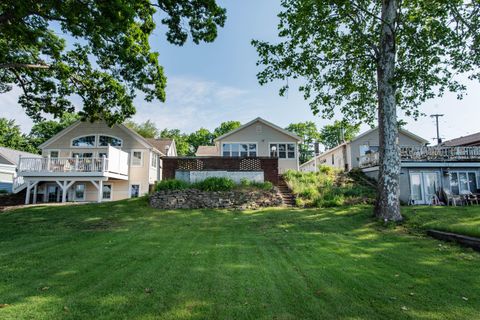
Active
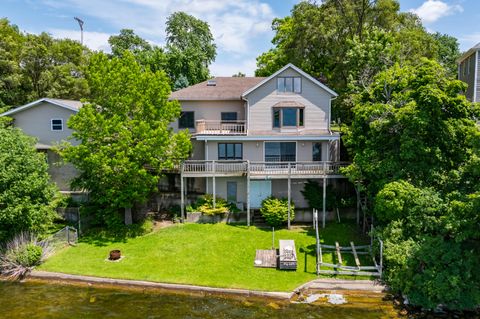
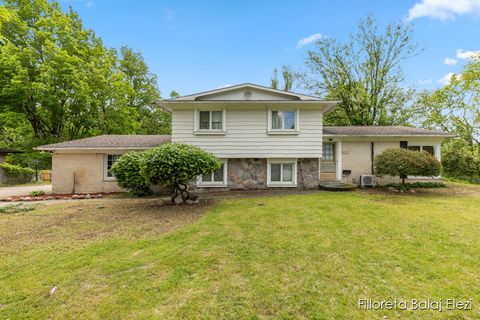
$530,000
bds
|
0
ba
|
0
sqft
|
built
1974
10902 Portage Rd, Portage, MI 49002
$-1,523
Cash flow
-15.0%
Cash-on-Cash Return
2.7%
Cap rate
0.5%
Rent to Value Ratio

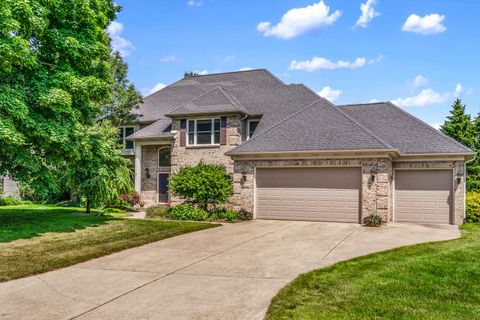
Active
$625,000
5
bds
|
5
ba
|
4,248
sqft
|
built
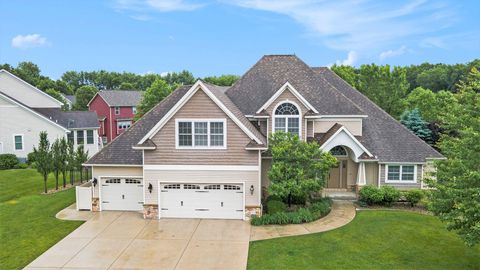
2006
6380 Mc Gillicuddy Ln, Portage, MI 49024
$-2,116
Cash flow
-17.7%
Cash-on-Cash Return
2.2%
Cap rate
0.5%
Rent to Value Ratio
Active
$239,999
3
bds
|
2
ba
|
1,034
sqft
|
built
1941
7907 Lovers Ln, Portage, MI 49002
$-533
Cash flow
-11.6%
Cash-on-Cash Return
3.5%
Cap rate
0.6%
Rent to Value Ratio
Active
$430,000
4
bds
|
3
ba
|
3,772
sqft
|
built
1978
6615 Pleasantview Dr, Portage, MI 49024
$-940
Cash flow
-11.4%
Cash-on-Cash Return
3.5%
Cap rate
0.6%
Rent to Value Ratio
Active
$425,000
5
bds
|
3
ba
|
3,084
sqft
|
built
1975
442 Pinewood Cir, Portage, MI 49002
$-909
Cash flow
-11.2%
Cash-on-Cash Return
3.7%
Cap rate
0.6%
Rent to Value Ratio
Active
$698,900
5
bds
|
4
ba
|
3,861
sqft
|
built
1991
7639 Dunross Dr, Portage, MI 49024
$-2,281
Cash flow
-17.0%
Cash-on-Cash Return
2.2%
Cap rate
0.5%
Rent to Value Ratio

Active
$244,900
3
bds
|
1
ba
|
1,920
sqft
|
built
1960
2120 Hemlock Ave, Portage, MI 49024
$-281
Cash flow
-6.0%
Cash-on-Cash Return
4.9%
Cap rate
0.7%
Rent to Value Ratio

Active
$469,900
5
bds
|
4
ba
|
3,263
sqft
|
built
2016
3935 Riley Rdg, Portage, MI 49024
$-1,261
Cash flow
-14.0%
Cash-on-Cash Return
2.9%
Cap rate
0.6%
Rent to Value Ratio
Active
$950,000
4
bds
|
4
ba
|
3,796
sqft
|
built
2001
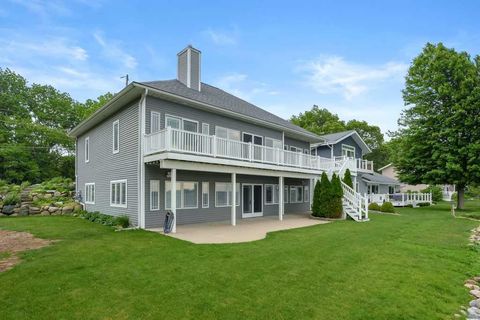
3730 E Shore Dr, Portage, MI 49002
$-2,969
Cash flow
-16.3%
Cash-on-Cash Return
2.4%
Cap rate
0.3%
Rent to Value Ratio
Active
$669,900
5
bds
|
5
ba
|
3,998
sqft
|
built
2012
1225 Bear Lake Cir, Portage, MI 49024
$-2,368
Cash flow
-18.4%
Cash-on-Cash Return
1.9%
Cap rate
0.5%
Rent to Value Ratio
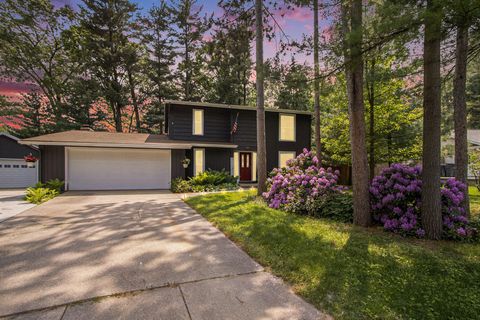
Active
$309,900
3
bds
|
3
ba
|
1,794
sqft
|
built
1975
5012 Windyridge Dr, Portage, MI 49002
$-395
Cash flow
-6.7%
Cash-on-Cash Return
4.6%
Cap rate
0.7%
Rent to Value Ratio
Active
$295,000
3
bds
|
2
ba
|
2,007
sqft
|
built
1959
6426 Westchester St, Portage, MI 49024
$-674
Cash flow
-11.9%
Cash-on-Cash Return
3.4%
Cap rate
0.5%
Rent to Value Ratio
Active
$597,000
3
bds
|
3
ba
|
3,978
sqft
|
built
2012
8842 Oakland Hills Cir, Portage, MI 49024
$-2,669
Cash flow
-23.3%
Cash-on-Cash Return
0.9%
Cap rate
0.5%
Rent to Value Ratio

Active
$429,900
4
bds
|
3
ba
|
2,258
sqft
|
built
1975
10174 Point O Woods Dr, Portage, MI 49002
$-879
Cash flow
-10.7%
Cash-on-Cash Return
3.7%
Cap rate
0.6%
Rent to Value Ratio
Active
$299,500
4
bds
|
2
ba
|
2,273
sqft
|
built
1988
4525 Briarhill Dr, Portage, MI 49024
$-483
Cash flow
-8.4%
Cash-on-Cash Return
4.2%
Cap rate
0.7%
Rent to Value Ratio

Active
$355,000
3
bds
|
3
ba
|
1,922
sqft
|
built
1870
2106 Forest Dr, Portage, MI 49002
$-577
Cash flow
-8.5%
Cash-on-Cash Return
4.3%
Cap rate
0.7%
Rent to Value Ratio
Active
$210,000
3
bds
|
1
ba
|
864
sqft
|
built
1940
5747 Utah Ave, Portage, MI 49024
$-339
Cash flow
-8.4%
Cash-on-Cash Return
4.2%
Cap rate
0.7%
Rent to Value Ratio

Active
$349,900
4
bds
|
3
ba
|
1,830
sqft
|
built
2022
7216 Heartwood Ct, Portage, MI 49002
$-1,162
Cash flow
-17.3%
Cash-on-Cash Return
2.2%
Cap rate
0.6%
Rent to Value Ratio
Active
$365,000
2
bds
|
1
ba
|
1,064
sqft
|
built
1930
5134 Deep Point Dr, Portage, MI 49002
$-1,149
Cash flow
-16.4%
Cash-on-Cash Return
2.4%
Cap rate
0.4%
Rent to Value Ratio
Active
$605,000
3
bds
|
4
ba
|
4,355
sqft
|
built
2006
8734 Oakland Hills Cir, Portage, MI 49024
$-2,498
Cash flow
-21.5%
Cash-on-Cash Return
1.2%
Cap rate
0.5%
Rent to Value Ratio
Active
$449,500
4
bds
|
3
ba
|
2,980
sqft
|
built
2006
9908 Mariner St, Portage, MI 49002
$-1,217
Cash flow
-14.1%
Cash-on-Cash Return
3.0%
Cap rate
0.6%
Rent to Value Ratio
Active
$299,000
3
bds
|
2
ba
|
1,996
sqft
|
built
1959
721 Karendale Ave, Portage, MI 49002
$-649
Cash flow
-11.3%
Cash-on-Cash Return
3.5%
Cap rate
0.6%
Rent to Value Ratio
Active
$724,900
3
bds
|
2
ba
|
1,440
sqft
|
built
1990
9715 Woodlawn Dr, Portage, MI 49002
$-2,871
Cash flow
-20.7%
Cash-on-Cash Return
1.4%
Cap rate
0.3%
Rent to Value Ratio

Active
$338,900
5
bds
|
3
ba
|
2,920
sqft
|
built
1965
6737 Cypress St, Portage, MI 49024
$-678
Cash flow
-10.4%
Cash-on-Cash Return
3.9%
Cap rate
0.6%
Rent to Value Ratio

Active
$285,000
4
bds
|
2
ba
|
2,166
sqft
|
built
1971
5928 Meredith St, Portage, MI 49002
$-346
Cash flow
-6.3%
Cash-on-Cash Return
4.8%
Cap rate
0.8%
Rent to Value Ratio

Active
$899,900
4
bds
|
3
ba
|
3,339
sqft
|
built
2008
2713 Woodbine Ave, Portage, MI 49002
$-3,106
Cash flow
-18.0%
Cash-on-Cash Return
2.1%
Cap rate
0.5%
Rent to Value Ratio
Active
$235,000
3
bds
|
1
ba
|
1,052
sqft
|
built
1998
2109 Rosewood Ave, Portage, MI 49024
$-484
Cash flow
-10.7%
Cash-on-Cash Return
3.8%
Cap rate
0.7%
Rent to Value Ratio
Active
$399,900
4
bds
|
3
ba
|
2,694
sqft
|
built
1994
284 Cherryview Dr, Portage, MI 49024
$-929
Cash flow
-12.1%
Cash-on-Cash Return
3.5%
Cap rate
0.7%
Rent to Value Ratio
Active
$385,000
4
bds
|
2
ba
|
2,335
sqft
|
built
2007
1200 Schuring Rd, Portage, MI 49024
$-1,107
Cash flow
-15.0%
Cash-on-Cash Return
2.8%
Cap rate
0.6%
Rent to Value Ratio

Active
$949,900
4
bds
|
3
ba
|
2,509
sqft
|
built
2021
1335 Panama St, Portage, MI 49002
$-4,284
Cash flow
-23.5%
Cash-on-Cash Return
0.9%
Cap rate
0.2%
Rent to Value Ratio
Active
$245,000
4
bds
|
3
ba
|
2,348
sqft
|
built
1962
421 Sunview Ave, Portage, MI 49002
$-511
Cash flow
-10.9%
Cash-on-Cash Return
3.8%
Cap rate
0.7%
Rent to Value Ratio

Active
$289,900
4
bds
|
2
ba
|
2,614
sqft
|
built
1961
6026 Salem Ln, Portage, MI 49002
$-514
Cash flow
-9.3%
Cash-on-Cash Return
4.1%
Cap rate
0.6%
Rent to Value Ratio
Active
$614,999
3
bds
|
2
ba
|
1,883
sqft
|
built
1965
2019 Lakeview Dr, Portage, MI 49002
$-2,024
Cash flow
-17.2%
Cash-on-Cash Return
2.3%
Cap rate
0.5%
Rent to Value Ratio
Active
$1,989,000
5
bds
|
5
ba
|
4,820
sqft
|
built
2013
9021 Portage Rd, Portage, MI 49002
$-8,245
Cash flow
-21.6%
Cash-on-Cash Return
1.3%
Cap rate
0.3%
Rent to Value Ratio
Active
$450,000
4
bds
|
4
ba
|
3,199
sqft
|
built
1997
10420 Roger St, Portage, MI 49002
$-1,131
Cash flow
-13.1%
Cash-on-Cash Return
3.2%
Cap rate
0.6%
Rent to Value Ratio

Active
$260,000
3
bds
|
2
ba
|
1,248
sqft
|
built
1920
10933 Portage Rd, Portage, MI 49002
$-395
Cash flow
-7.9%
Cash-on-Cash Return
4.4%
Cap rate
0.8%
Rent to Value Ratio
Active
$289,900
2
bds
|
1
ba
|
876
sqft
|
built
1919
4830 Deep Point Dr, Portage, MI 49002
$-830
Cash flow
-14.9%
Cash-on-Cash Return
2.8%
Cap rate
0.6%
Rent to Value Ratio