Rockford, MI Investment Properties for Sale
Browse homes for sale and investment properties in Rockford, MI. Refine your search by price, property type, or more.
Best cash flowing properties in Rockford, MI

Active
$205,900
2
bds
|
1
ba
|
852
sqft
|
built
1920
6773 Kitson Dr NE, Rockford, MI 49341
$88
Cash flow
2.2%
Cash-on-Cash Return
6.8%
Cap rate
0.9%
Rent to Value Ratio

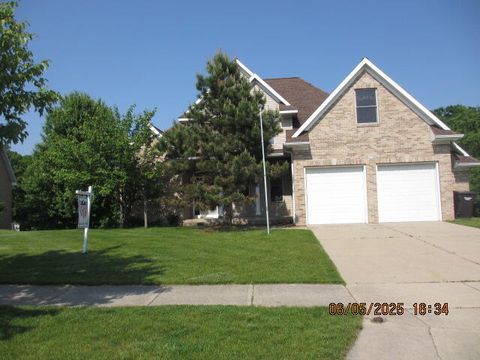
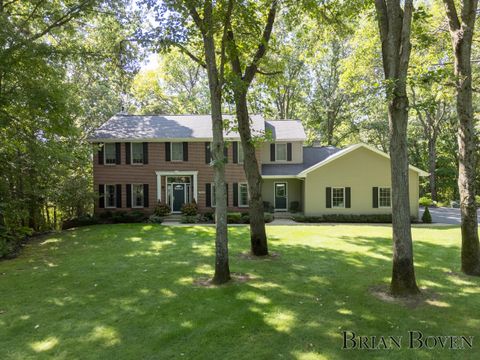
Active
$339,900
6
bds
|
4
ba
|
4,425
sqft
|
built
1965
11391 Wellman Ave NE, Rockford, MI 49341
$-174
Cash flow
-2.7%
Cash-on-Cash Return
5.7%
Cap rate
0.7%
Rent to Value Ratio
38 out of 57 properties for sale in Rockford, MI
Limited Results Shown
Create a free account, or log in to reveal all property listings and enjoy the complete experience.
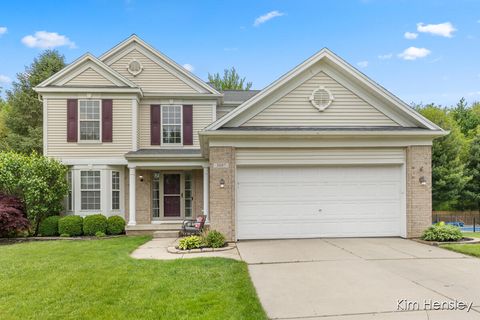
Active
$485,000
4
bds
|
4
ba
|
3,253
sqft
|
built
2000
3687 Fraser St NE, Rockford, MI 49341
$-806
Cash flow
-8.7%
Cash-on-Cash Return
4.3%
Cap rate
0.7%
Rent to Value Ratio
Active
$550,000
4
bds
|
4
ba
|
5,263
sqft
|
built
2001
150 Glen Carin Dr NE, Rockford, MI 49341
$-1,215
Cash flow
-11.5%
Cash-on-Cash Return
3.6%
Cap rate
0.6%
Rent to Value Ratio

Active
$499,900
5
bds
|
3
ba
|
2,639
sqft
|
built
2000
369 Glenwoods Ct NE, Rockford, MI 49341
$-1,408
Cash flow
-14.7%
Cash-on-Cash Return
2.9%
Cap rate
0.5%
Rent to Value Ratio
Active
$349,900
3
bds
|
3
ba
|
1,511
sqft
|
built
2022
6678 S Square Ln, Rockford, MI 49341
$-741
Cash flow
-11.0%
Cash-on-Cash Return
3.7%
Cap rate
0.7%
Rent to Value Ratio

Active
$649,000
4
bds
|
3
ba
|
3,245
sqft
|
built
1989
3223 Riverwoods Dr NE, Rockford, MI 49341
$-1,676
Cash flow
-13.5%
Cash-on-Cash Return
3.2%
Cap rate
0.5%
Rent to Value Ratio

Active
$355,000
3
bds
|
3
ba
|
1,511
sqft
|
built
2022
6857 Old Town Square Pvt NE, Rockford, MI 49341
$-829
Cash flow
-12.2%
Cash-on-Cash Return
3.5%
Cap rate
0.7%
Rent to Value Ratio

Active
$460,000
4
bds
|
3
ba
|
2,949
sqft
|
built
2016
6635 Ramsdell Dr NE, Rockford, MI 49341
$-916
Cash flow
-10.4%
Cash-on-Cash Return
3.9%
Cap rate
0.5%
Rent to Value Ratio

Active
$1,500,000
7
bds
|
5
ba
|
7,524
sqft
|
built
1999
6374 Blakely Dr NE, Rockford, MI 49341
$-5,519
Cash flow
-19.2%
Cash-on-Cash Return
1.8%
Cap rate
0.3%
Rent to Value Ratio

Active
$389,900
3
bds
|
2
ba
|
1,532
sqft
|
built
1980
12321 Stultz St NE, Rockford, MI 49341
$-675
Cash flow
-9.0%
Cash-on-Cash Return
4.2%
Cap rate
0.6%
Rent to Value Ratio

Active
$1,150,000
5
bds
|
4
ba
|
3,898
sqft
|
built
2024
8780 Bentham Ct, Rockford, MI 49341
$-3,055
Cash flow
-13.9%
Cash-on-Cash Return
3.1%
Cap rate
0.4%
Rent to Value Ratio

Active
$450,000
4
bds
|
4
ba
|
2,610
sqft
|
built
2003
552 N Creek Ct NE, Rockford, MI 49341
$-1,027
Cash flow
-11.9%
Cash-on-Cash Return
3.5%
Cap rate
0.6%
Rent to Value Ratio

Active
$564,900
5
bds
|
4
ba
|
2,838
sqft
|
built
2023
623 Elstar Dr, Rockford, MI 49341
$-1,775
Cash flow
-16.4%
Cash-on-Cash Return
2.5%
Cap rate
0.5%
Rent to Value Ratio

Active
$475,000
3
bds
|
4
ba
|
2,575
sqft
|
built
2001
6533 Cannon Farms Dr NE, Rockford, MI 49341
$-931
Cash flow
-10.2%
Cash-on-Cash Return
3.9%
Cap rate
0.6%
Rent to Value Ratio

Active
$539,900
4
bds
|
4
ba
|
2,812
sqft
|
built
2005
587 Legacy Ct NE, Rockford, MI 49341
$-1,246
Cash flow
-12.0%
Cash-on-Cash Return
3.5%
Cap rate
0.6%
Rent to Value Ratio

Active
$1,550,000
5
bds
|
4
ba
|
4,006
sqft
|
built
1991
6574 Gran Via Dr NE, Rockford, MI 49341
$-6,056
Cash flow
-20.4%
Cash-on-Cash Return
1.6%
Cap rate
0.3%
Rent to Value Ratio

Active
$724,900
5
bds
|
4
ba
|
3,739
sqft
|
built
1986
6269 Egypt Valley Ave NE, Rockford, MI 49341
$-1,729
Cash flow
-12.4%
Cash-on-Cash Return
3.4%
Cap rate
0.5%
Rent to Value Ratio

Active
$765,000
4
bds
|
4
ba
|
3,946
sqft
|
built
2024
6758 Summer Meadows Dr NE, Rockford, MI 49341
$-2,154
Cash flow
-14.7%
Cash-on-Cash Return
2.9%
Cap rate
0.4%
Rent to Value Ratio

Active
$345,000
4
bds
|
2
ba
|
1,896
sqft
|
built
1989
6284 Kuttshill Dr NE, Rockford, MI 49341
$-383
Cash flow
-5.8%
Cash-on-Cash Return
4.9%
Cap rate
0.7%
Rent to Value Ratio

Active
$775,000
4
bds
|
2
ba
|
1,657
sqft
|
built
1931
8779 Je Ne Be Dr NE, Rockford, MI 49341
$-2,463
Cash flow
-16.6%
Cash-on-Cash Return
2.5%
Cap rate
0.5%
Rent to Value Ratio

Active
$219,000
1
bds
|
1
ba
|
926
sqft
|
built
1995
157 Hunters Ln NE, Rockford, MI 49341
$-426
Cash flow
-10.1%
Cash-on-Cash Return
3.9%
Cap rate
0.7%
Rent to Value Ratio

Active
$524,900
5
bds
|
4
ba
|
2,702
sqft
|
built
1994
5348 Cristo Dr NE, Rockford, MI 49341
$-935
Cash flow
-9.3%
Cash-on-Cash Return
4.1%
Cap rate
0.6%
Rent to Value Ratio

Active
$674,900
5
bds
|
4
ba
|
3,509
sqft
|
built
1997
9953 10 Mile Rd NE, Rockford, MI 49341
$-2,128
Cash flow
-16.5%
Cash-on-Cash Return
2.5%
Cap rate
0.4%
Rent to Value Ratio
Active
$339,900
6
bds
|
4
ba
|
4,425
sqft
|
built
1965
11391 Wellman Ave NE, Rockford, MI 49341
$-174
Cash flow
-2.7%
Cash-on-Cash Return
5.7%
Cap rate
0.7%
Rent to Value Ratio
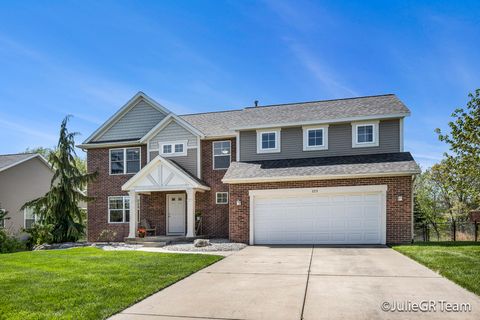
Active
$499,900
4
bds
|
4
ba
|
3,056
sqft
|
built
2005
223 Highlander Dr NE, Rockford, MI 49341
$-1,144
Cash flow
-11.9%
Cash-on-Cash Return
3.5%
Cap rate
0.6%
Rent to Value Ratio

Active
$335,000
3
bds
|
2
ba
|
1,104
sqft
|
built
1927
350 Adolph St, Rockford, MI 49341
$-649
Cash flow
-10.1%
Cash-on-Cash Return
3.9%
Cap rate
0.7%
Rent to Value Ratio

Active
$520,000
3
bds
|
3
ba
|
1,926
sqft
|
built
2022
179 Tamarack Ln, Rockford, MI 49341
$-1,293
Cash flow
-13.0%
Cash-on-Cash Return
3.3%
Cap rate
0.6%
Rent to Value Ratio

Active
$1,395,000
7
bds
|
5
ba
|
4,770
sqft
|
built
1997
7707 Forest Ct NE, Rockford, MI 49341
$-5,051
Cash flow
-18.9%
Cash-on-Cash Return
1.9%
Cap rate
0.3%
Rent to Value Ratio
Active
$3,100,000
5
bds
|
5
ba
|
6,521
sqft
|
built
2023
7442 Tiffany Ave NE, Rockford, MI 49341
$-16,264
Cash flow
-27.4%
Cash-on-Cash Return
0.0%
Cap rate
0.1%
Rent to Value Ratio
Active
$795,000
4
bds
|
4
ba
|
3,628
sqft
|
built
1997
7620 Spring Point Ct NE, Rockford, MI 49341
$-2,046
Cash flow
-13.4%
Cash-on-Cash Return
3.2%
Cap rate
0.5%
Rent to Value Ratio

Active
$499,400
4
bds
|
4
ba
|
2,420
sqft
|
built
2020
6745 Craftsman Square Dr NE, Rockford, MI 49341
$-1,017
Cash flow
-10.6%
Cash-on-Cash Return
3.8%
Cap rate
0.6%
Rent to Value Ratio

Active
$699,900
5
bds
|
4
ba
|
4,600
sqft
|
built
1995
7174 Loma Linda Dr NE, Rockford, MI 49341
$-1,545
Cash flow
-11.5%
Cash-on-Cash Return
3.6%
Cap rate
0.6%
Rent to Value Ratio
Active
$1,995,000
6
bds
|
4
ba
|
4,394
sqft
|
built
2011
7192 Wilkinson Dr NE, Rockford, MI 49341
$-8,273
Cash flow
-21.6%
Cash-on-Cash Return
1.3%
Cap rate
0.2%
Rent to Value Ratio
Active
$689,000
3
bds
|
3
ba
|
2,765
sqft
|
built
2000
6817 Martin View St NE, Rockford, MI 49341
$-1,834
Cash flow
-13.9%
Cash-on-Cash Return
3.1%
Cap rate
0.5%
Rent to Value Ratio
Active
$499,900
5
bds
|
4
ba
|
2,996
sqft
|
built
1995
9610 Grange Ave NE, Rockford, MI 49341
$-933
Cash flow
-9.7%
Cash-on-Cash Return
4.0%
Cap rate
0.6%
Rent to Value Ratio
Active
$205,900
2
bds
|
1
ba
|
852
sqft
|
built
1920
6773 Kitson Dr NE, Rockford, MI 49341
$88
Cash flow
2.2%
Cash-on-Cash Return
6.8%
Cap rate
0.9%
Rent to Value Ratio

Active
$782,500
5
bds
|
4
ba
|
3,043
sqft
|
built
2015
3269 Hopewell Ct NE, Rockford, MI 49341
$-3,003
Cash flow
-20.0%
Cash-on-Cash Return
1.7%
Cap rate
0.3%
Rent to Value Ratio

Active
$1,900,000
4
bds
|
4
ba
|
4,320
sqft
|
built
2017
9924 Summit Ave NE, Rockford, MI 49341
$-9,700
Cash flow
-26.6%
Cash-on-Cash Return
0.1%
Cap rate
0.1%
Rent to Value Ratio
Active
$1,500,000
4
bds
|
5
ba
|
3,850
sqft
|
built
2011
7217 Davies Dr NE, Rockford, MI 49341
$-4,392
Cash flow
-15.3%
Cash-on-Cash Return
2.8%
Cap rate
0.4%
Rent to Value Ratio