Salt Lake City, UT Investment Properties for Sale
Browse homes for sale and investment properties in Salt Lake City, UT. Refine your search by price, property type, or more.
Best cash flowing properties in Salt Lake City, UT
Active
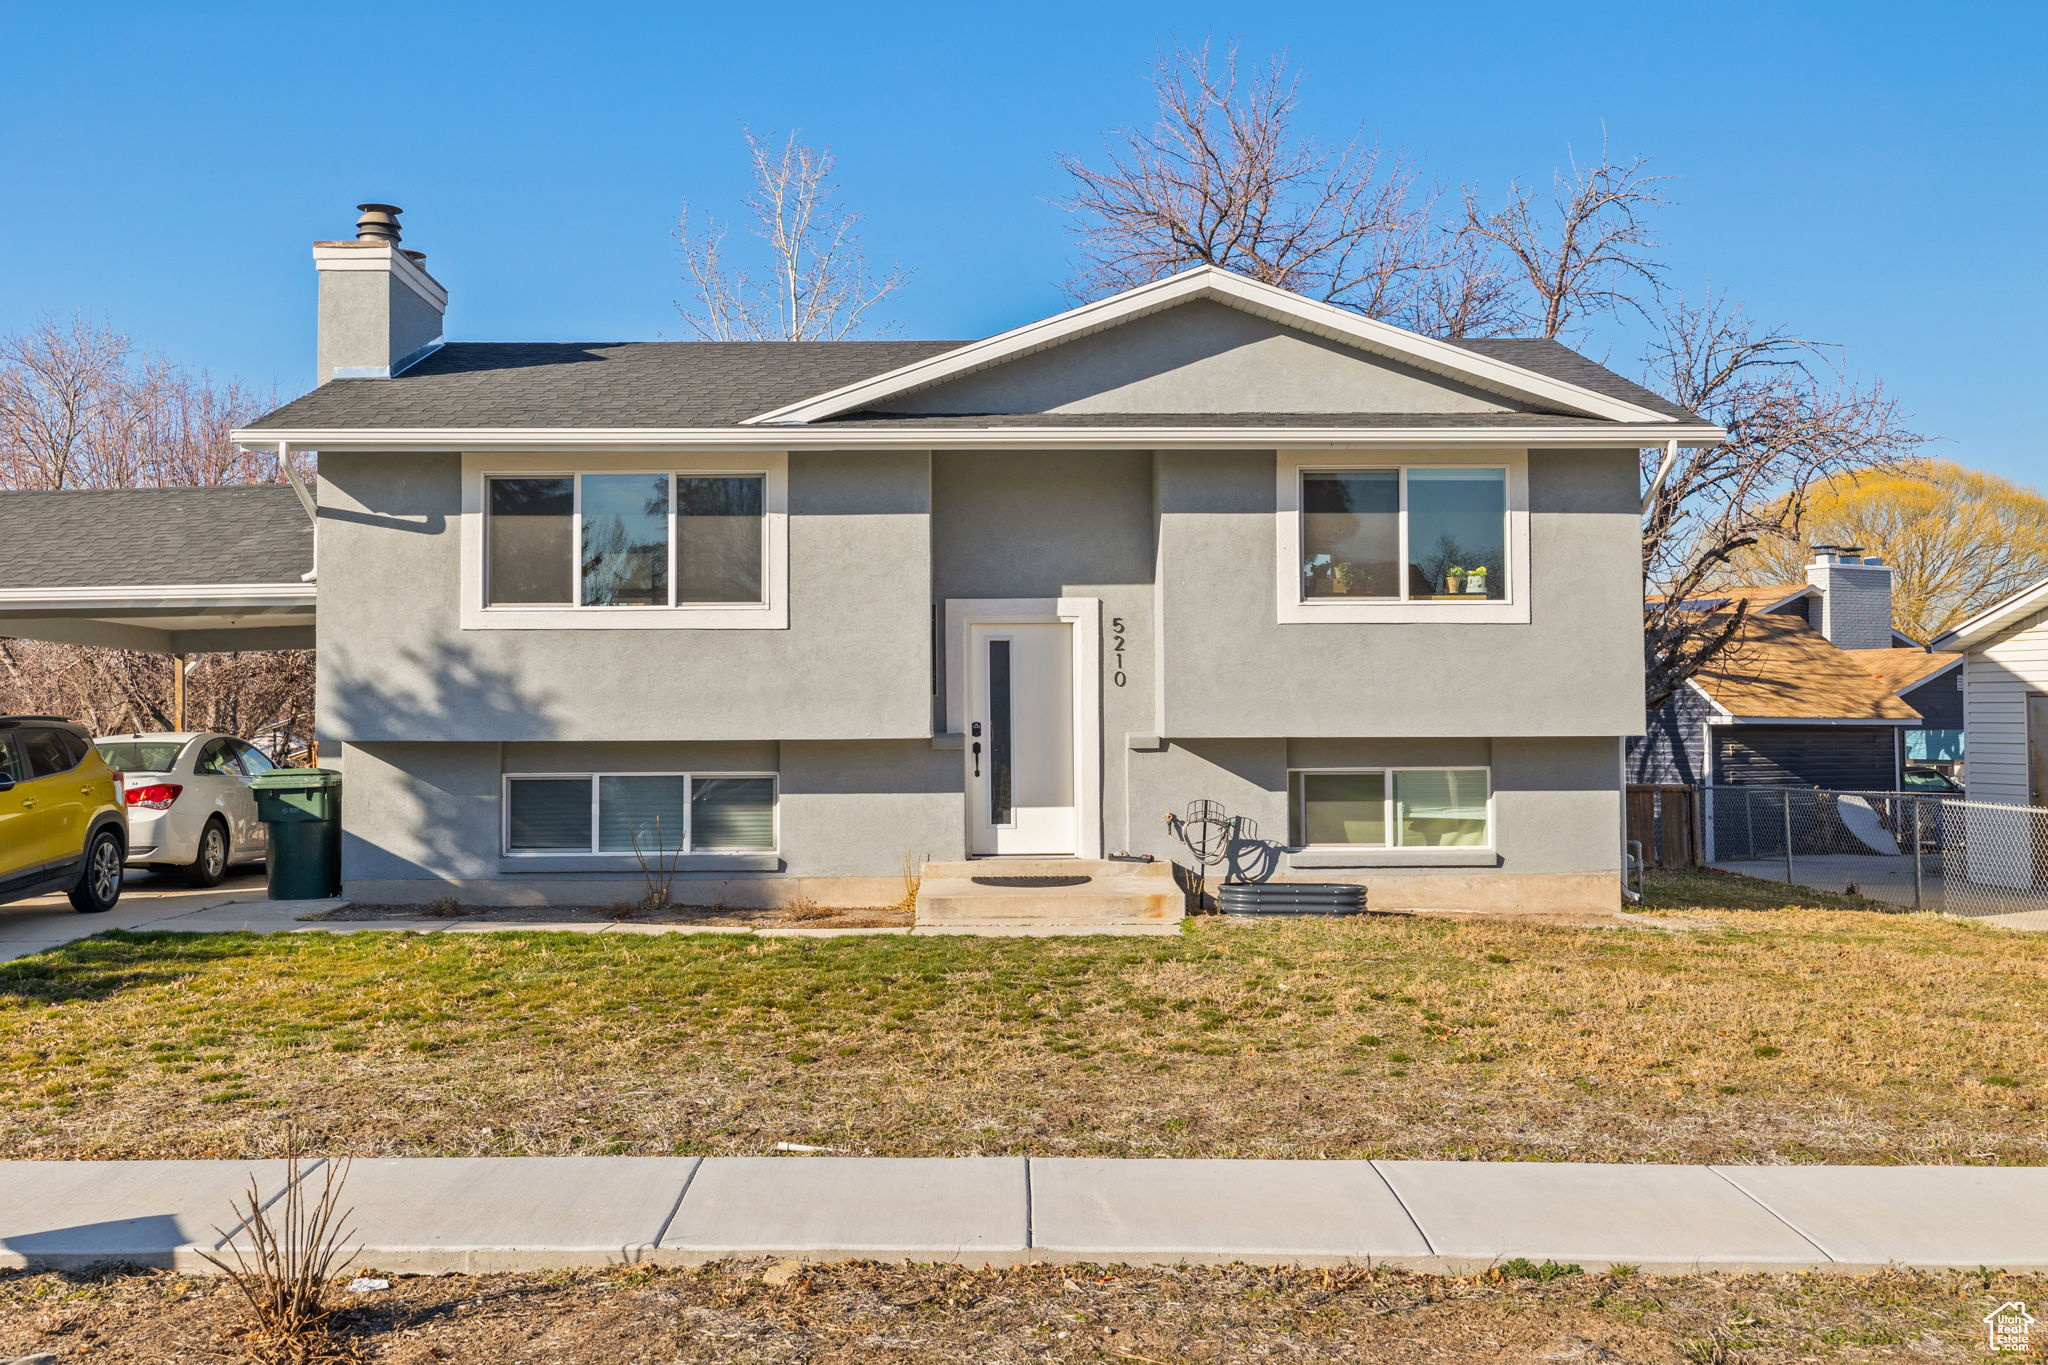
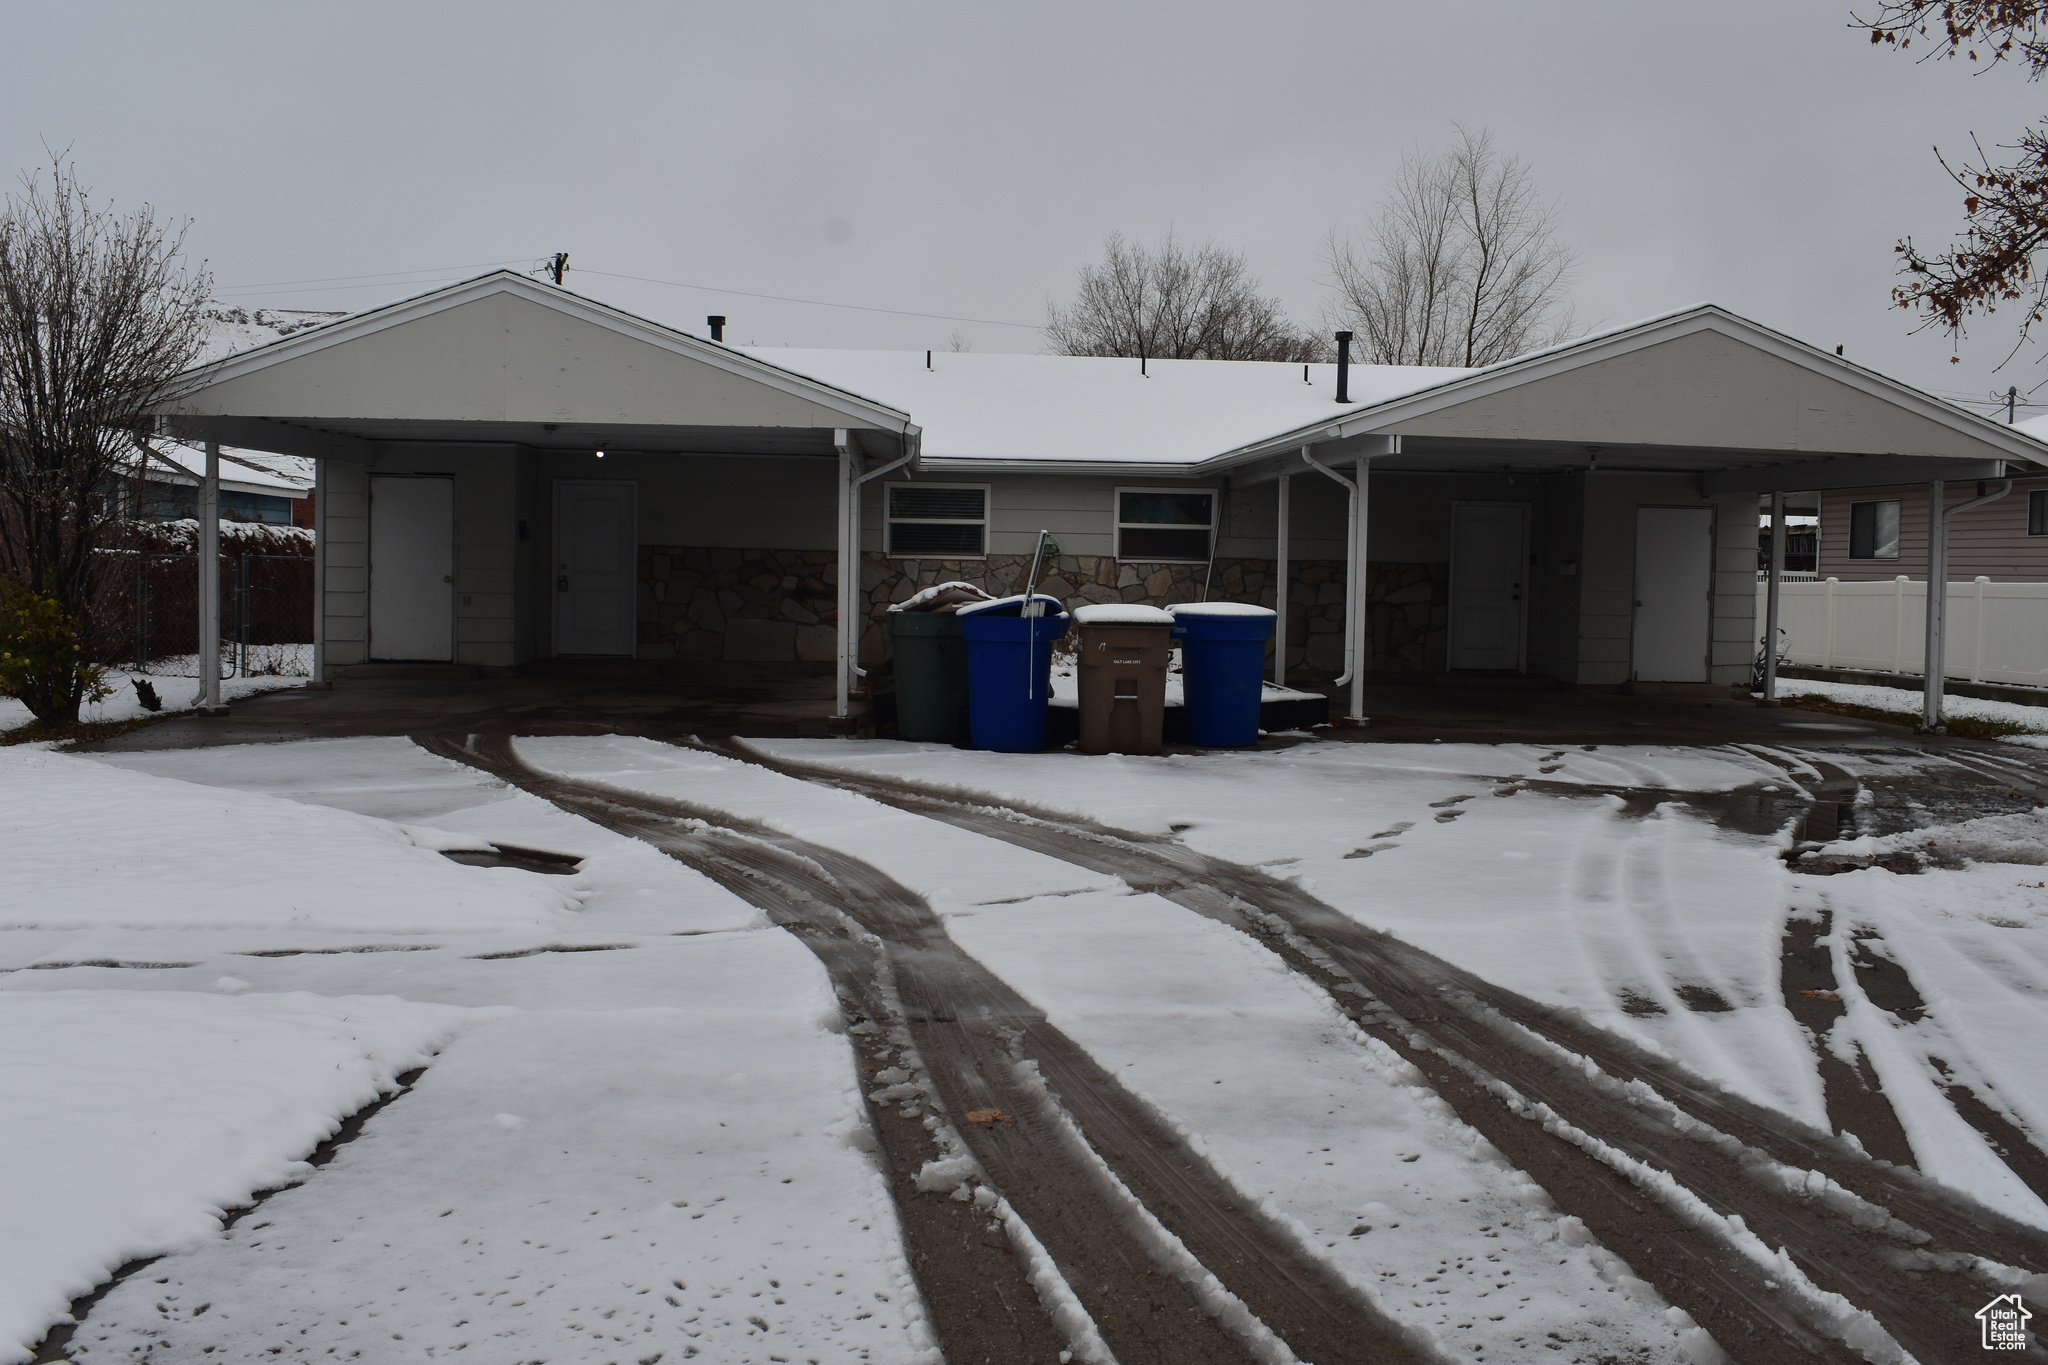
$524,700
4
bds
|
2
ba
|
1,844
sqft
|
built
1977
5210 W Woodledge Ave, Salt Lake City, UT 84120
$-1,049
Cash flow
-10.4%
Cash-on-Cash Return
3.9%
Cap rate
0.5%
Rent to Value Ratio
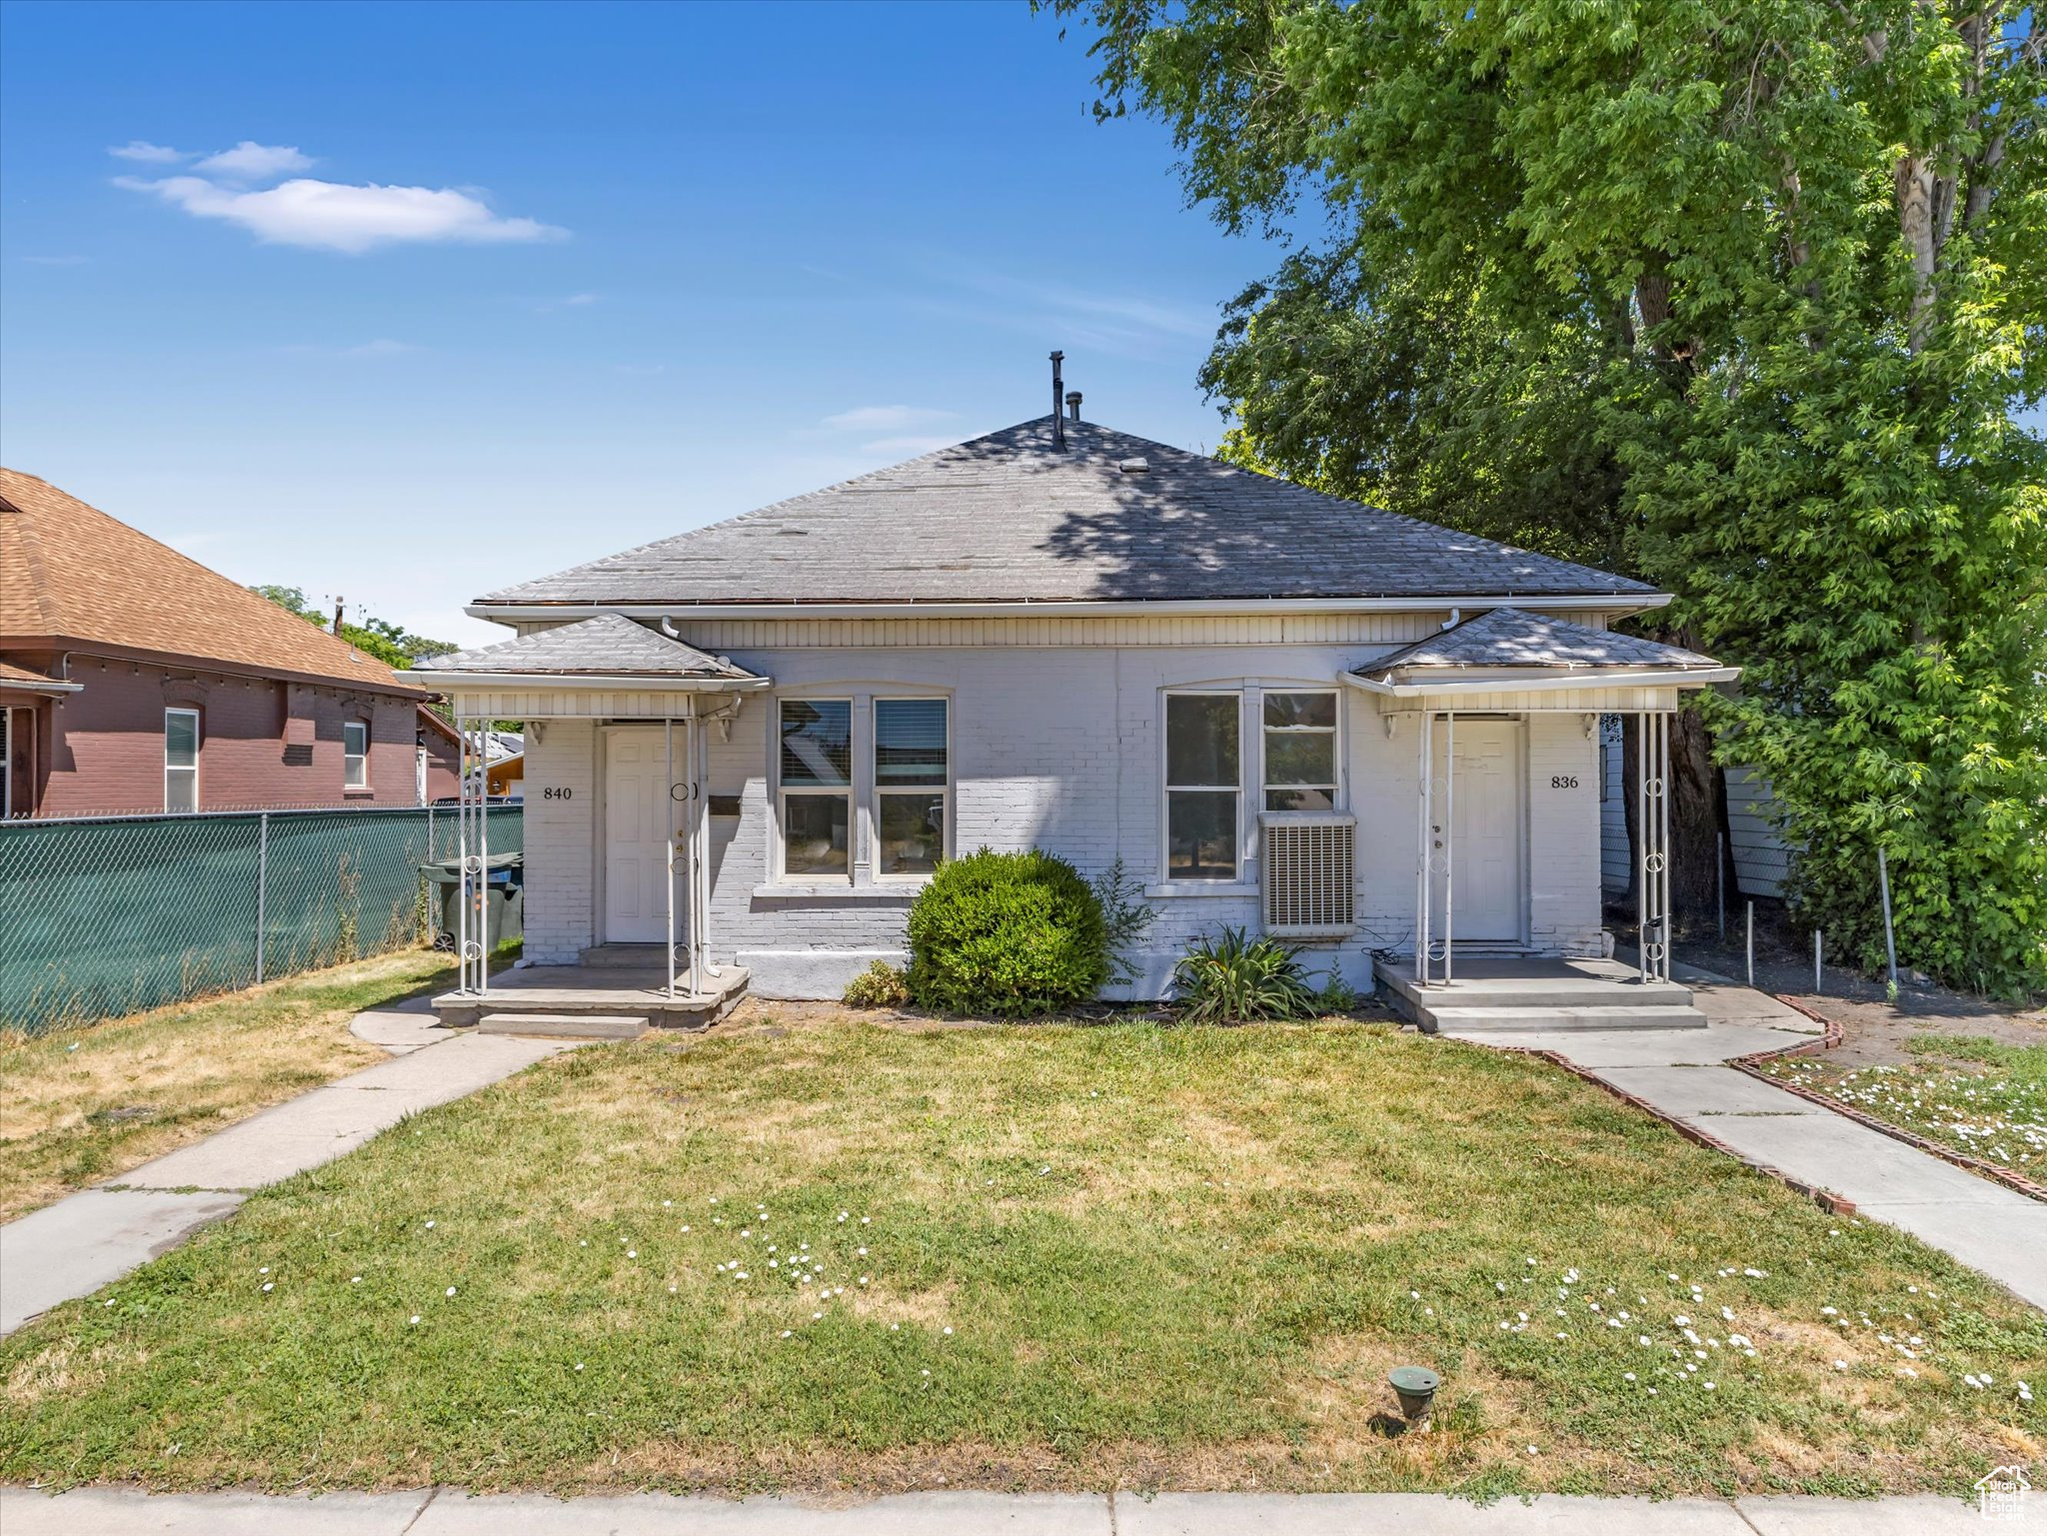
Active
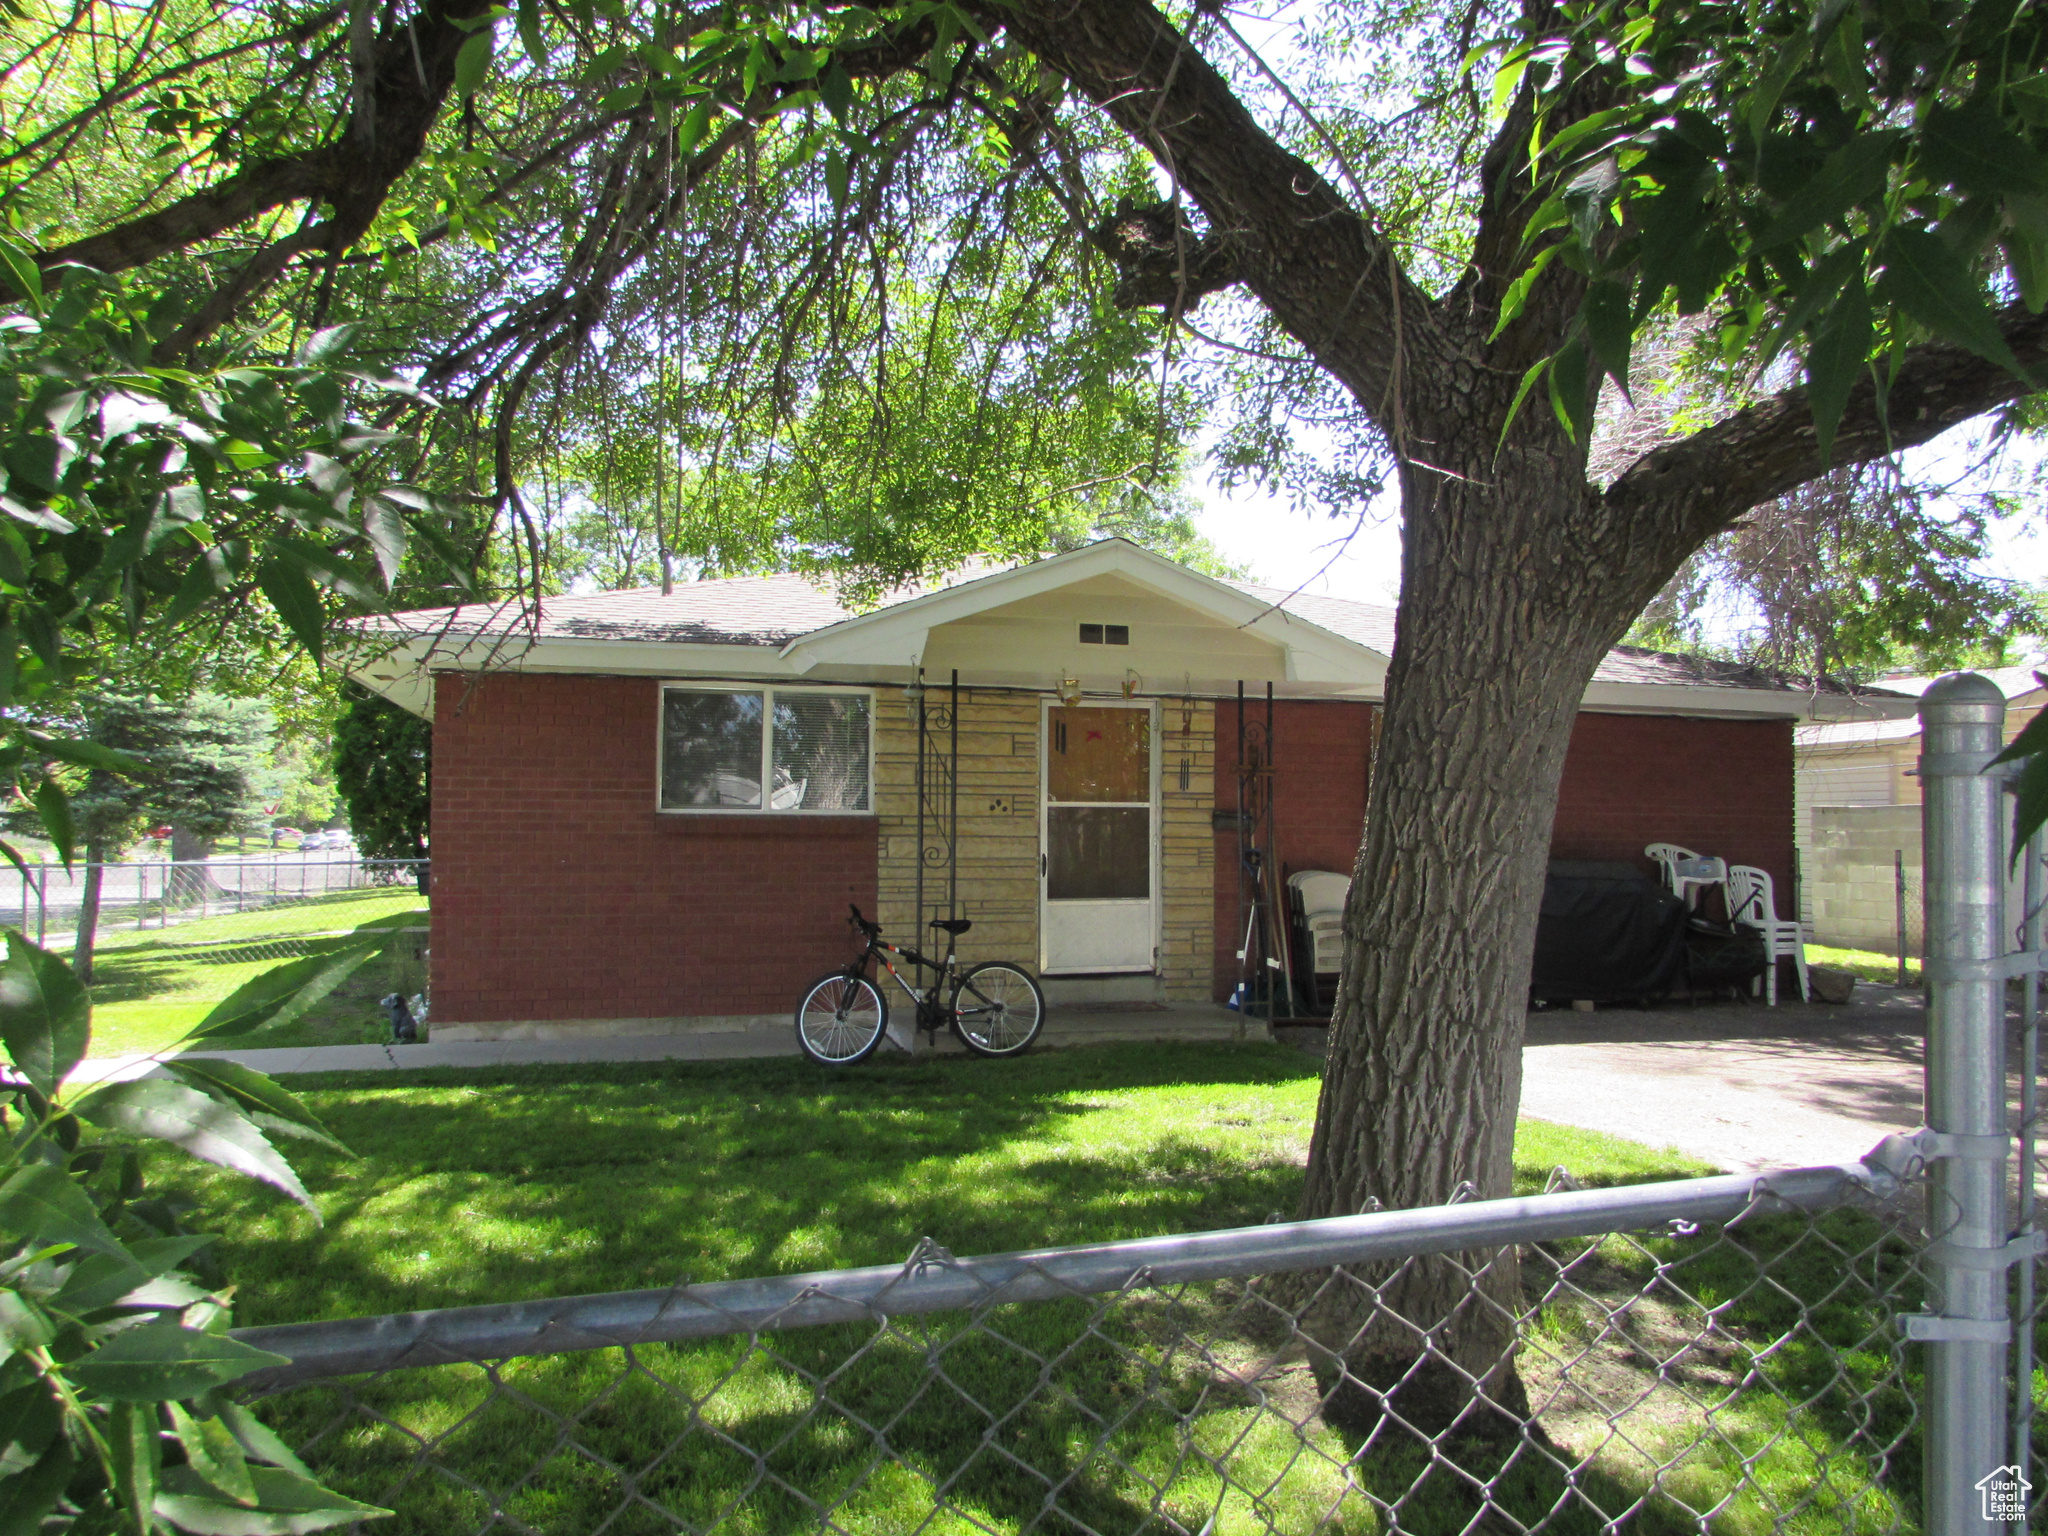
$450,000
2
bds
|
2
ba
|
1,254
sqft
|
built
1928
836 W 300 N, Salt Lake City, UT 84116
$-1,283
Cash flow
-14.9%
Cash-on-Cash Return
2.9%
Cap rate
0.4%
Rent to Value Ratio
56 out of 83 properties for sale in Salt Lake City, UT
Limited Results Shown
Create a free account, or log in to reveal all property listings and enjoy the complete experience.
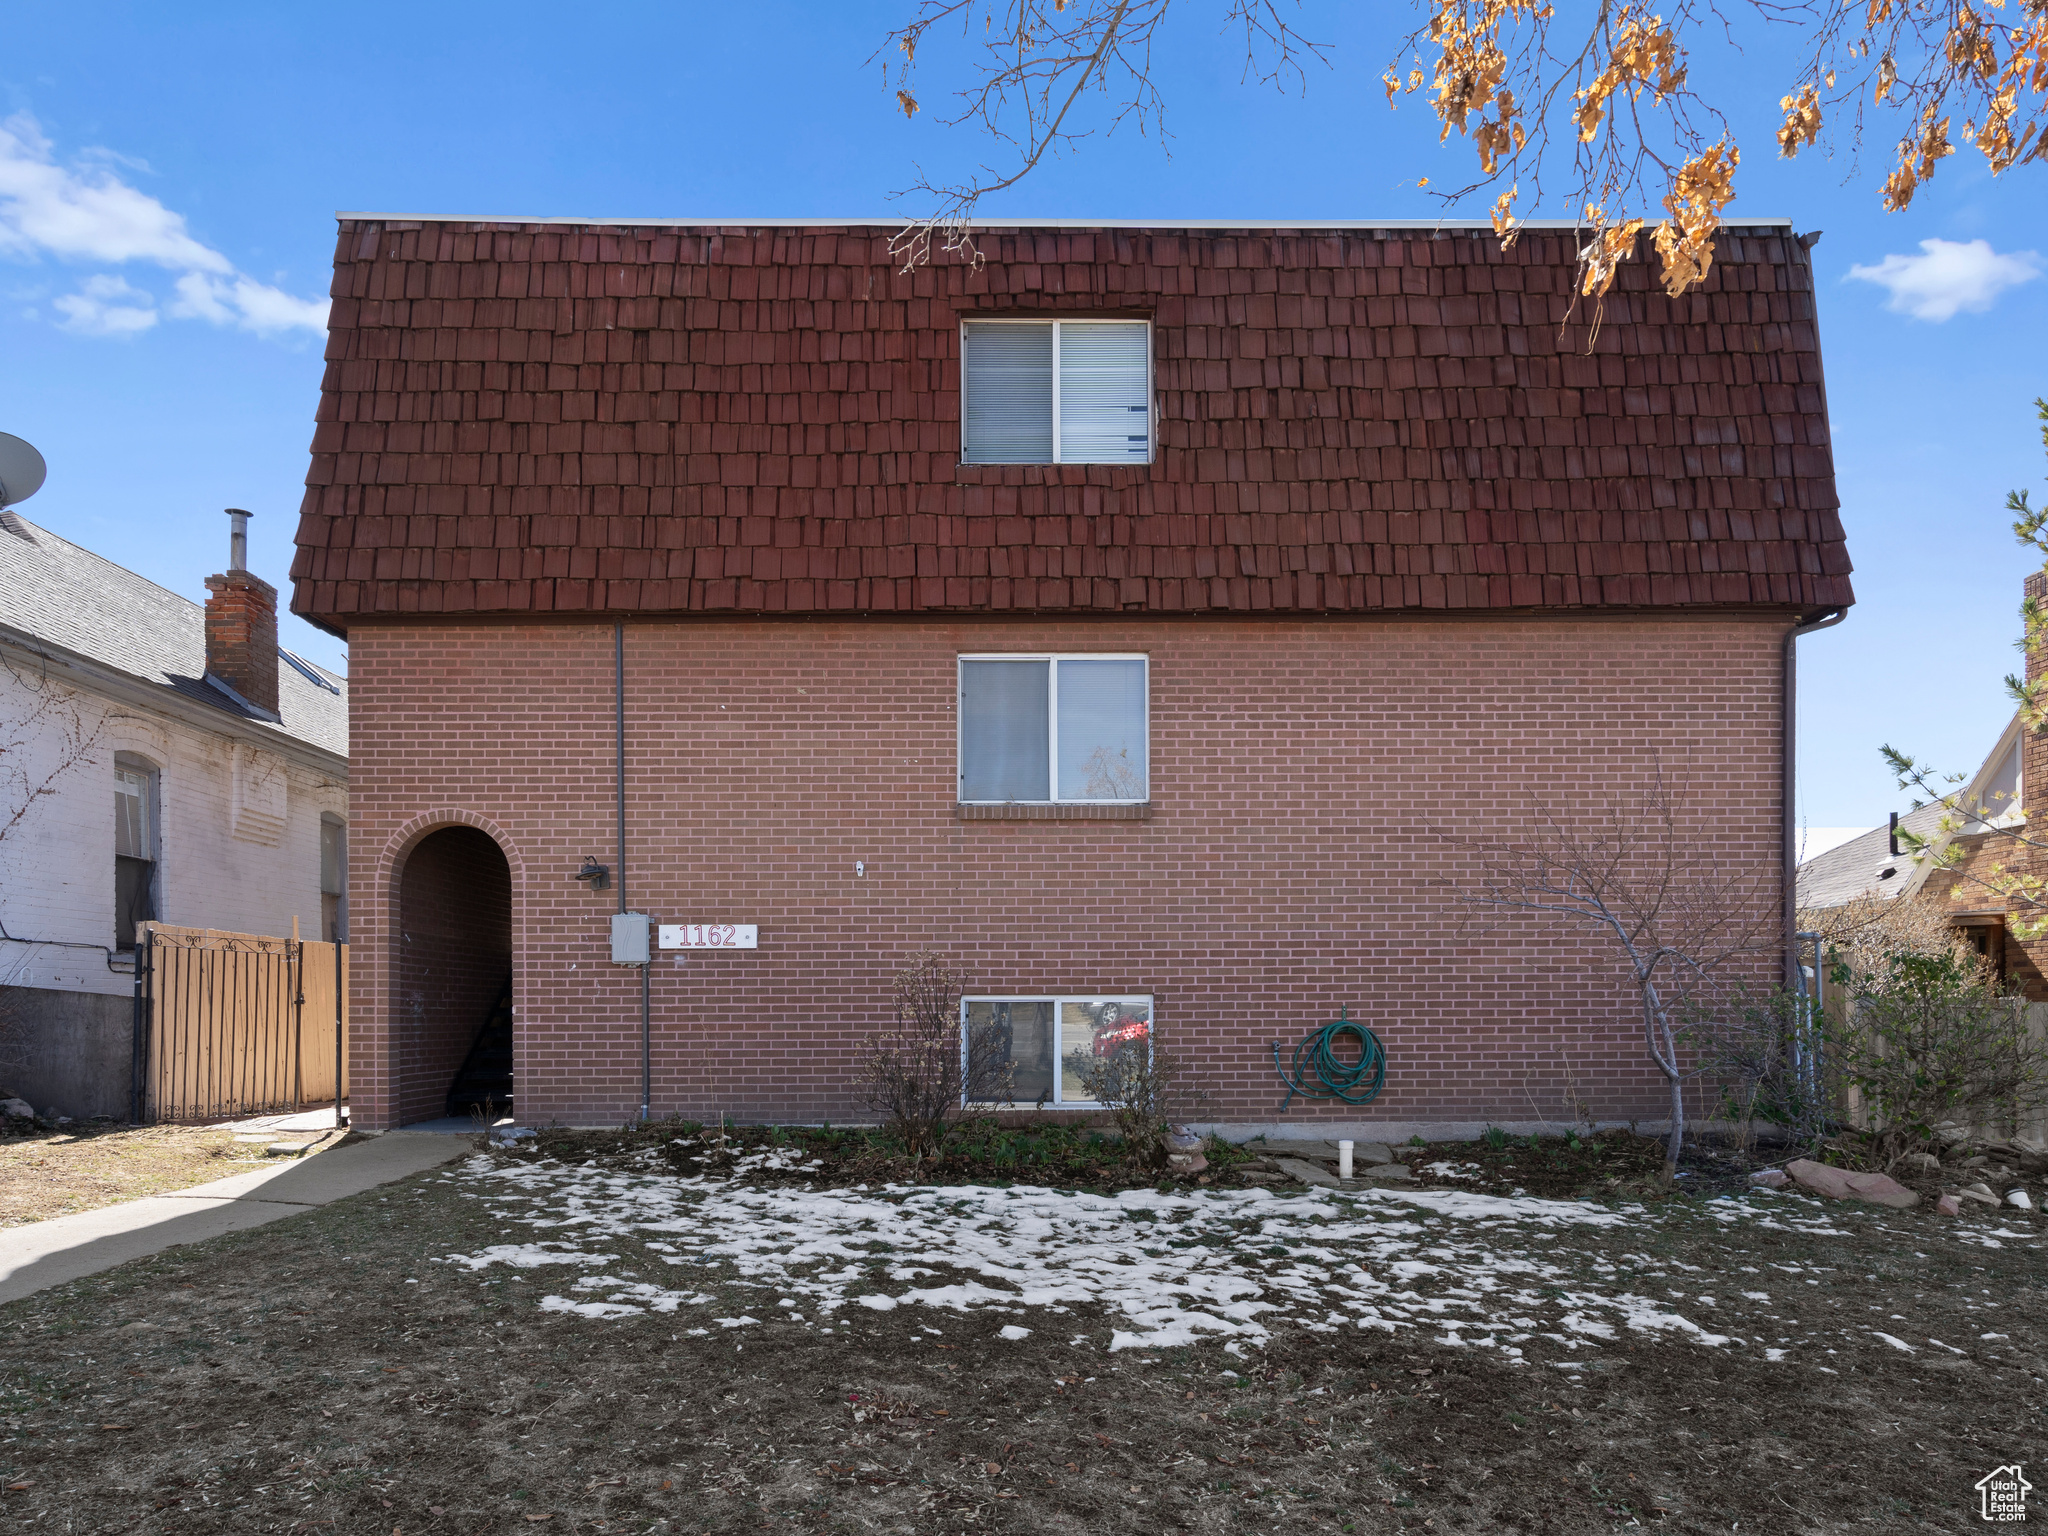
Active
$2,300,000
16
bds
|
8
ba
|
9,563
sqft
|
built
1973
1162 E 400 S, Salt Lake City, UT 84102
$-11,496
Cash flow
-26.1%
Cash-on-Cash Return
0.3%
Cap rate
0.1%
Rent to Value Ratio
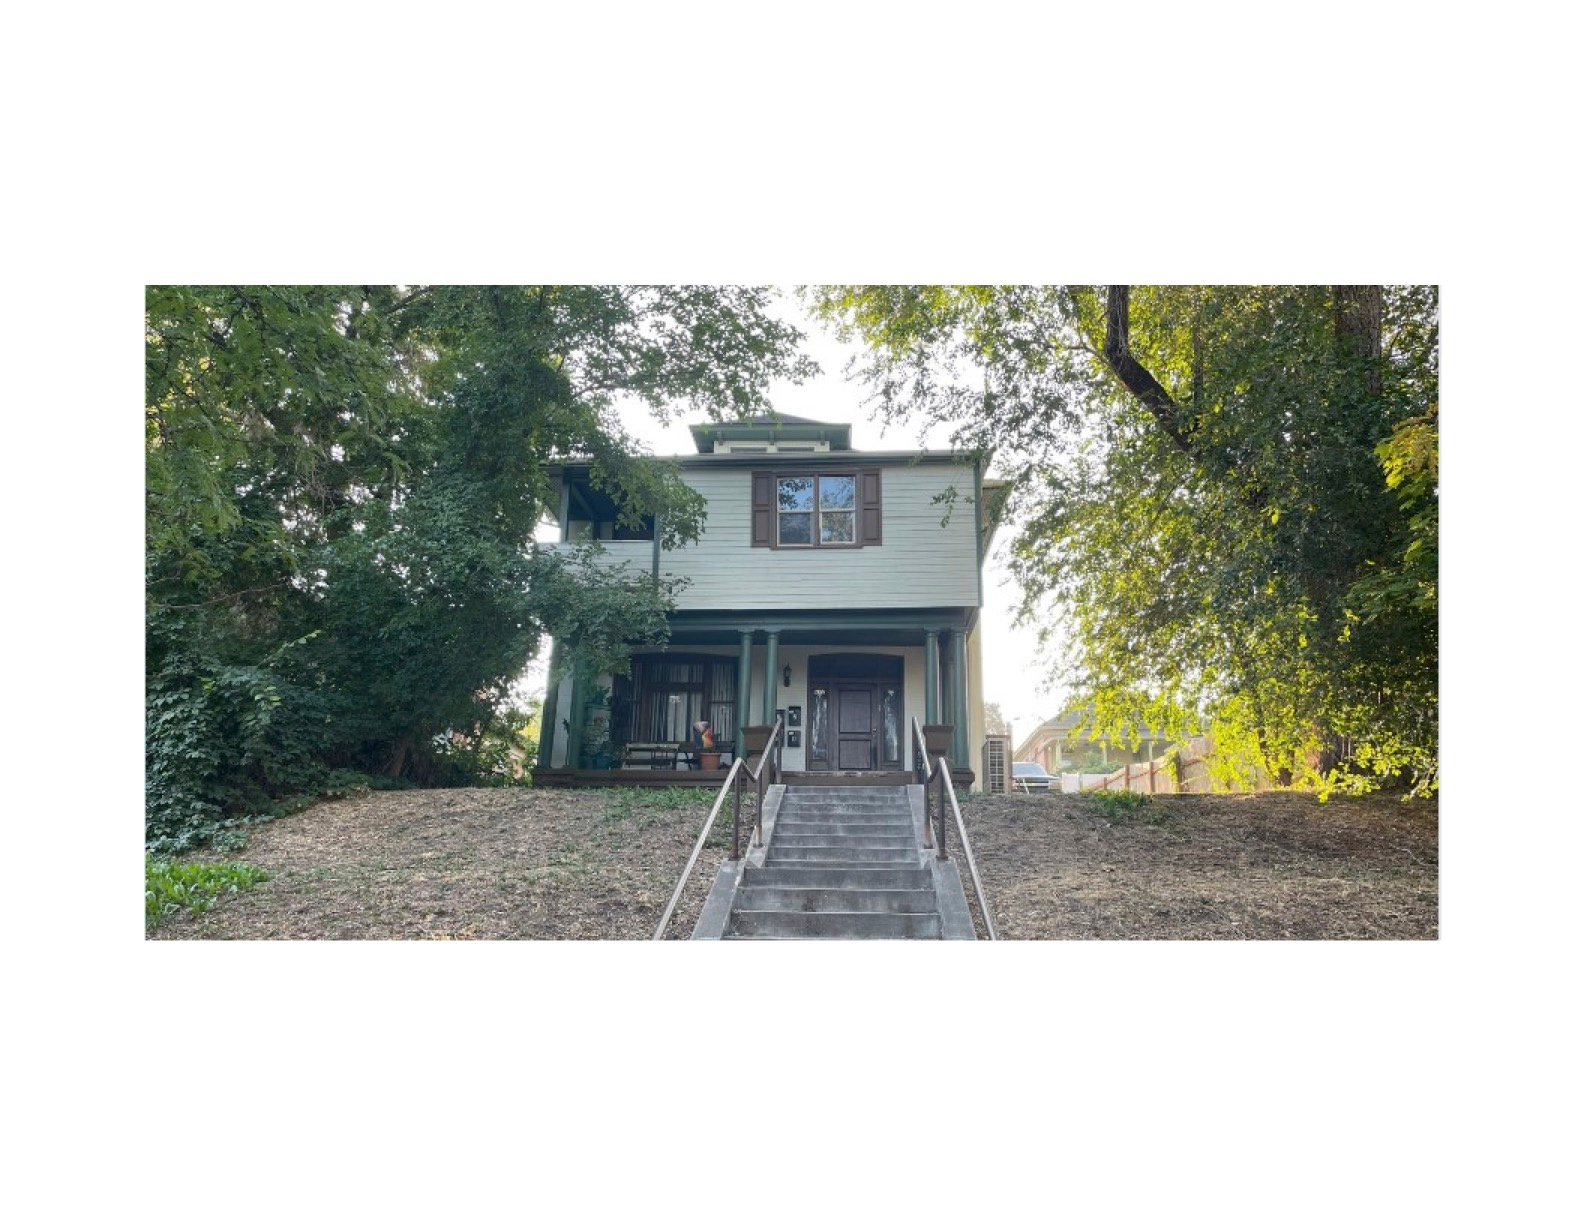
Active
$1,165,000
8
bds
|
4
ba
|
4,000
sqft
|
built
1921
672 N 200 W, Salt Lake City, UT 84103
$-4,410
Cash flow
-19.7%
Cash-on-Cash Return
1.7%
Cap rate
0.3%
Rent to Value Ratio
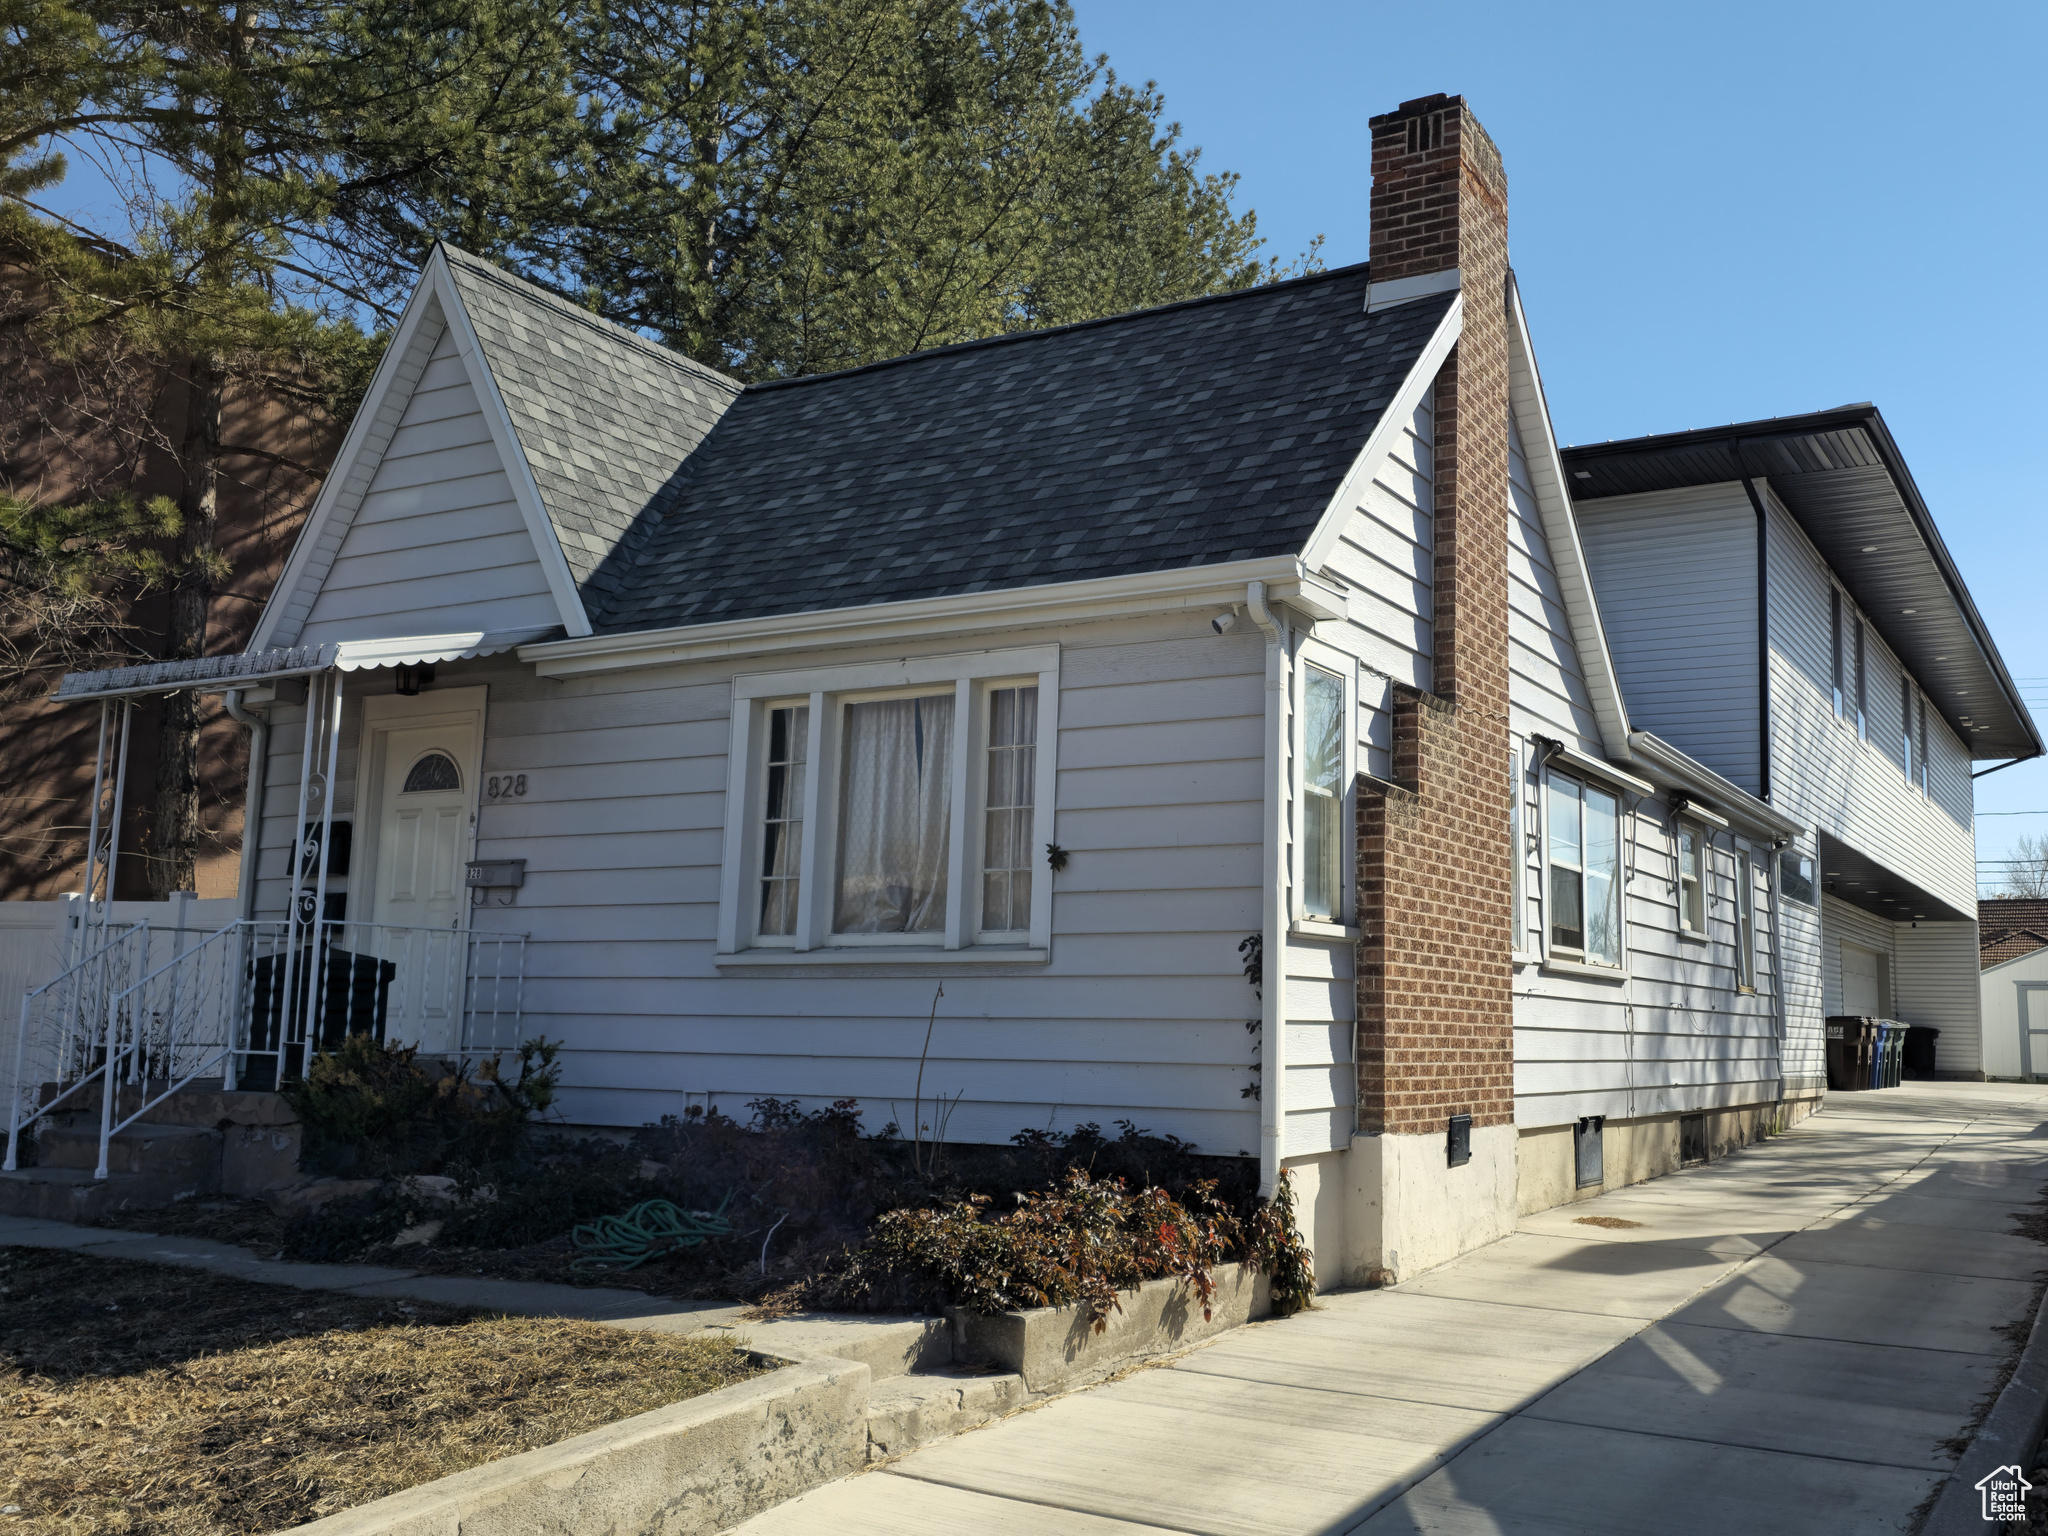
Active
$1,600,000
4
bds
|
7
ba
|
4,400
sqft
|
built
1935
828 E Logan Ave, Salt Lake City, UT 84105
$-6,773
Cash flow
-22.1%
Cash-on-Cash Return
1.2%
Cap rate
0.2%
Rent to Value Ratio
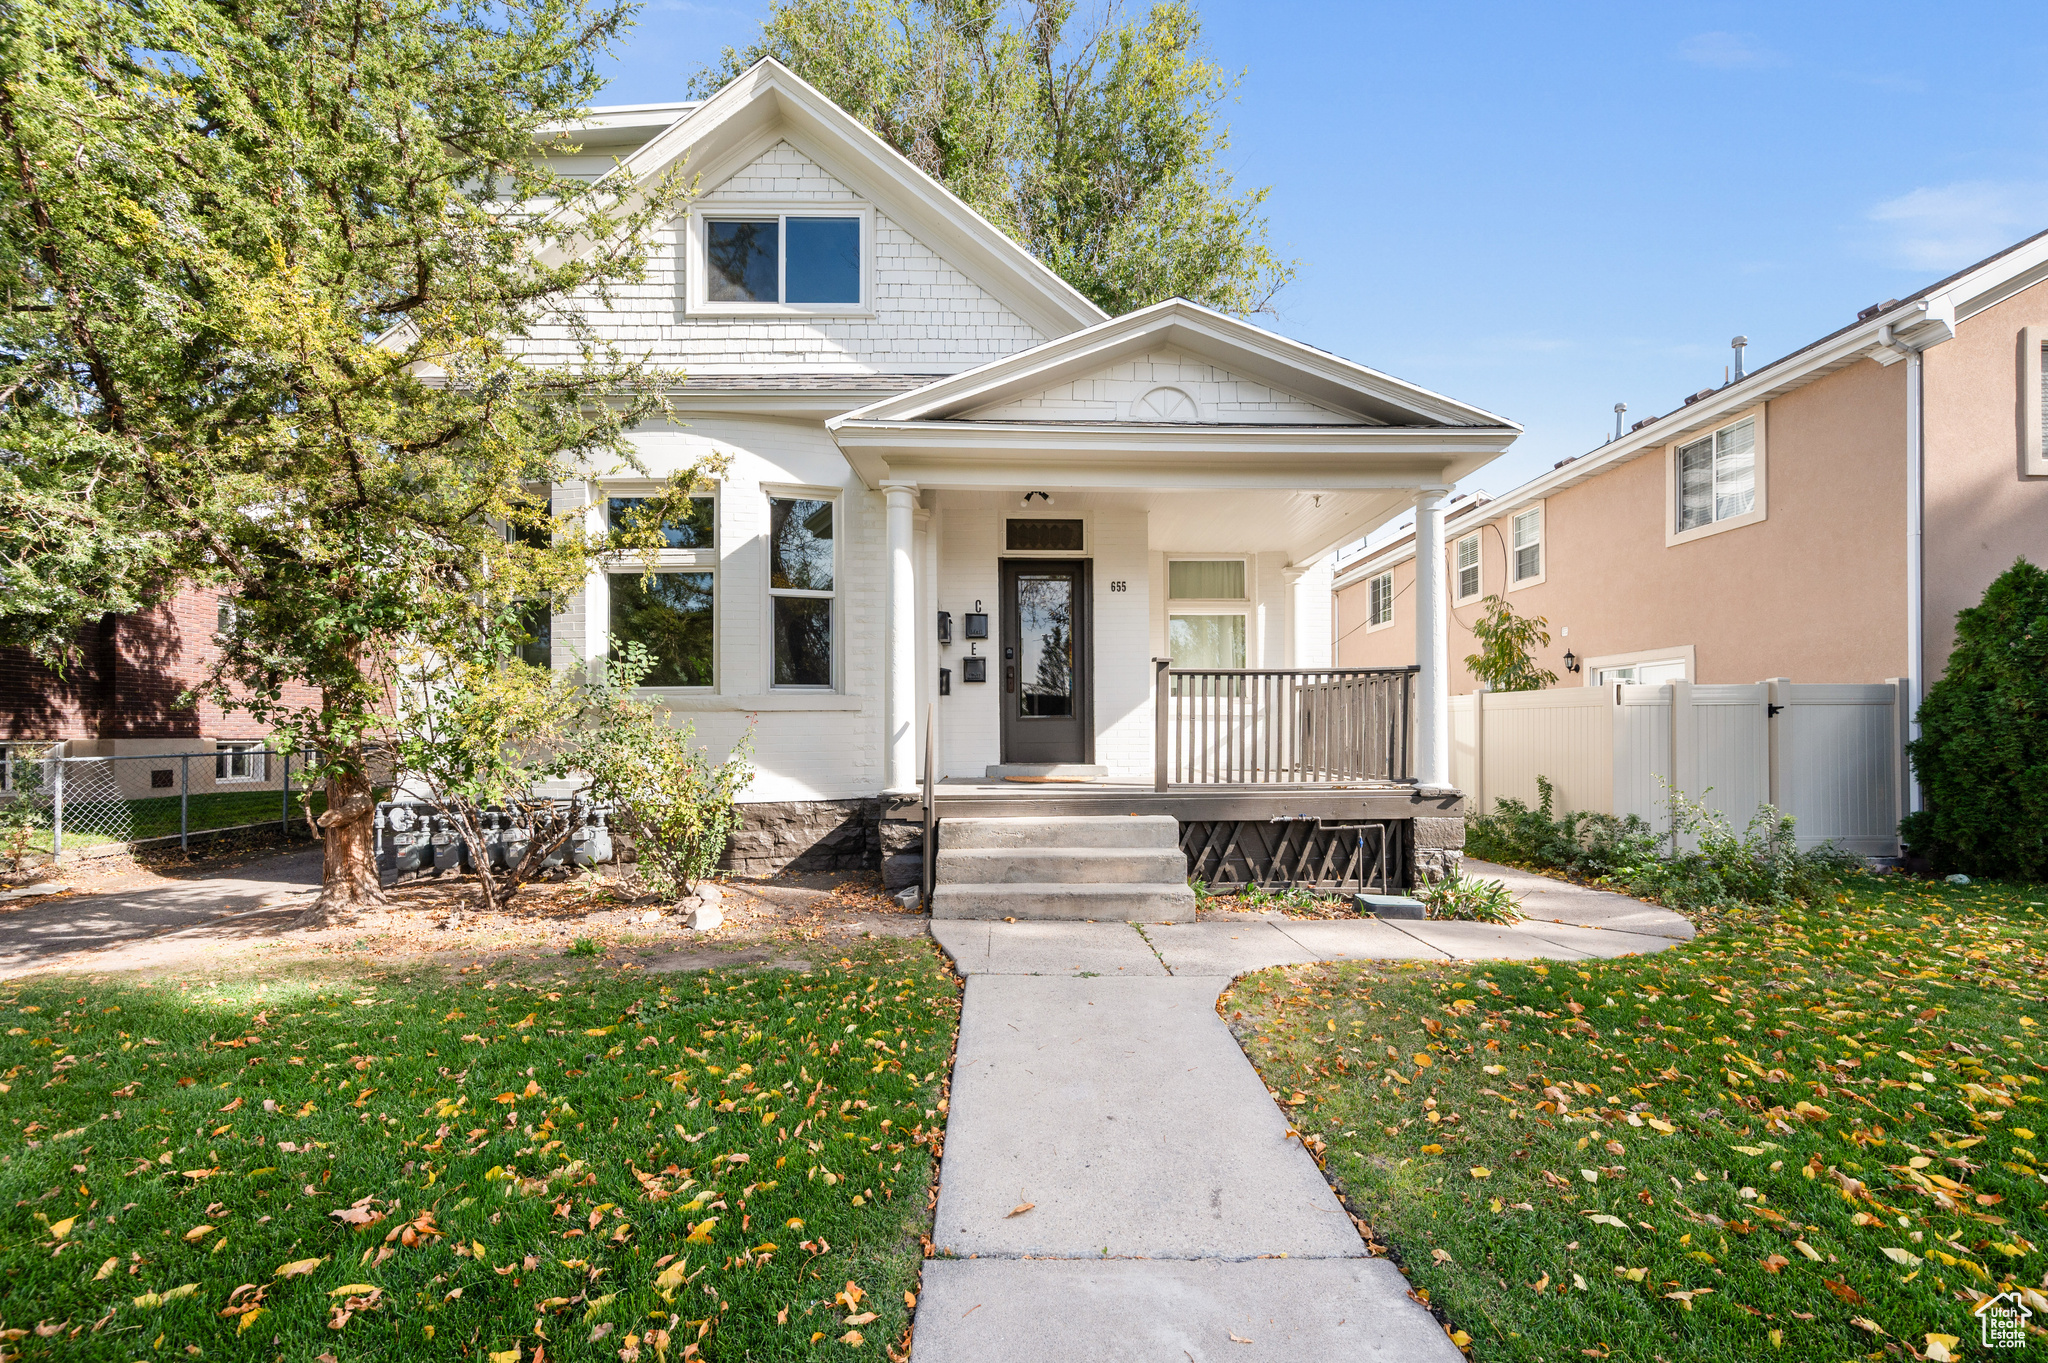
Active
$1,299,000
7
bds
|
5
ba
|
3,579
sqft
|
built
1906
655 S 800 E, Salt Lake City, UT 84102
$-5,267
Cash flow
-21.2%
Cash-on-Cash Return
1.4%
Cap rate
0.2%
Rent to Value Ratio
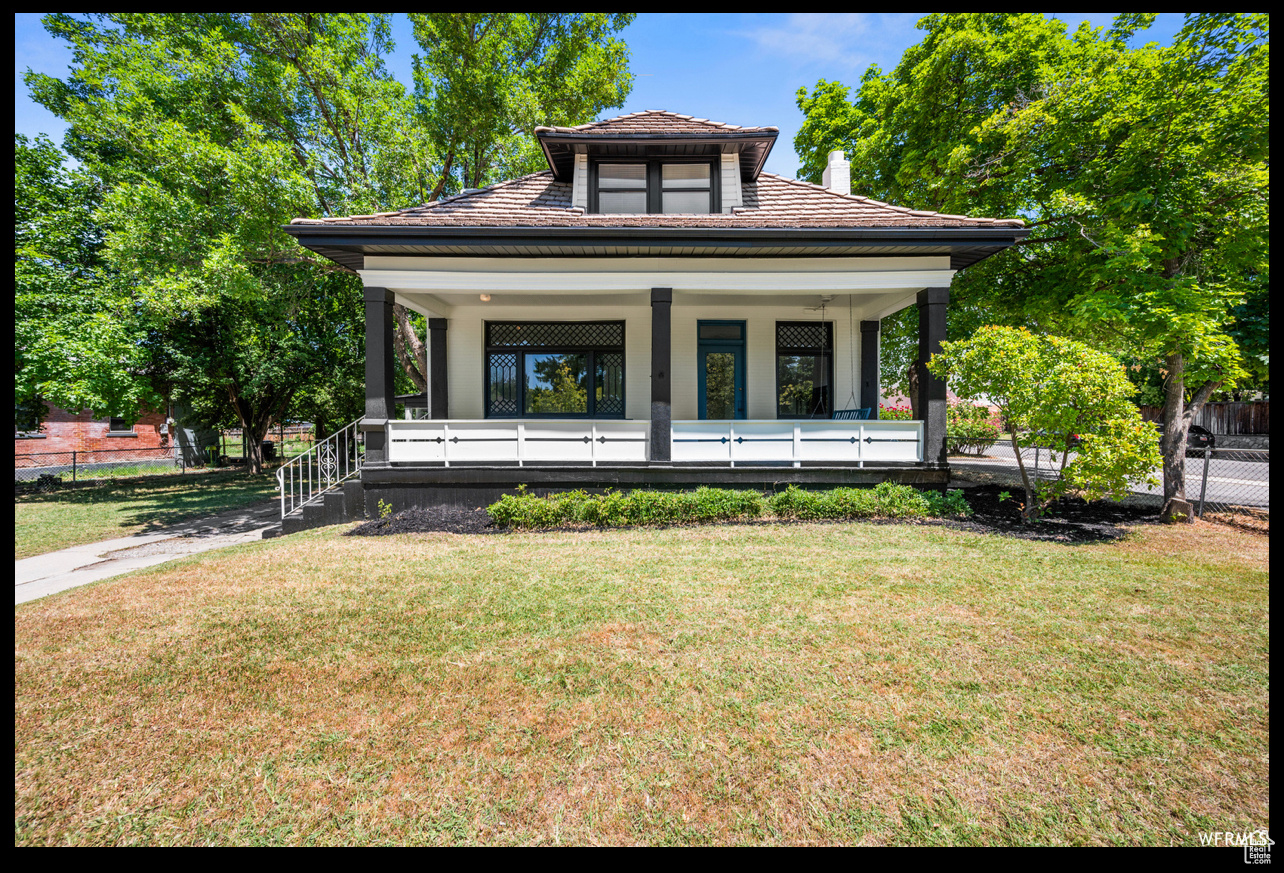
Active
$1,430,000
8
bds
|
4
ba
|
4,642
sqft
|
built
1909
1027 E Emerson Ave, Salt Lake City, UT 84105
$-5,438
Cash flow
-19.8%
Cash-on-Cash Return
1.7%
Cap rate
0.3%
Rent to Value Ratio
Active
$524,700
4
bds
|
2
ba
|
1,844
sqft
|
built
1977
5210 W Woodledge Ave, Salt Lake City, UT 84120
$-1,049
Cash flow
-10.4%
Cash-on-Cash Return
3.9%
Cap rate
0.5%
Rent to Value Ratio
Active
$450,000
2
bds
|
2
ba
|
1,254
sqft
|
built
1928
836 W 300 N, Salt Lake City, UT 84116
$-1,283
Cash flow
-14.9%
Cash-on-Cash Return
2.9%
Cap rate
0.4%
Rent to Value Ratio
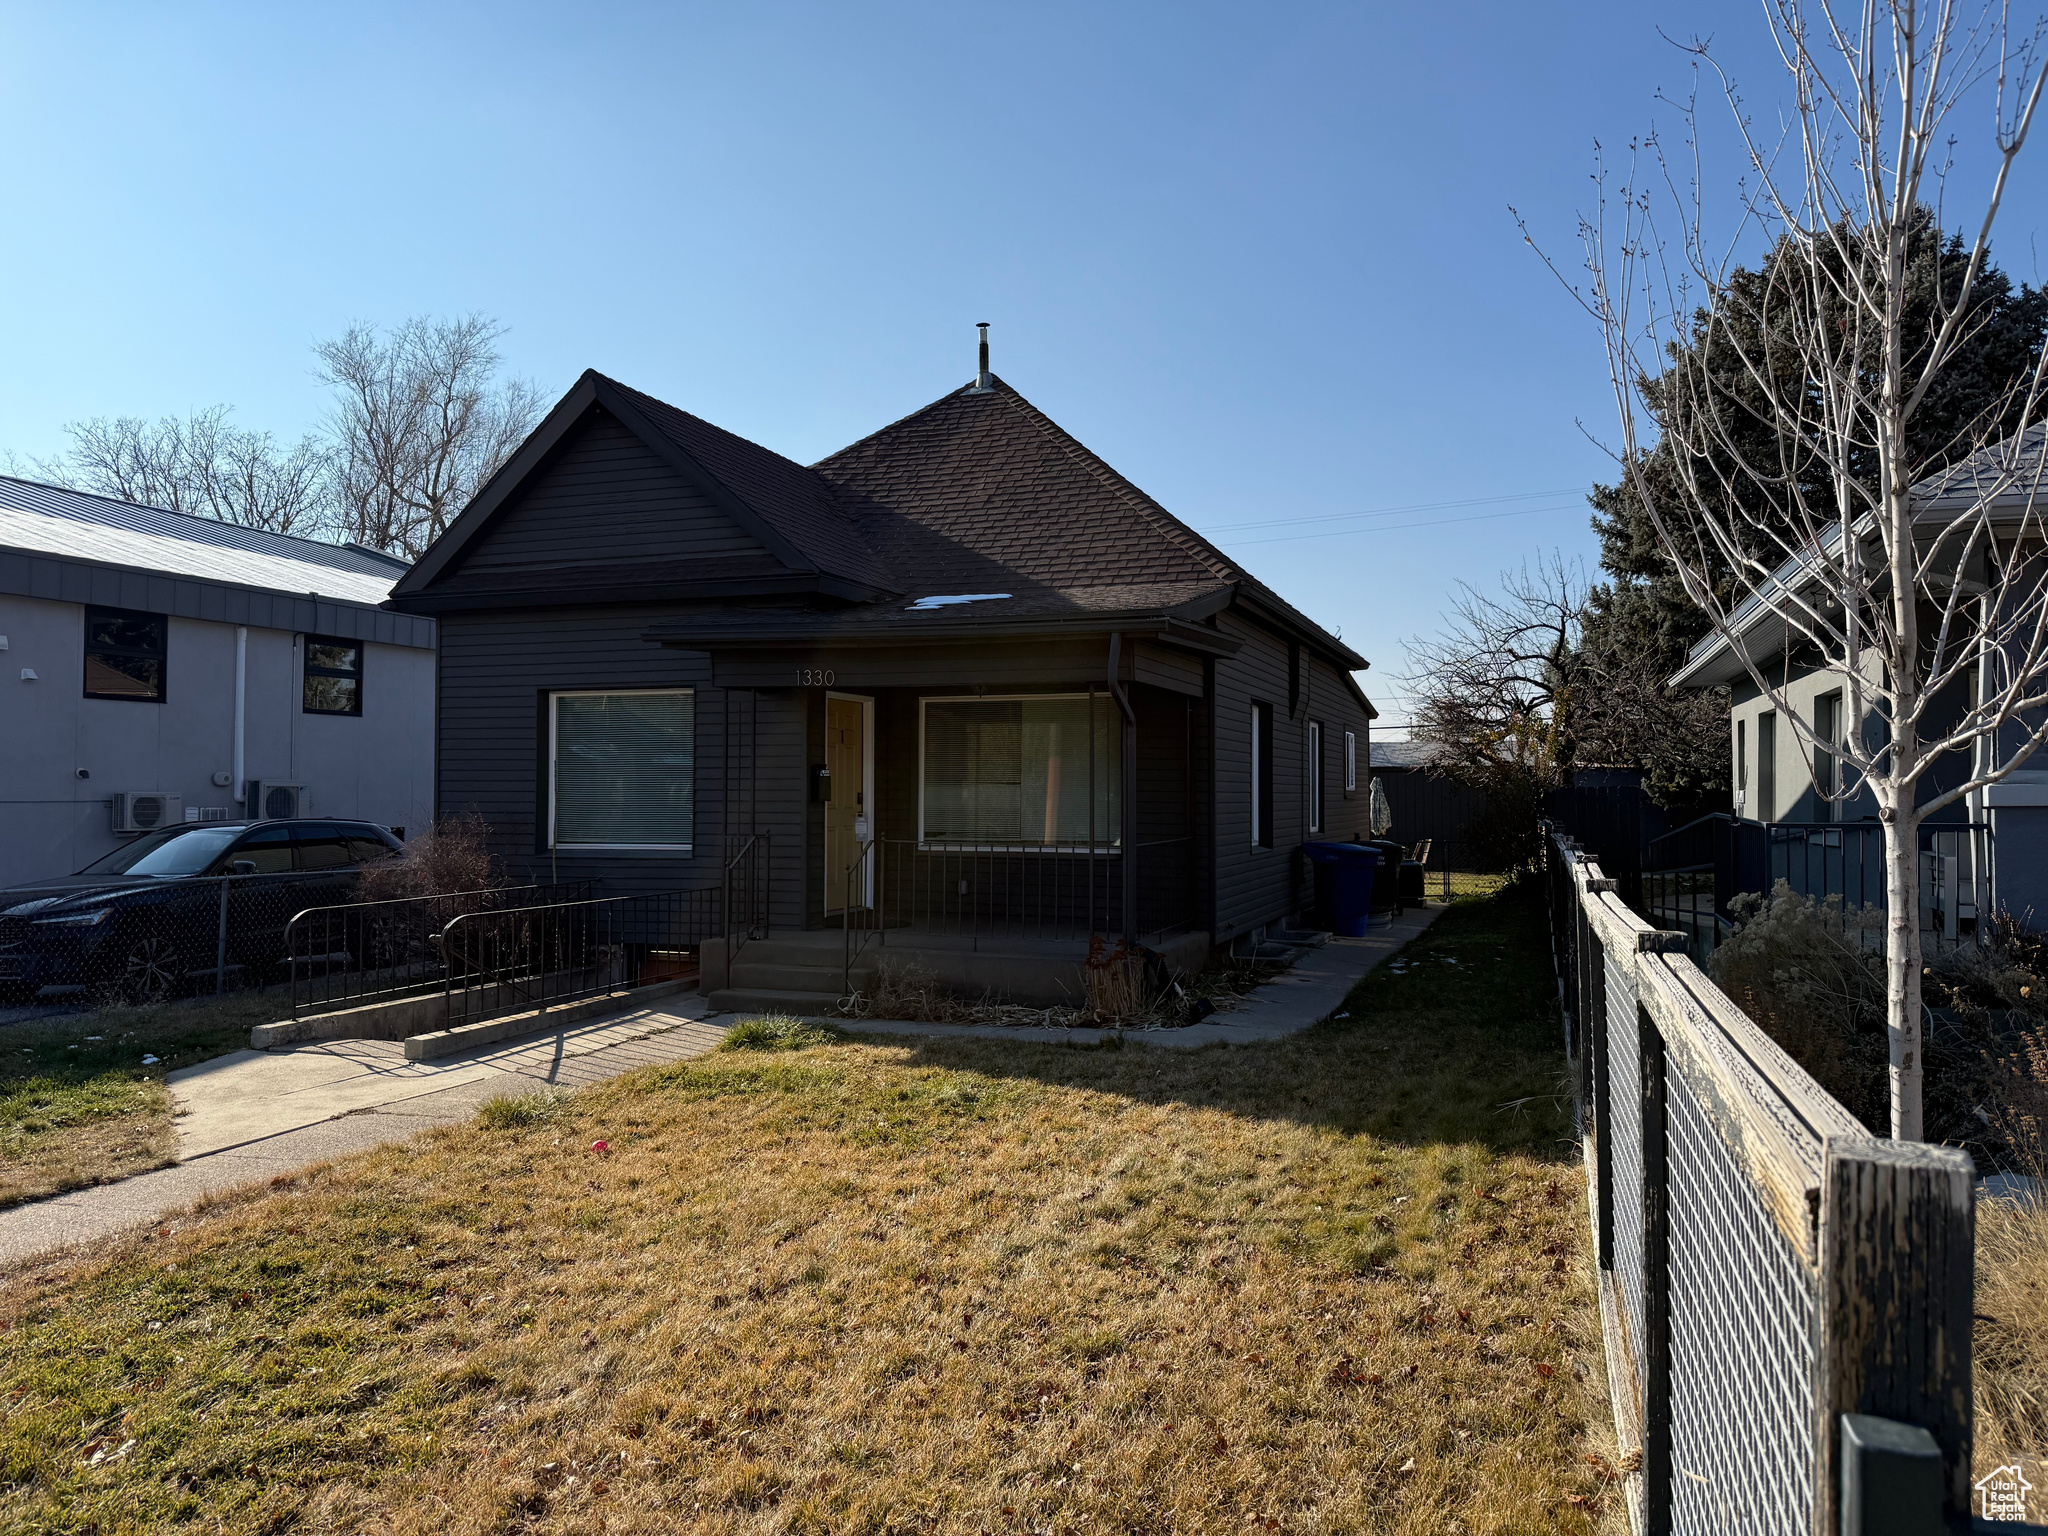
Active
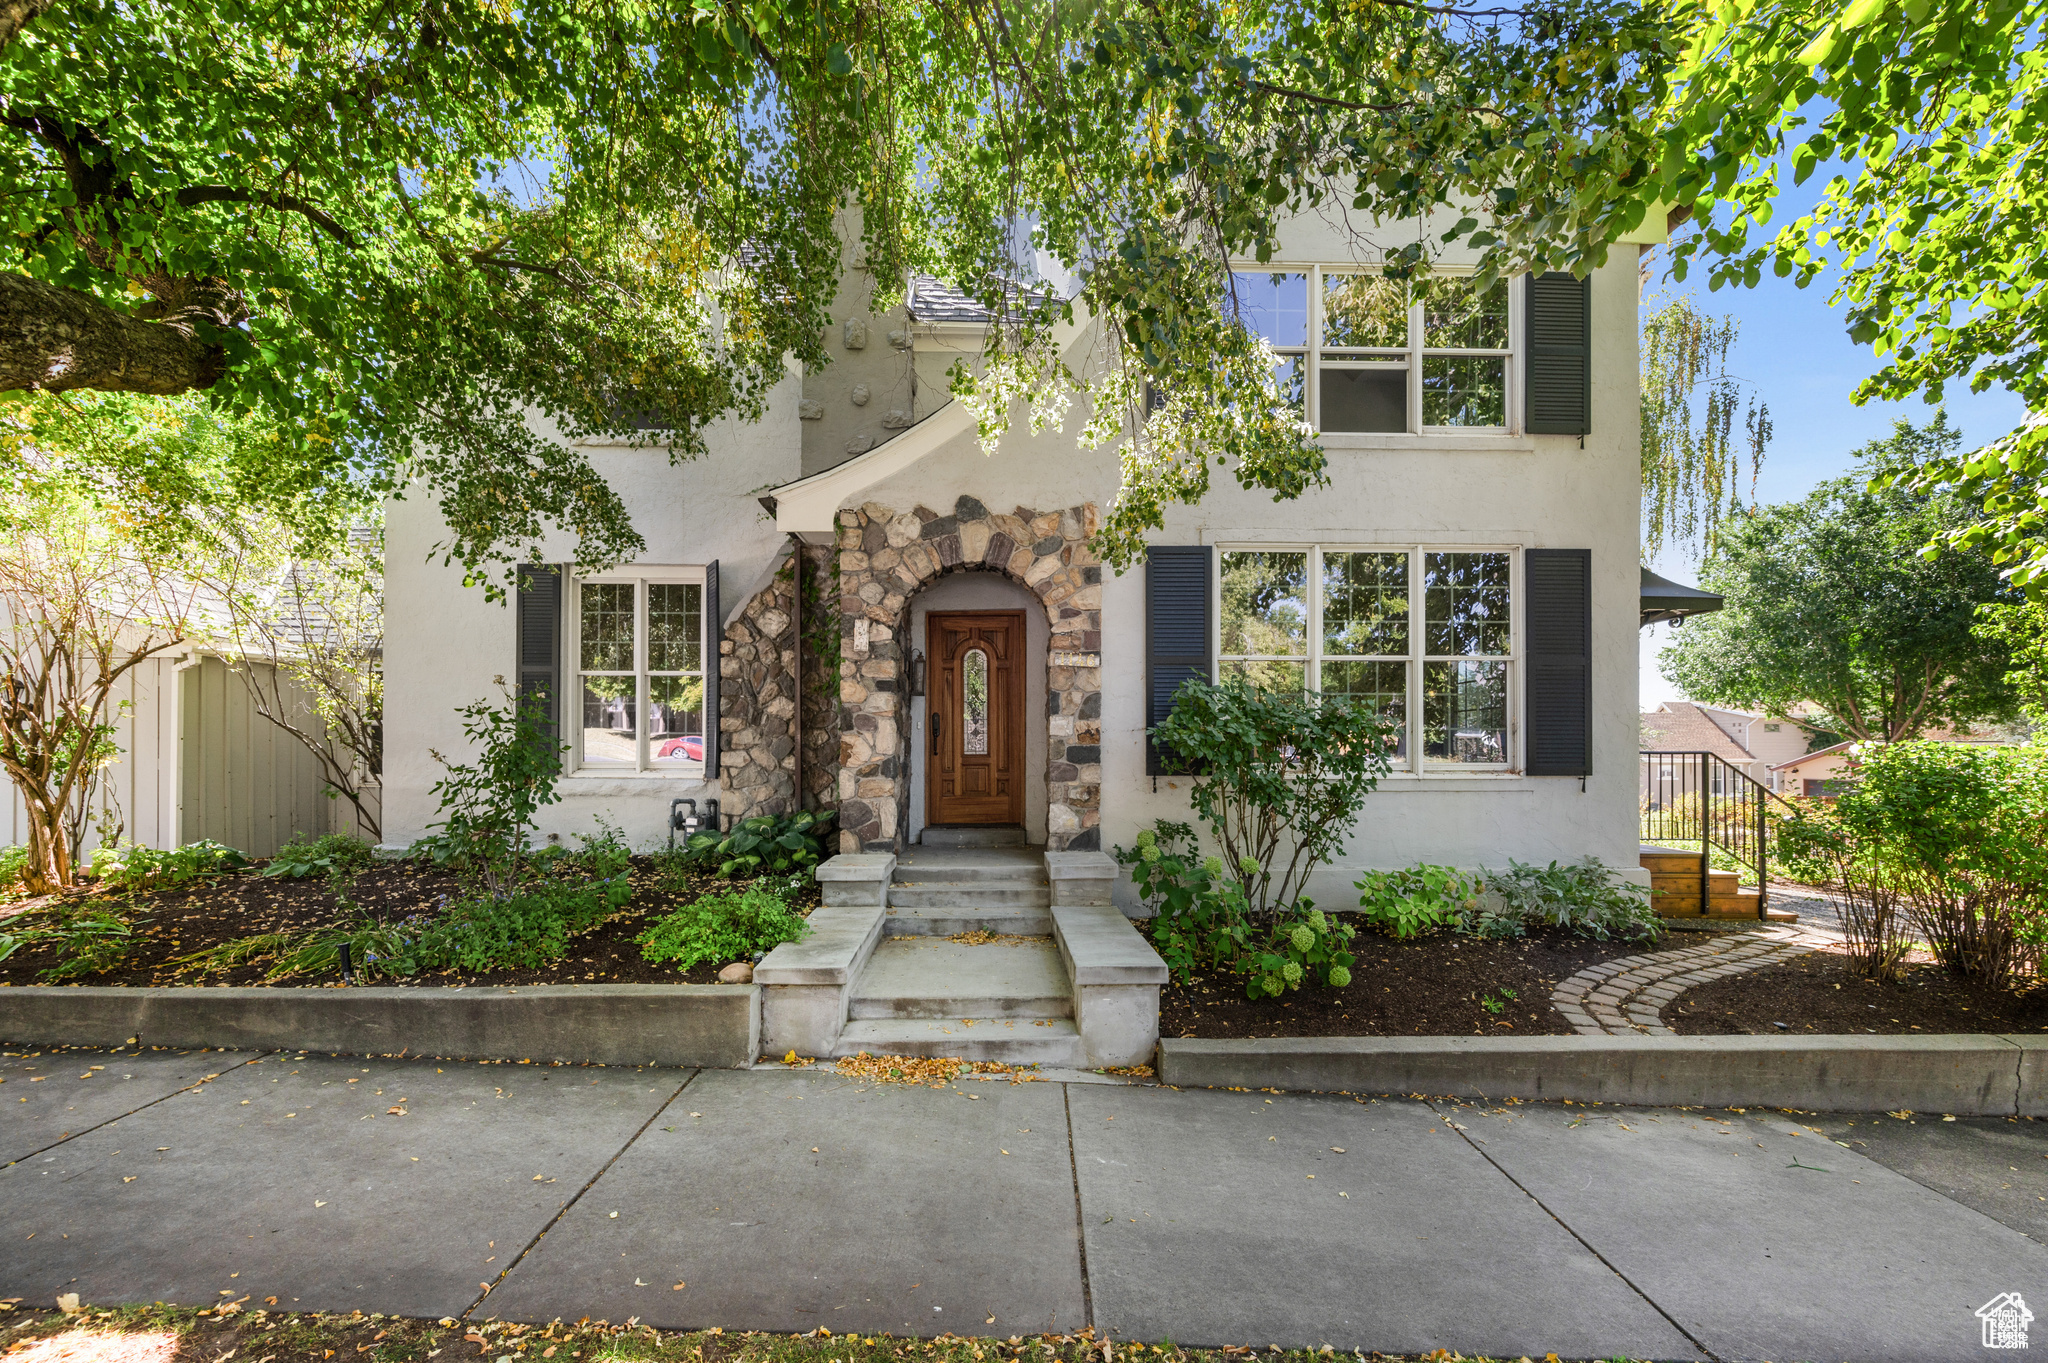
$799,000
3
bds
|
3
ba
|
2,153
sqft
|
built
1905
1330 S 1100 E, Salt Lake City, UT 84105
$-2,209
Cash flow
-14.4%
Cash-on-Cash Return
3.0%
Cap rate
0.4%
Rent to Value Ratio
Active
$559,000
4
bds
|
2
ba
|
1,728
sqft
|
built
1978
956 N 1300 W, Salt Lake City, UT 84116
$-1,893
Cash flow
-17.7%
Cash-on-Cash Return
2.2%
Cap rate
0.3%
Rent to Value Ratio
Active
$895,000
8
bds
|
4
ba
|
3,350
sqft
|
built
1960
385 N 1200 W, Salt Lake City, UT 84116
$-3,397
Cash flow
-19.8%
Cash-on-Cash Return
1.7%
Cap rate
0.3%
Rent to Value Ratio
Active
$1,250,000
6
bds
|
4
ba
|
3,611
sqft
|
built
1898
1146 E 600 S, Salt Lake City, UT 84102
$-2,014
Cash flow
-8.4%
Cash-on-Cash Return
4.4%
Cap rate
0.6%
Rent to Value Ratio
Active
$1,525,000
7
bds
|
7
ba
|
3,110
sqft
|
built
1891
936 E 1700 S, Salt Lake City, UT 84105
$-5,363
Cash flow
-18.3%
Cash-on-Cash Return
2.1%
Cap rate
0.3%
Rent to Value Ratio
Active
$850,000
3
bds
|
3
ba
|
2,189
sqft
|
built
2024
136 S 700 E, Salt Lake City, UT 84102
$-2,481
Cash flow
-15.2%
Cash-on-Cash Return
2.8%
Cap rate
0.4%
Rent to Value Ratio
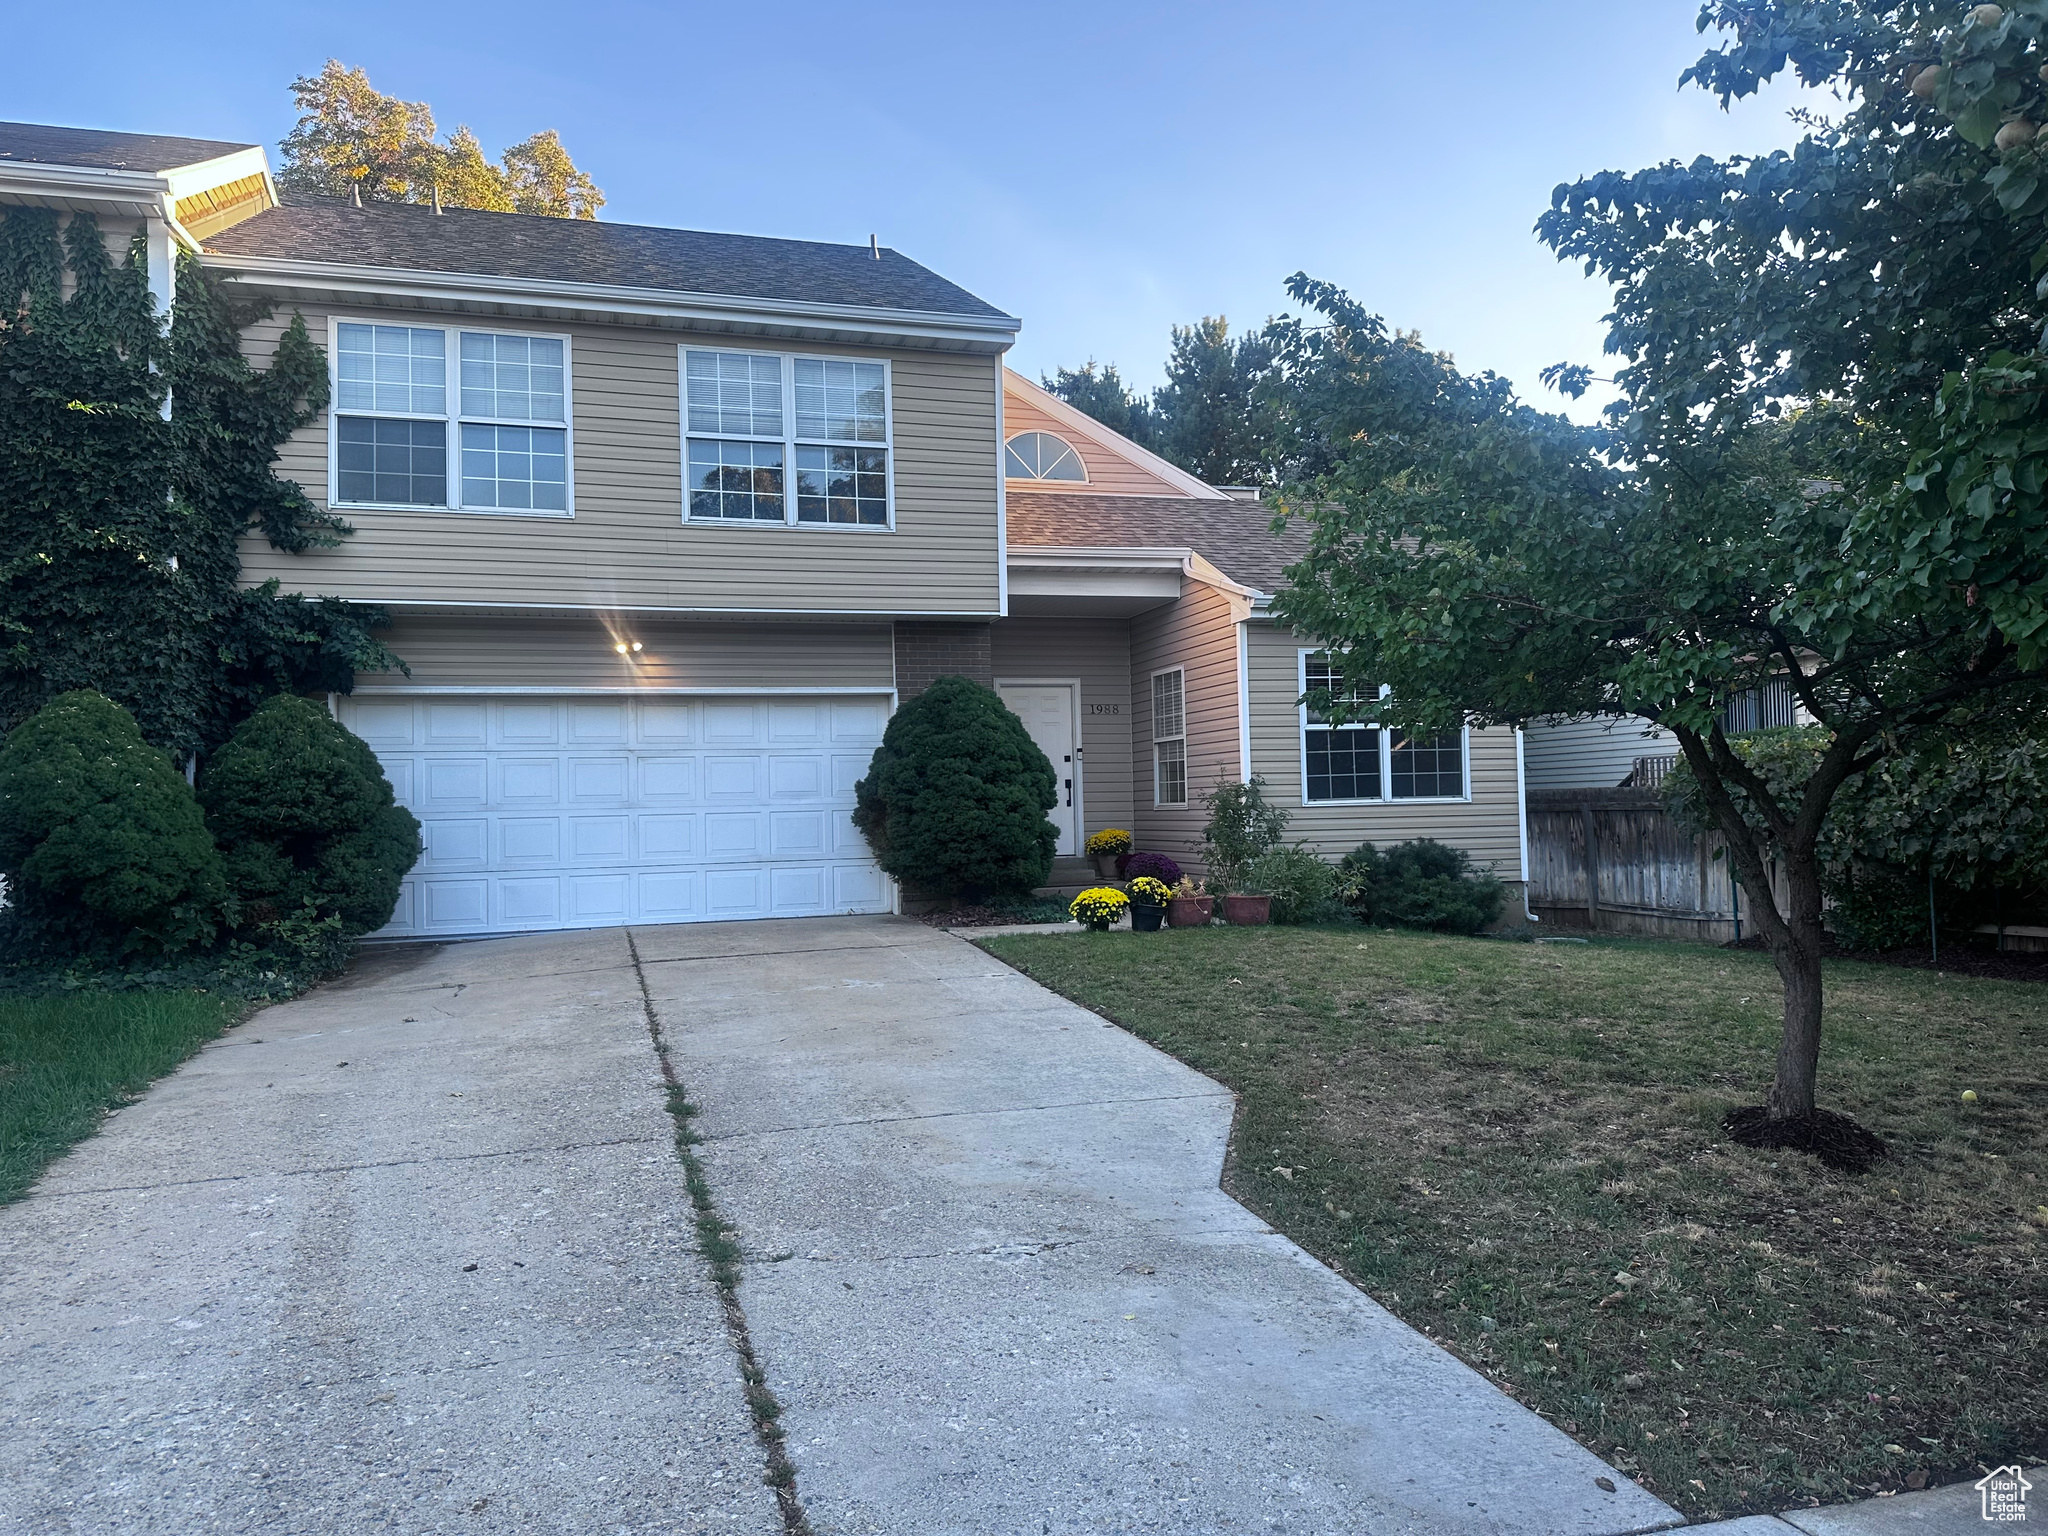
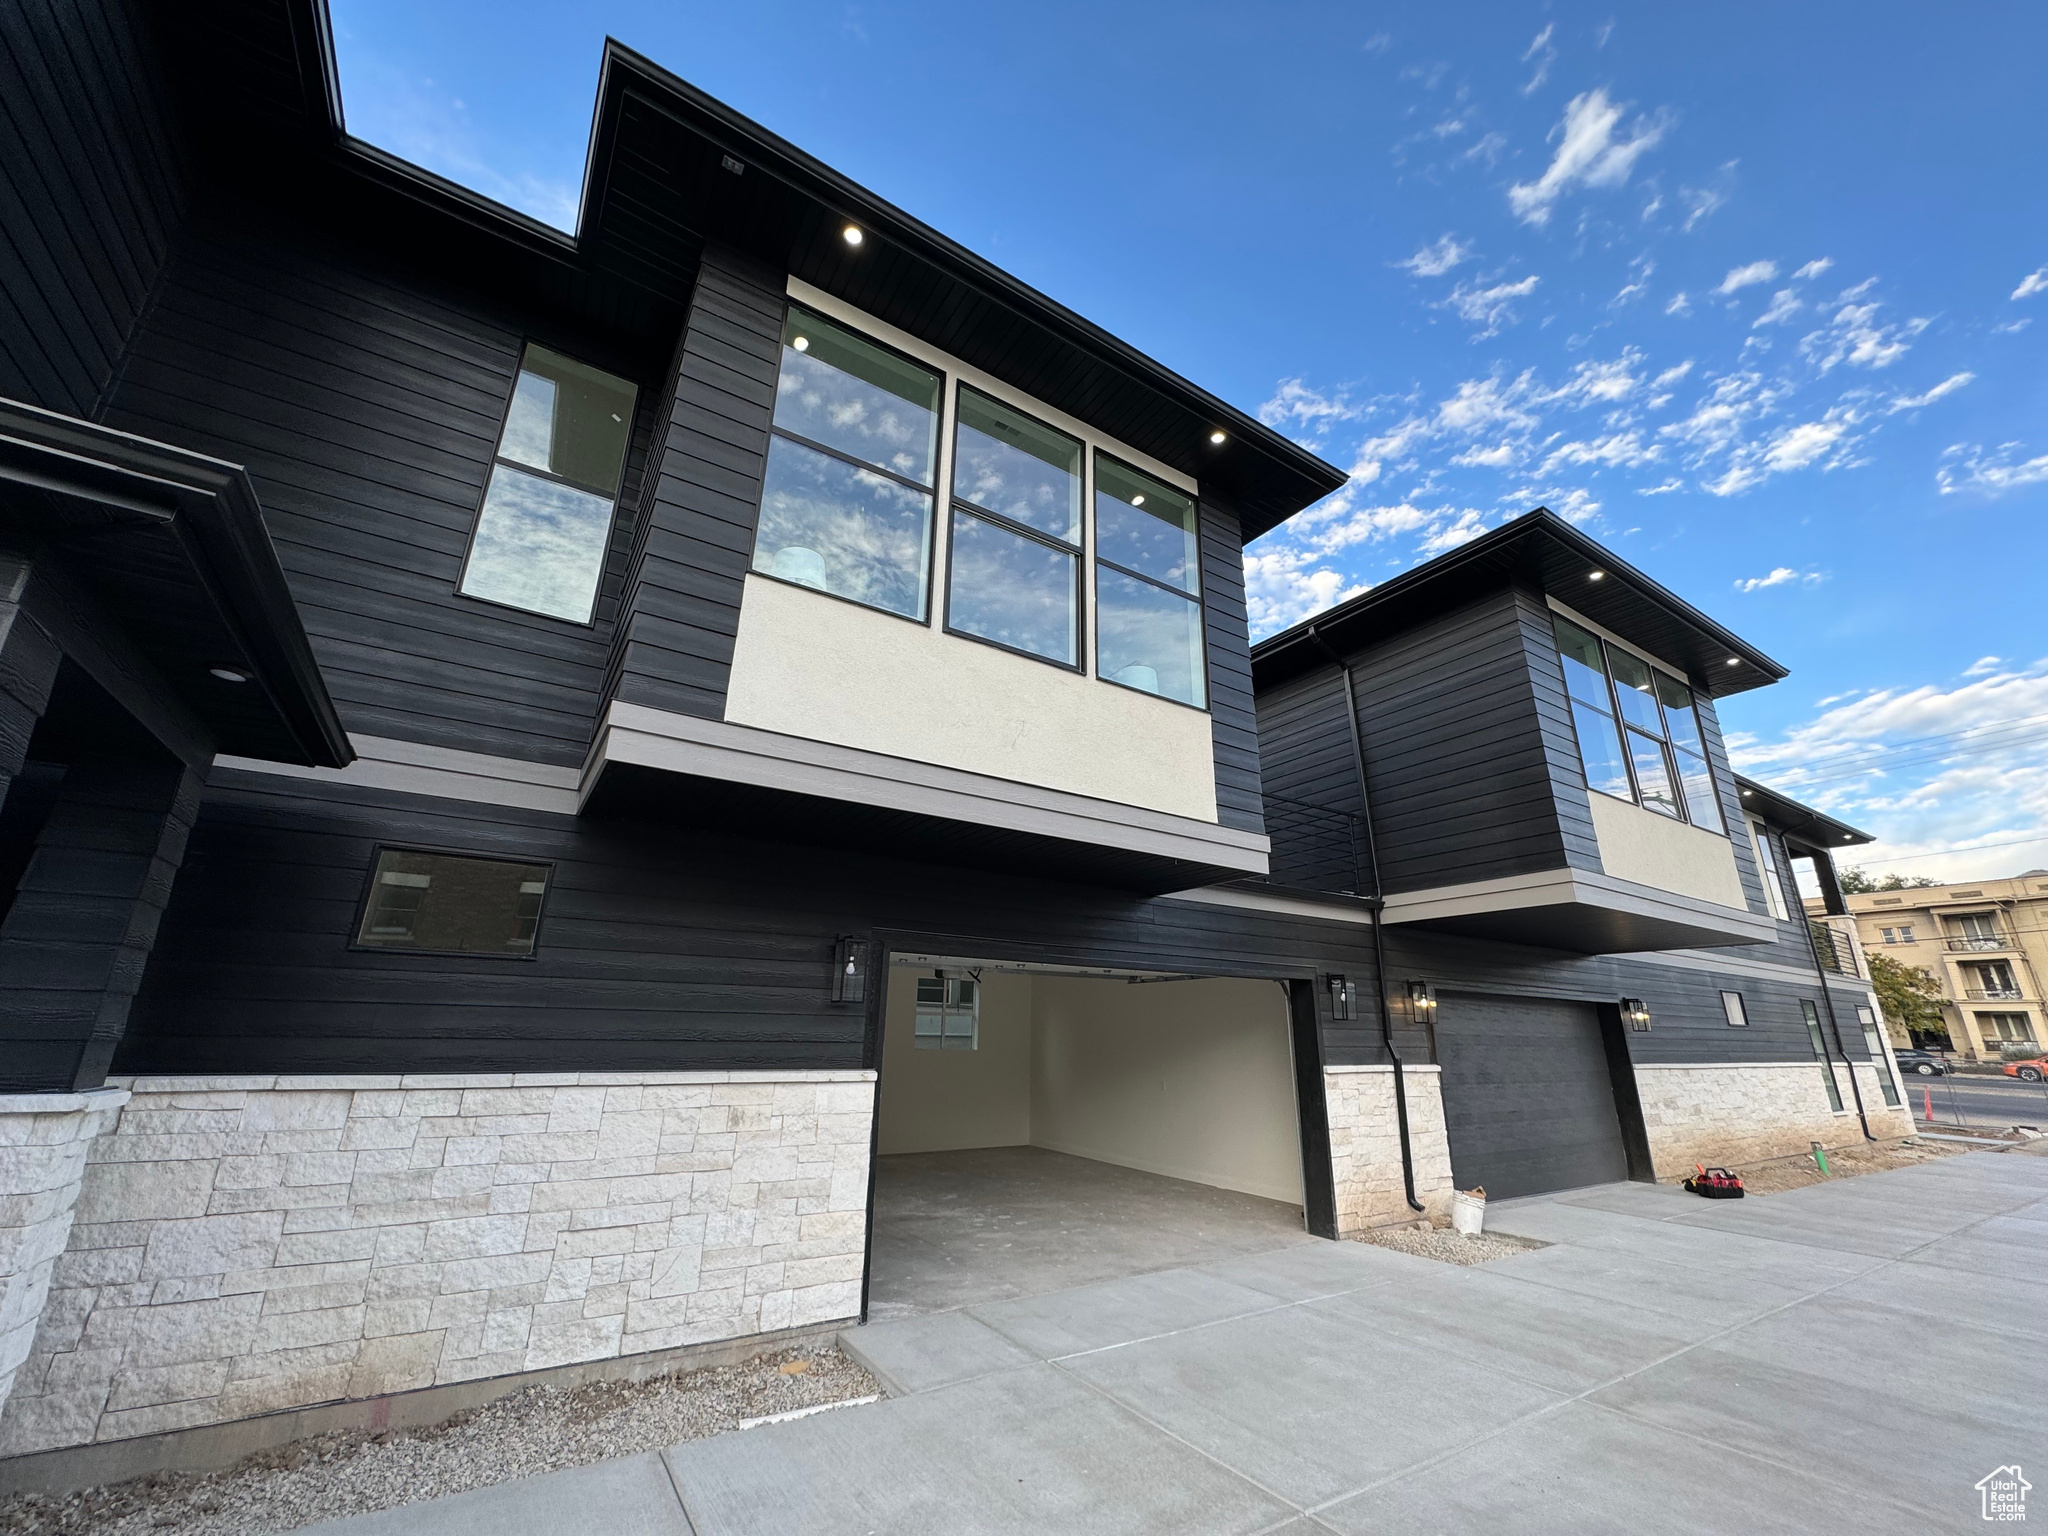
Active
$629,500
4
bds
|
4
ba
|
2,250
sqft
|
built
1987
1988 E 3080 S, Salt Lake City, UT 84106
$-1,902
Cash flow
-15.8%
Cash-on-Cash Return
2.7%
Cap rate
0.4%
Rent to Value Ratio
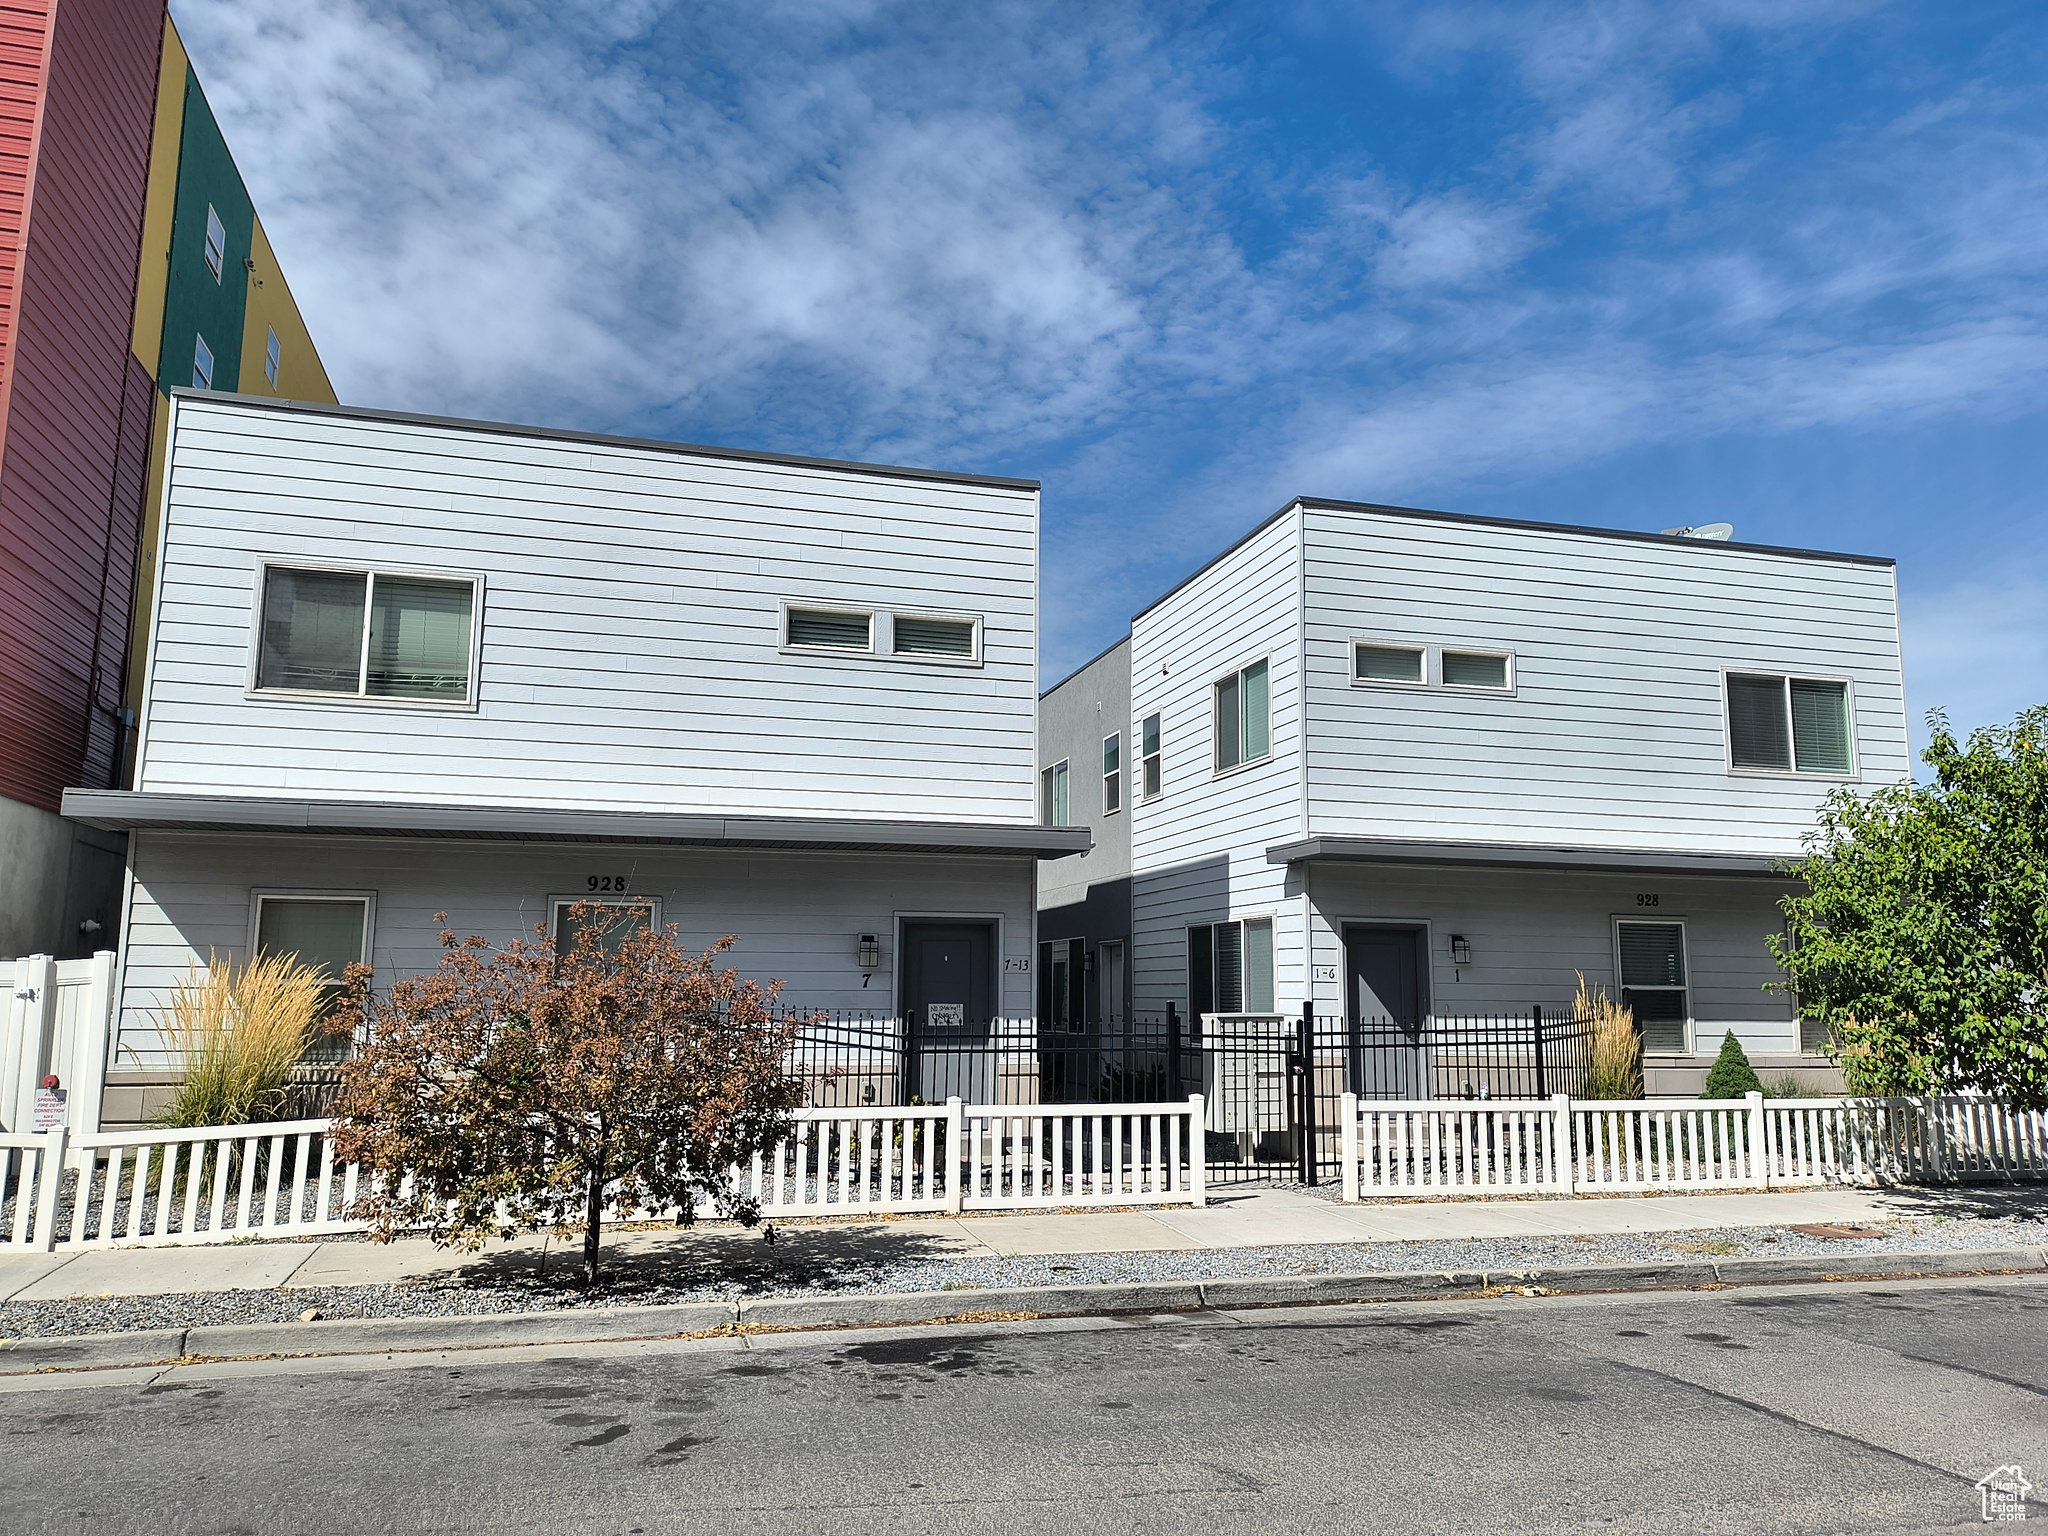
Active
$4,250,000
26
bds
|
39
ba
|
12,584
sqft
|
built
2018
928 S Washington St, Salt Lake City, UT 84101
$-22,376
Cash flow
-27.5%
Cash-on-Cash Return
0.0%
Cap rate
0.1%
Rent to Value Ratio
Active
$720,000
4
bds
|
4
ba
|
2,200
sqft
|
built
1960
3366 S 700 E, Salt Lake City, UT 84106
$-2,046
Cash flow
-14.8%
Cash-on-Cash Return
2.9%
Cap rate
0.4%
Rent to Value Ratio