San Antonio, TX Investment Properties for Sale
Browse homes for sale and investment properties in San Antonio, TX. Refine your search by price, property type, or more.
Best cash flowing properties in San Antonio, TX
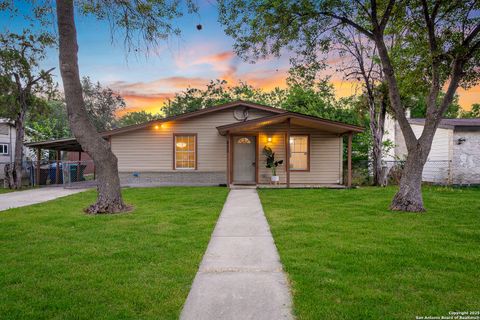
Active
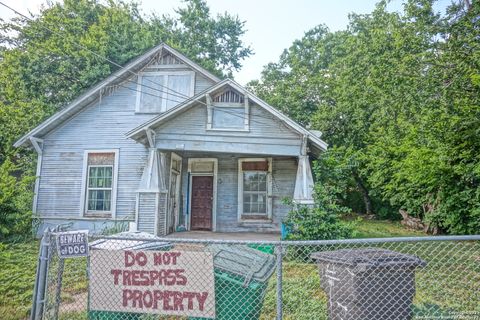
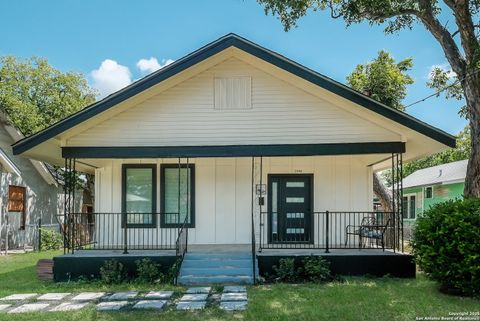
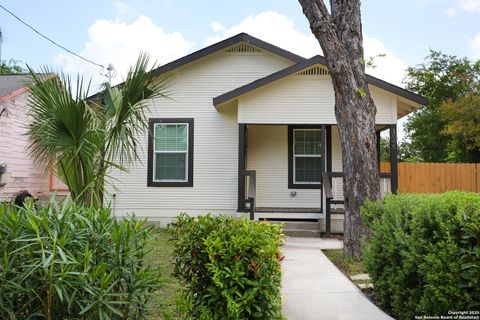
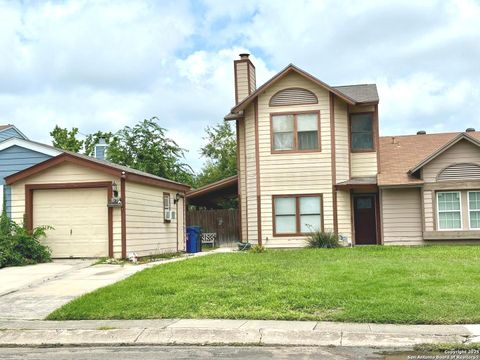
$85,000
2
bds
|
1
ba
|
980
sqft
|
built
1930
535 Mary St, San Antonio, TX 78214
$420
Cash flow
25.8%
Cash-on-Cash Return
12.2%
Cap rate
1.9%
Rent to Value Ratio
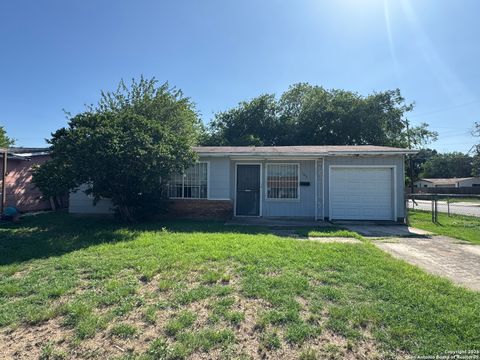
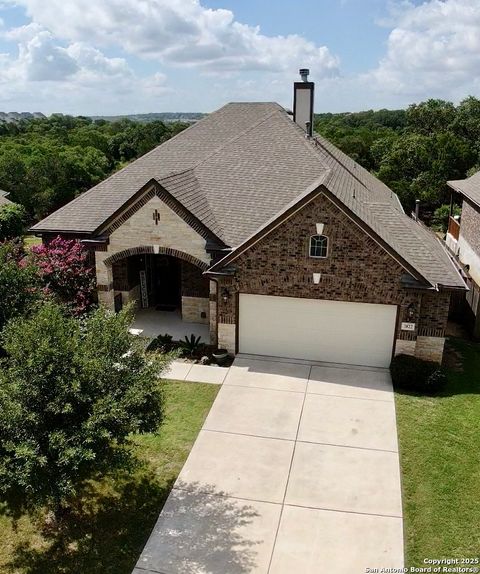
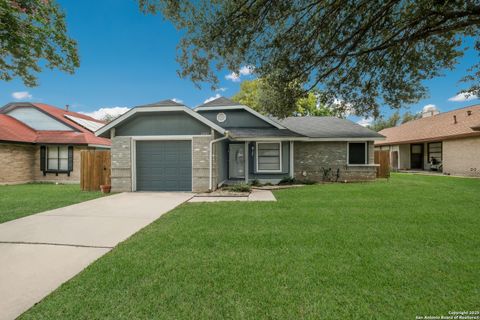
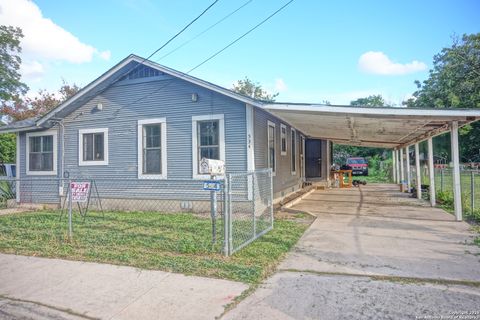
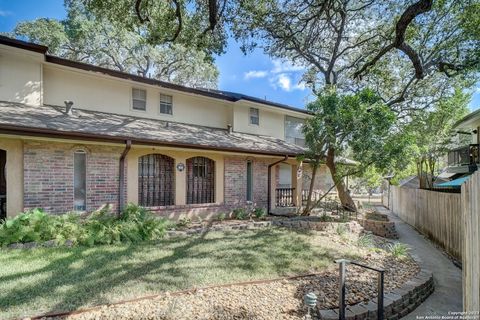
Active
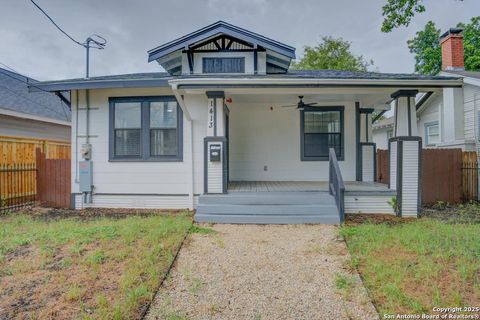
$85,000
2
bds
|
1
ba
|
906
sqft
|
built
1954
103 Nellina St, San Antonio, TX 78220
$233
Cash flow
14.3%
Cash-on-Cash Return
9.6%
Cap rate
1.5%
Rent to Value Ratio
6,150 out of 6,446 properties for sale in San Antonio, TX
Limited Results Shown
Create a free account, or log in to reveal all property listings and enjoy the complete experience.
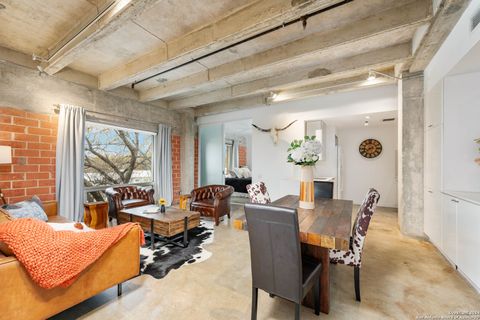
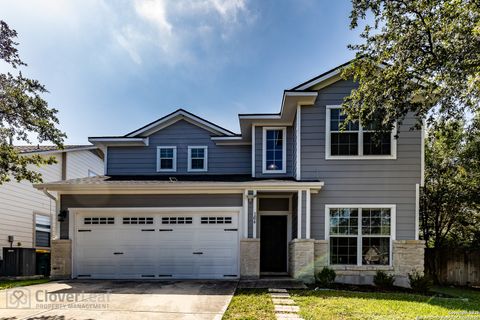
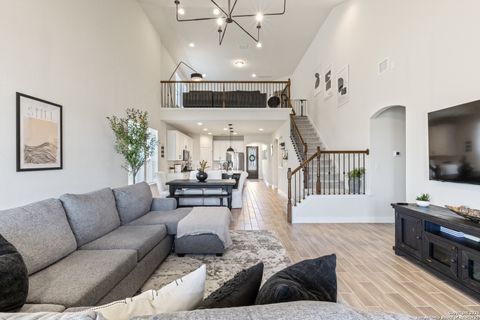
Active
$495,000
2
bds
|
2
ba
|
1,093
sqft
|
built
2008
1115 S Alamo St, San Antonio, TX 78210
$-2,168
Cash flow
-22.9%
Cash-on-Cash Return
1.0%
Cap rate
0.5%
Rent to Value Ratio
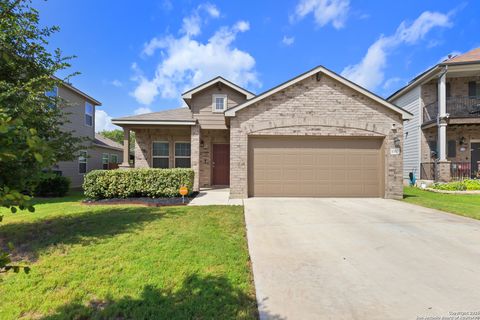
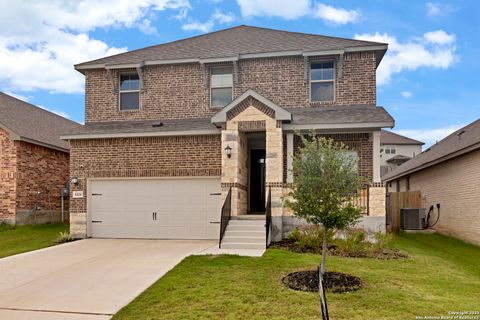
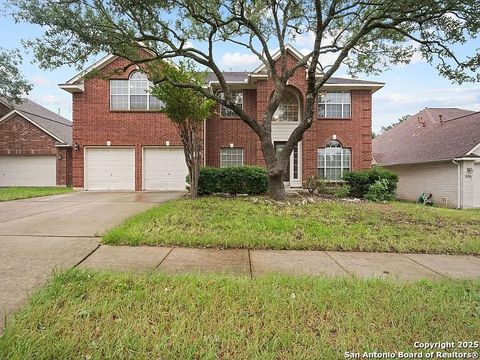
Active
$300,000
3
bds
|
2
ba
|
1,835
sqft
|
built
2020
10650 Jasmine Blf, San Antonio, TX 78245
$-575
Cash flow
-10.0%
Cash-on-Cash Return
4.0%
Cap rate
0.7%
Rent to Value Ratio
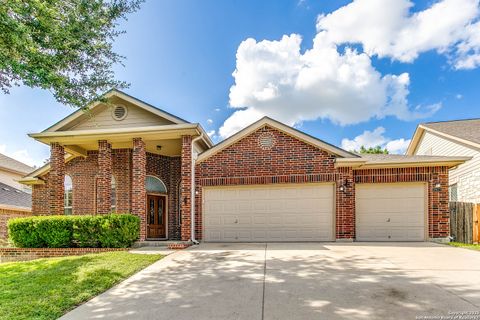
Active
$299,000
3
bds
|
2
ba
|
1,922
sqft
|
built
2019
10310 Balmorhea, San Antonio, TX 78252
$-786
Cash flow
-13.7%
Cash-on-Cash Return
3.1%
Cap rate
0.7%
Rent to Value Ratio
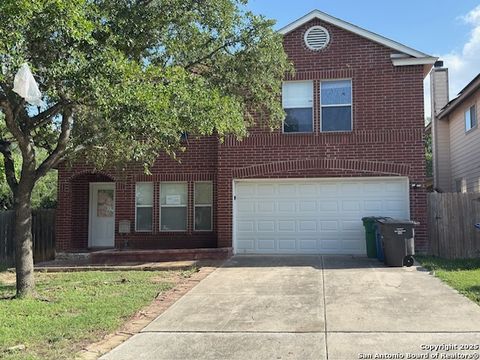
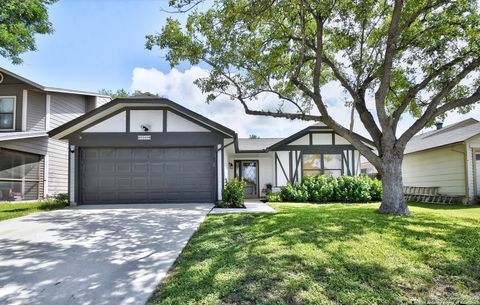
Active
$299,900
4
bds
|
3
ba
|
2,400
sqft
|
built
1996
7422 Ben Crenshaw Ct, San Antonio, TX 78244
$-552
Cash flow
-9.6%
Cash-on-Cash Return
4.1%
Cap rate
0.7%
Rent to Value Ratio
Active
$229,900
3
bds
|
3
ba
|
2,365
sqft
|
built
2007
13007 Southton Run, San Antonio, TX 78223
$-344
Cash flow
-7.8%
Cash-on-Cash Return
4.5%
Cap rate
0.8%
Rent to Value Ratio
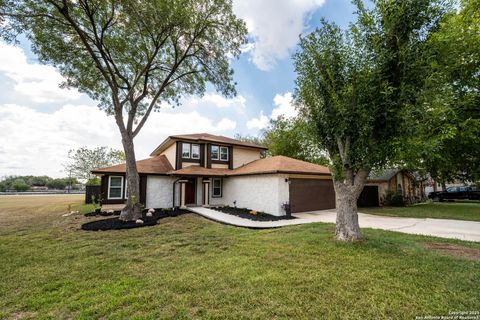
Active
$370,000
3
bds
|
2
ba
|
1,675
sqft
|
built
1956
250 Maplewood Ln, San Antonio, TX 78216
$-670
Cash flow
-9.4%
Cash-on-Cash Return
4.1%
Cap rate
0.5%
Rent to Value Ratio
Active
$205,000
2
bds
|
1
ba
|
1,108
sqft
|
built
1940
2506 Saunders Ave, San Antonio, TX 78207
$-561
Cash flow
-14.3%
Cash-on-Cash Return
3.0%
Cap rate
0.6%
Rent to Value Ratio
Active
$559,999
4
bds
|
3
ba
|
2,212
sqft
|
built
2014
3822 Cordoba Crk, San Antonio, TX 78259
$-2,070
Cash flow
-19.3%
Cash-on-Cash Return
1.8%
Cap rate
0.5%
Rent to Value Ratio
Active
$350,000
3
bds
|
2
ba
|
1,914
sqft
|
built
1983
1719 Encino Crst, San Antonio, TX 78259
$-922
Cash flow
-13.7%
Cash-on-Cash Return
3.1%
Cap rate
0.7%
Rent to Value Ratio
Active
$240,000
3
bds
|
1
ba
|
1,408
sqft
|
built
1941
1133 Donaldson Ave, San Antonio, TX 78228
$-589
Cash flow
-12.8%
Cash-on-Cash Return
3.3%
Cap rate
0.7%
Rent to Value Ratio
Active
$375,000
4
bds
|
3
ba
|
2,374
sqft
|
built
2022
1424 Pelagos Path, San Antonio, TX 78245
$-978
Cash flow
-13.6%
Cash-on-Cash Return
3.1%
Cap rate
0.6%
Rent to Value Ratio
Active
$249,000
3
bds
|
3
ba
|
1,128
sqft
|
built
2001
11442 Blue Mesa Dr, San Antonio, TX 78245
$-477
Cash flow
-10.0%
Cash-on-Cash Return
4.0%
Cap rate
0.6%
Rent to Value Ratio
Active
$175,000
3
bds
|
1
ba
|
884
sqft
|
built
1962
835 Deely Pl, San Antonio, TX 78221
$-194
Cash flow
-5.8%
Cash-on-Cash Return
4.9%
Cap rate
0.9%
Rent to Value Ratio
Active
$409,700
4
bds
|
3
ba
|
2,928
sqft
|
built
2004
106 Red Willow, San Antonio, TX 78260
$-973
Cash flow
-12.4%
Cash-on-Cash Return
3.4%
Cap rate
0.7%
Rent to Value Ratio
Active
$360,000
3
bds
|
3
ba
|
1,394
sqft
|
built
2024
706 Martin Luther King Dr, San Antonio, TX 78203
$-880
Cash flow
-12.8%
Cash-on-Cash Return
3.3%
Cap rate
0.6%
Rent to Value Ratio
Active
$409,900
3
bds
|
2
ba
|
1,842
sqft
|
built
2017
6544 Robards Row St, San Antonio, TX 78233
$-1,666
Cash flow
-21.2%
Cash-on-Cash Return
1.4%
Cap rate
0.4%
Rent to Value Ratio
Active
$437,000
5
bds
|
3
ba
|
2,509
sqft
|
built
1966
7147 Oakridge, San Antonio, TX 78229
$-1,554
Cash flow
-18.6%
Cash-on-Cash Return
2.0%
Cap rate
0.6%
Rent to Value Ratio
Active
$420,000
3
bds
|
3
ba
|
2,274
sqft
|
built
1961
119 Shadywood Ln, San Antonio, TX 78216
$-1,303
Cash flow
-16.2%
Cash-on-Cash Return
2.5%
Cap rate
0.5%
Rent to Value Ratio
Active
$309,900
4
bds
|
3
ba
|
2,538
sqft
|
built
2001
10567 Dugas Dr, San Antonio, TX 78245
$-810
Cash flow
-13.6%
Cash-on-Cash Return
3.1%
Cap rate
0.6%
Rent to Value Ratio
Active
$795,000
3
bds
|
3
ba
|
2,652
sqft
|
built
2007
7 Grantham Gln, San Antonio, TX 78257
$-3,109
Cash flow
-20.4%
Cash-on-Cash Return
1.6%
Cap rate
0.5%
Rent to Value Ratio
Active
$240,000
4
bds
|
2
ba
|
2,170
sqft
|
built
1980
6914 Ludgate, San Antonio, TX 78239
$-318
Cash flow
-6.9%
Cash-on-Cash Return
4.7%
Cap rate
0.8%
Rent to Value Ratio
Active
$475,000
3
bds
|
3
ba
|
1,966
sqft
|
built
1948
237 Wellesley Blvd, San Antonio, TX 78209
$-1,430
Cash flow
-15.7%
Cash-on-Cash Return
2.7%
Cap rate
0.6%
Rent to Value Ratio
Active
$210,000
3
bds
|
2
ba
|
1,268
sqft
|
built
1986
7259 Sunlit Trail Dr, San Antonio, TX 78244
$-243
Cash flow
-6.0%
Cash-on-Cash Return
4.9%
Cap rate
0.8%
Rent to Value Ratio
Active
$85,000
2
bds
|
1
ba
|
906
sqft
|
built
1954
103 Nellina St, San Antonio, TX 78220
$233
Cash flow
14.3%
Cash-on-Cash Return
9.6%
Cap rate
1.5%
Rent to Value Ratio
Active
$419,900
5
bds
|
4
ba
|
3,217
sqft
|
built
2005
8519 Vineyard Mist, San Antonio, TX 78255
$-932
Cash flow
-11.6%
Cash-on-Cash Return
3.6%
Cap rate
0.7%
Rent to Value Ratio
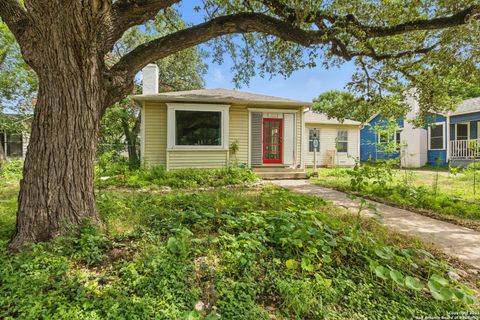
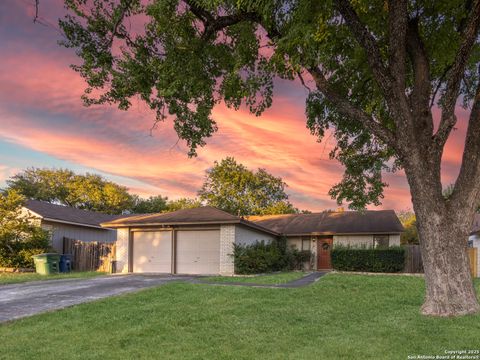
Active
$220,000
3
bds
|
1
ba
|
1,140
sqft
|
built
1940
534 Mary St, San Antonio, TX 78214
$-687
Cash flow
-16.3%
Cash-on-Cash Return
2.5%
Cap rate
0.6%
Rent to Value Ratio
Active
$237,000
3
bds
|
2
ba
|
1,393
sqft
|
built
1981
14416 Bluewood Dr, San Antonio, TX 78233
$-478
Cash flow
-10.5%
Cash-on-Cash Return
3.8%
Cap rate
0.7%
Rent to Value Ratio
Active
$215,000
2
bds
|
1
ba
|
820
sqft
|
built
1945
1049 Sacramento, San Antonio, TX 78201
$-571
Cash flow
-13.9%
Cash-on-Cash Return
3.1%
Cap rate
0.5%
Rent to Value Ratio
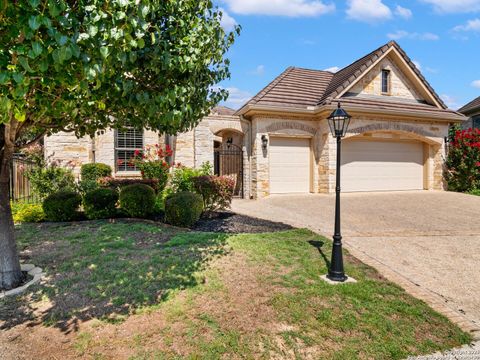
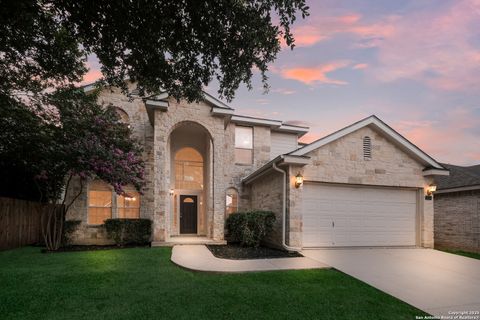
Active
$449,000
3
bds
|
3
ba
|
2,738
sqft
|
built
1999
1106 Calico Spg, San Antonio, TX 78258
$-1,626
Cash flow
-18.9%
Cash-on-Cash Return
1.9%
Cap rate
0.5%
Rent to Value Ratio
Active
$299,000
2
bds
|
2
ba
|
1,005
sqft
|
built
1930
1413 Burnet St, San Antonio, TX 78202
$-1,215
Cash flow
-21.2%
Cash-on-Cash Return
1.4%
Cap rate
0.4%
Rent to Value Ratio

Active
$219,500
3
bds
|
2
ba
|
1,178
sqft
|
built
2015
6322 Channel Vw, San Antonio, TX 78222
$-323
Cash flow
-7.7%
Cash-on-Cash Return
4.5%
Cap rate
0.7%
Rent to Value Ratio
Active
$359,000
4
bds
|
2
ba
|
2,262
sqft
|
built
2005
10623 Welsh Vly, San Antonio, TX 78254
$-864
Cash flow
-12.6%
Cash-on-Cash Return
3.4%
Cap rate
0.6%
Rent to Value Ratio
Active
$900,000
4
bds
|
3
ba
|
2,894
sqft
|
built
2018
8822 Falcon Pl, San Antonio, TX 78256
$-2,824
Cash flow
-16.4%
Cash-on-Cash Return
2.5%
Cap rate
0.5%
Rent to Value Ratio
Active
$225,000
4
bds
|
2
ba
|
1,336
sqft
|
built
1984
4026 Sunrise Pass, San Antonio, TX 78244
$-394
Cash flow
-9.1%
Cash-on-Cash Return
4.2%
Cap rate
0.7%
Rent to Value Ratio
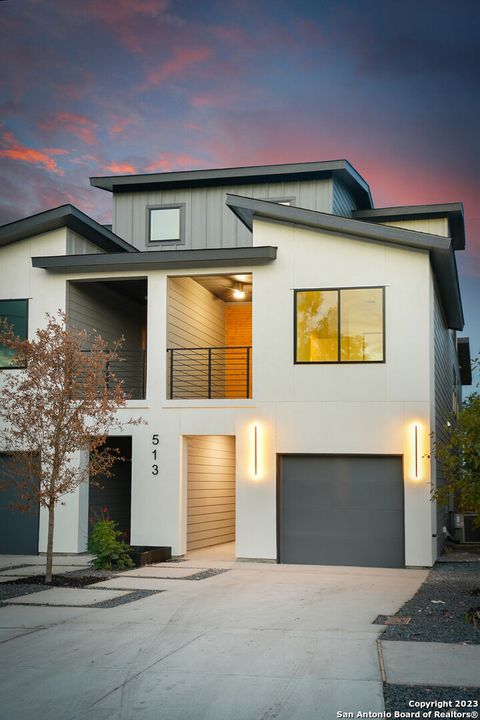
Active
$399,900
3
bds
|
3
ba
|
1,615
sqft
|
built
2022
513 S Olive St, San Antonio, TX 78203
$-1,039
Cash flow
-13.6%
Cash-on-Cash Return
3.1%
Cap rate
0.6%
Rent to Value Ratio
Active
$85,000
2
bds
|
1
ba
|
980
sqft
|
built
1930
535 Mary St, San Antonio, TX 78214
$420
Cash flow
25.8%
Cash-on-Cash Return
12.2%
Cap rate
1.9%
Rent to Value Ratio
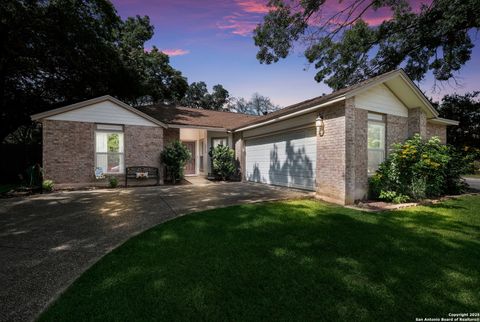
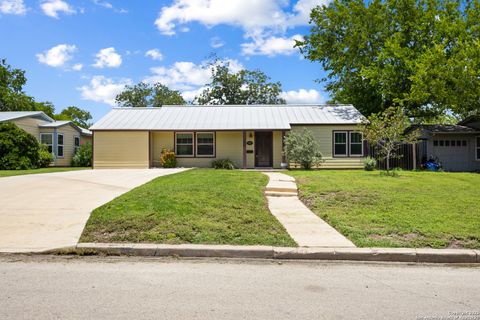
Active
$180,000
3
bds
|
2
ba
|
1,608
sqft
|
built
1952
1231 NW 36th St, San Antonio, TX 78228
$2
Cash flow
0.1%
Cash-on-Cash Return
6.3%
Cap rate
1.0%
Rent to Value Ratio
Active
$195,000
3
bds
|
3
ba
|
1,247
sqft
|
built
1984
11733 Spring Ridge Dr, San Antonio, TX 78249
$-433
Cash flow
-11.6%
Cash-on-Cash Return
3.6%
Cap rate
0.7%
Rent to Value Ratio
Active
$224,998
3
bds
|
3
ba
|
2,021
sqft
|
built
1973
8915 Datapoint Dr, San Antonio, TX 78229
$-1,167
Cash flow
-27.1%
Cash-on-Cash Return
0.0%
Cap rate
0.9%
Rent to Value Ratio
Active
$453,000
4
bds
|
3
ba
|
2,553
sqft
|
built
2023
2130 Dalhart, San Antonio, TX 78253
$-1,384
Cash flow
-15.9%
Cash-on-Cash Return
2.6%
Cap rate
0.6%
Rent to Value Ratio