Sandwich, MA Investment Properties for Sale
Browse homes for sale and investment properties in Sandwich, MA. Refine your search by price, property type, or more.
Best cash flowing properties in Sandwich, MA
Active
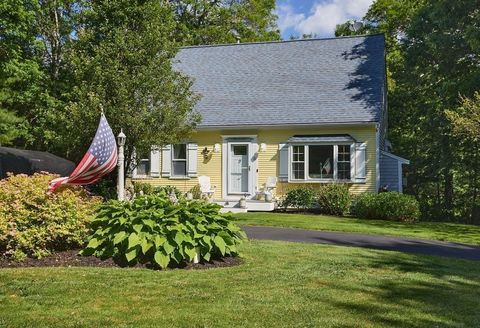
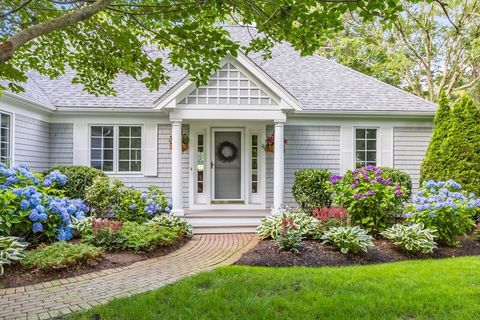
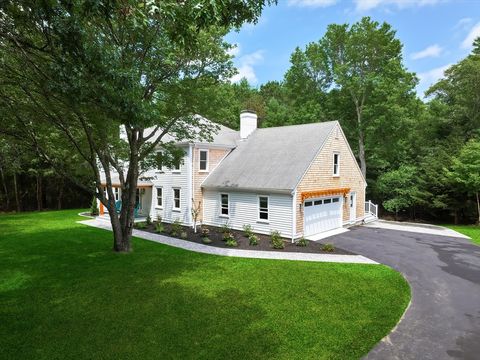
$669,000
3
bds
|
2
ba
|
1,547
sqft
|
built
1994
10 Ryder Cir, Sandwich, MA 02563
$-1,127
Cash flow
-8.8%
Cash-on-Cash Return
3.7%
Cap rate
0.5%
Rent to Value Ratio
Active
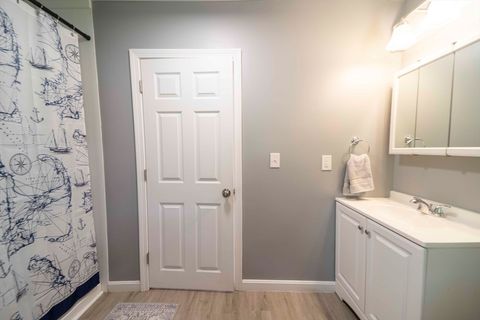
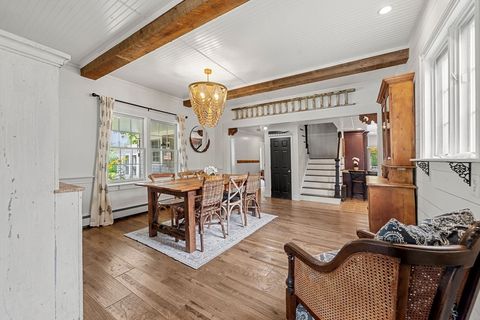
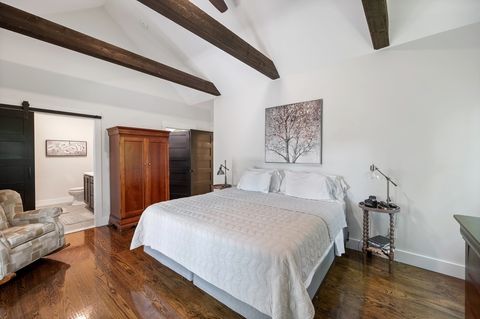
$669,000
2
bds
|
3
ba
|
1,760
sqft
|
built
2018
5 Whiffletree Cir, Sandwich, MA 02563
$-1,202
Cash flow
-9.4%
Cash-on-Cash Return
3.5%
Cap rate
0.5%
Rent to Value Ratio
26 out of 44 properties for sale in Sandwich, MA
Limited Results Shown
Create a free account, or log in to reveal all property listings and enjoy the complete experience.
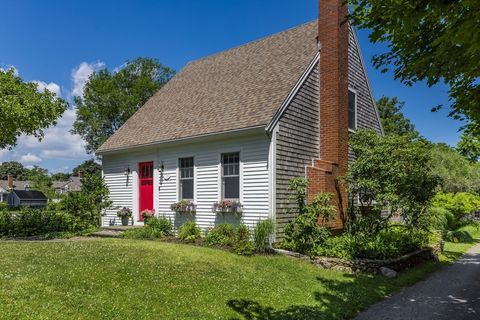
Active
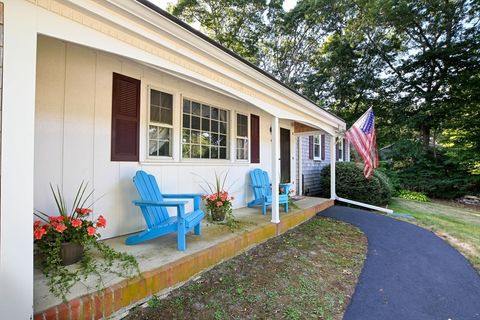
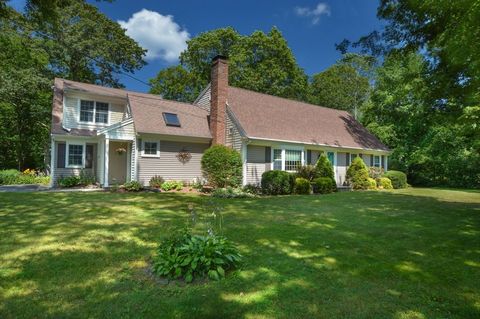
$739,000
3
bds
|
2
ba
|
1,484
sqft
|
built
1972
4 Royal Cir, Sandwich, MA 02563
$-1,795
Cash flow
-12.7%
Cash-on-Cash Return
2.8%
Cap rate
0.4%
Rent to Value Ratio
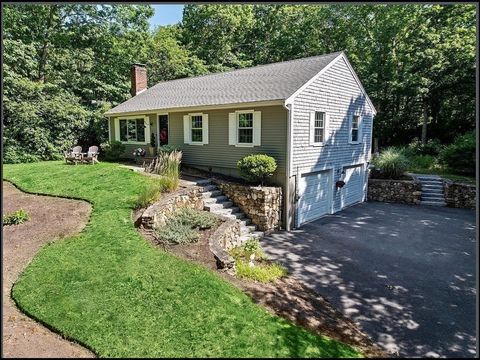
Active
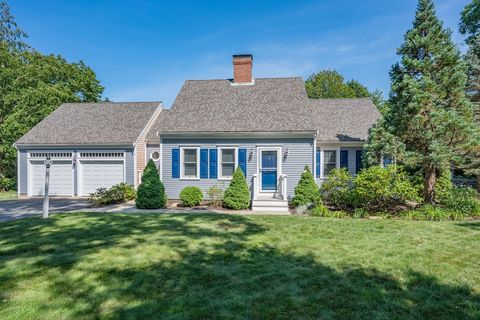
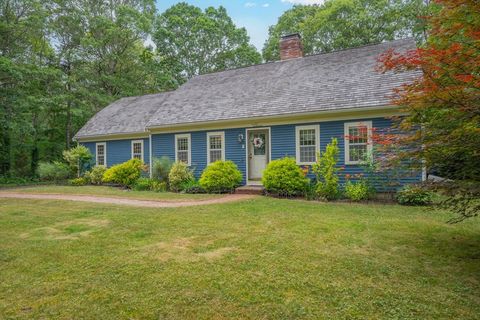
$830,000
3
bds
|
3
ba
|
1,805
sqft
|
built
2000
1 Leveridge Ln, Sandwich, MA 02563
$-2,281
Cash flow
-14.3%
Cash-on-Cash Return
2.4%
Cap rate
0.4%
Rent to Value Ratio
Active
$1,100,000
2
bds
|
3
ba
|
3,195
sqft
|
built
1998
111 Reflection Dr, Sandwich, MA 02563
$-4,600
Cash flow
-21.8%
Cash-on-Cash Return
0.7%
Cap rate
0.3%
Rent to Value Ratio
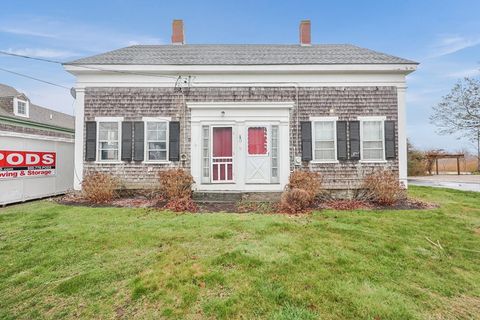
Active
$899,000
3
bds
|
2
ba
|
1,950
sqft
|
built
1857
43 Jarves St, Sandwich, MA 02563
$-2,294
Cash flow
-13.3%
Cash-on-Cash Return
2.6%
Cap rate
0.4%
Rent to Value Ratio
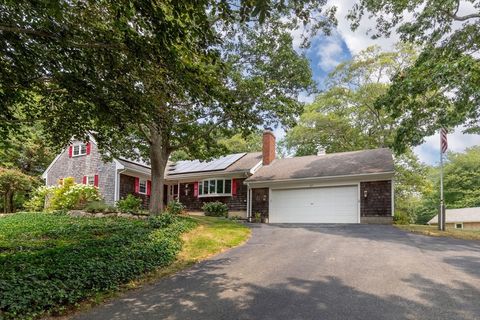
Active
$879,000
3
bds
|
2
ba
|
2,603
sqft
|
built
1971
1 Surrey Ln, Sandwich, MA 02563
$-2,088
Cash flow
-12.4%
Cash-on-Cash Return
2.8%
Cap rate
0.4%
Rent to Value Ratio
Active
$839,900
3
bds
|
3
ba
|
2,550
sqft
|
built
1986
7 Barnside Ln, Sandwich, MA 02563
$-1,809
Cash flow
-11.2%
Cash-on-Cash Return
3.1%
Cap rate
0.5%
Rent to Value Ratio
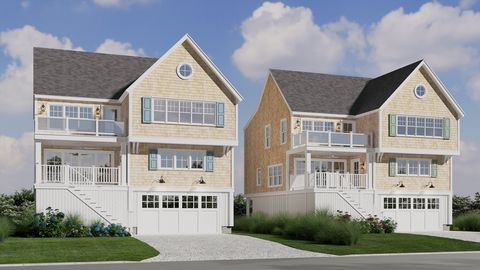
Active
$1,550,000
3
bds
|
3
ba
|
1,902
sqft
|
built
2025
12 Freeman Ave, Sandwich, MA 02563
$-6,257
Cash flow
-21.1%
Cash-on-Cash Return
0.8%
Cap rate
0.1%
Rent to Value Ratio
Active
$889,900
4
bds
|
3
ba
|
2,778
sqft
|
built
1971
27 Moody Dr, Sandwich, MA 02563
$-1,678
Cash flow
-9.8%
Cash-on-Cash Return
3.4%
Cap rate
0.5%
Rent to Value Ratio
Active
$639,000
3
bds
|
2
ba
|
1,336
sqft
|
built
2001
163 Cotuit Rd, Sandwich, MA 02563
$-1,350
Cash flow
-11.0%
Cash-on-Cash Return
3.1%
Cap rate
0.5%
Rent to Value Ratio
Active
$924,999
3
bds
|
2
ba
|
1,200
sqft
|
built
2024
54 Carman Ave, Sandwich, MA 02563
$-2,117
Cash flow
-11.9%
Cash-on-Cash Return
2.9%
Cap rate
0.4%
Rent to Value Ratio
Active
$1,349,000
4
bds
|
3
ba
|
2,960
sqft
|
built
1989
7 Highfield Dr, Sandwich, MA 02563
$-3,958
Cash flow
-15.3%
Cash-on-Cash Return
2.2%
Cap rate
0.3%
Rent to Value Ratio
Active
$1,300,000
4
bds
|
3
ba
|
2,965
sqft
|
built
2019
59 Main St, Sandwich, MA 02563
$-4,516
Cash flow
-18.1%
Cash-on-Cash Return
1.5%
Cap rate
0.3%
Rent to Value Ratio
Active
$979,900
2
bds
|
2
ba
|
1,621
sqft
|
built
1987
5 Canary St, Sandwich, MA 02563
$-2,540
Cash flow
-13.5%
Cash-on-Cash Return
2.6%
Cap rate
0.4%
Rent to Value Ratio
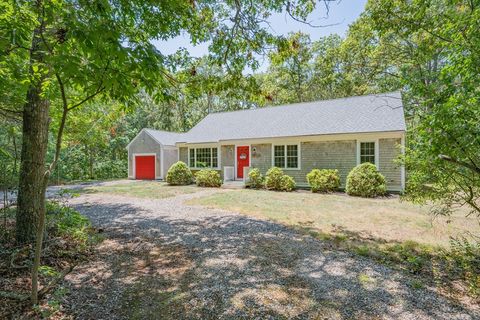
Active
$699,000
3
bds
|
2
ba
|
1,144
sqft
|
built
1976
15 Surrey Ln, Sandwich, MA 02563
$-1,517
Cash flow
-11.3%
Cash-on-Cash Return
3.1%
Cap rate
0.5%
Rent to Value Ratio
Active
$699,900
4
bds
|
2
ba
|
3,108
sqft
|
built
1920
32 Church St, Sandwich, MA 02563
$-1,912
Cash flow
-14.3%
Cash-on-Cash Return
2.4%
Cap rate
0.4%
Rent to Value Ratio
Active
$1,200,000
2
bds
|
2
ba
|
1,683
sqft
|
built
1937
19 Willow St, Sandwich, MA 02563
$-4,194
Cash flow
-18.2%
Cash-on-Cash Return
1.5%
Cap rate
0.3%
Rent to Value Ratio
Active
$1,600,000
4
bds
|
4
ba
|
3,337
sqft
|
built
1960
7 Sunrise Ln, Sandwich, MA 02563
$-5,439
Cash flow
-17.7%
Cash-on-Cash Return
1.6%
Cap rate
0.3%
Rent to Value Ratio
Active
$880,000
4
bds
|
2
ba
|
2,703
sqft
|
built
1740
118 Main St, Sandwich, MA 02563
$-1,935
Cash flow
-11.5%
Cash-on-Cash Return
3.0%
Cap rate
0.5%
Rent to Value Ratio
Active
$6,250,000
4
bds
|
4
ba
|
2,413
sqft
|
built
1940
63 Old Fields Rd, Sandwich, MA 02563
$-29,037
Cash flow
-24.2%
Cash-on-Cash Return
0.1%
Cap rate
0.1%
Rent to Value Ratio

Active
$899,000
2
bds
|
2
ba
|
1,504
sqft
|
built
1951
10 Chadwell Ave, Sandwich, MA 02563
$-2,925
Cash flow
-17.0%
Cash-on-Cash Return
1.8%
Cap rate
0.3%
Rent to Value Ratio

Active
$2,275,000
5
bds
|
6
ba
|
7,270
sqft
|
built
1833
143 Main St, Sandwich, MA 02563
$-6,997
Cash flow
-16.0%
Cash-on-Cash Return
2.0%
Cap rate
0.3%
Rent to Value Ratio

Active
$699,000
2
bds
|
1
ba
|
770
sqft
|
built
1958
357 Phillips Rd, Sandwich, MA 02563
$-2,031
Cash flow
-15.2%
Cash-on-Cash Return
2.2%
Cap rate
0.4%
Rent to Value Ratio

Active
$650,000
4
bds
|
2
ba
|
1,776
sqft
|
built
1978
62 Windsor Rd, Sandwich, MA 02563
$-1,340
Cash flow
-10.8%
Cash-on-Cash Return
3.2%
Cap rate
0.5%
Rent to Value Ratio
Active
$1,899,000
3
bds
|
2
ba
|
1,030
sqft
|
built
1950
311 Phillips Rd, Sandwich, MA 02563
$-6,886
Cash flow
-18.9%
Cash-on-Cash Return
1.3%
Cap rate
0.3%
Rent to Value Ratio