Sandy, UT Investment Properties for Sale
Browse homes for sale and investment properties in Sandy, UT. Refine your search by price, property type, or more.
Best cash flowing properties in Sandy, UT
Active
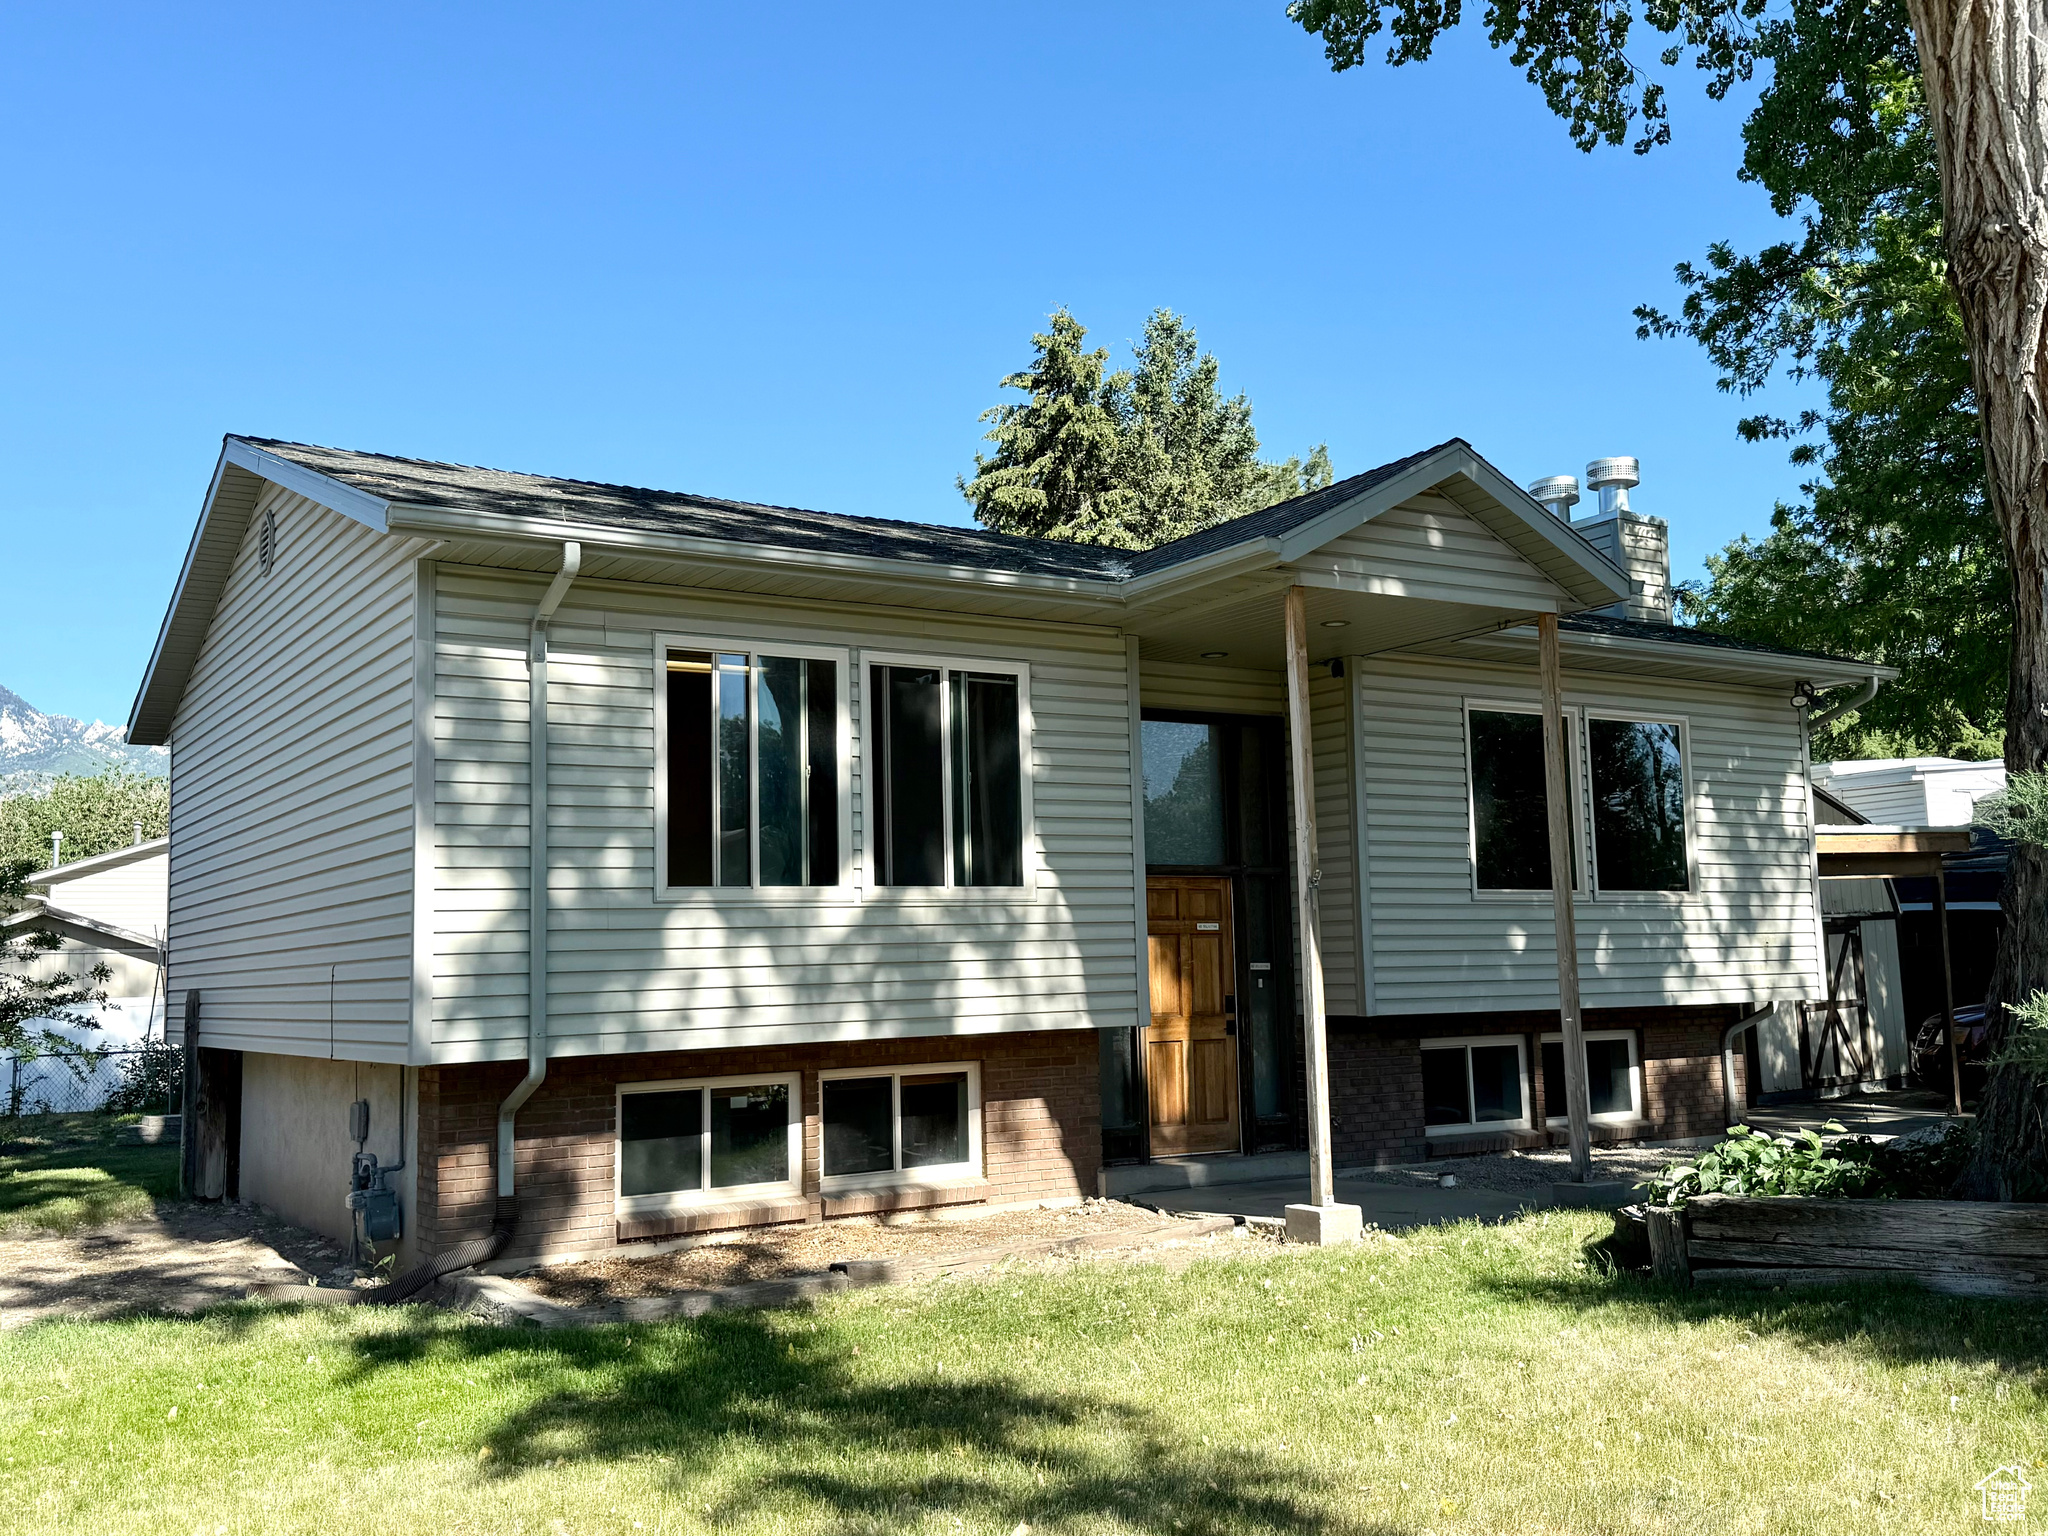
$479,000
5
bds
|
3
ba
|
2,416
sqft
|
built
1978
8335 S 1050 E, Sandy, UT 84094
$-1,037
Cash flow
-11.3%
Cash-on-Cash Return
3.1%
Cap rate
0.5%
Rent to Value Ratio
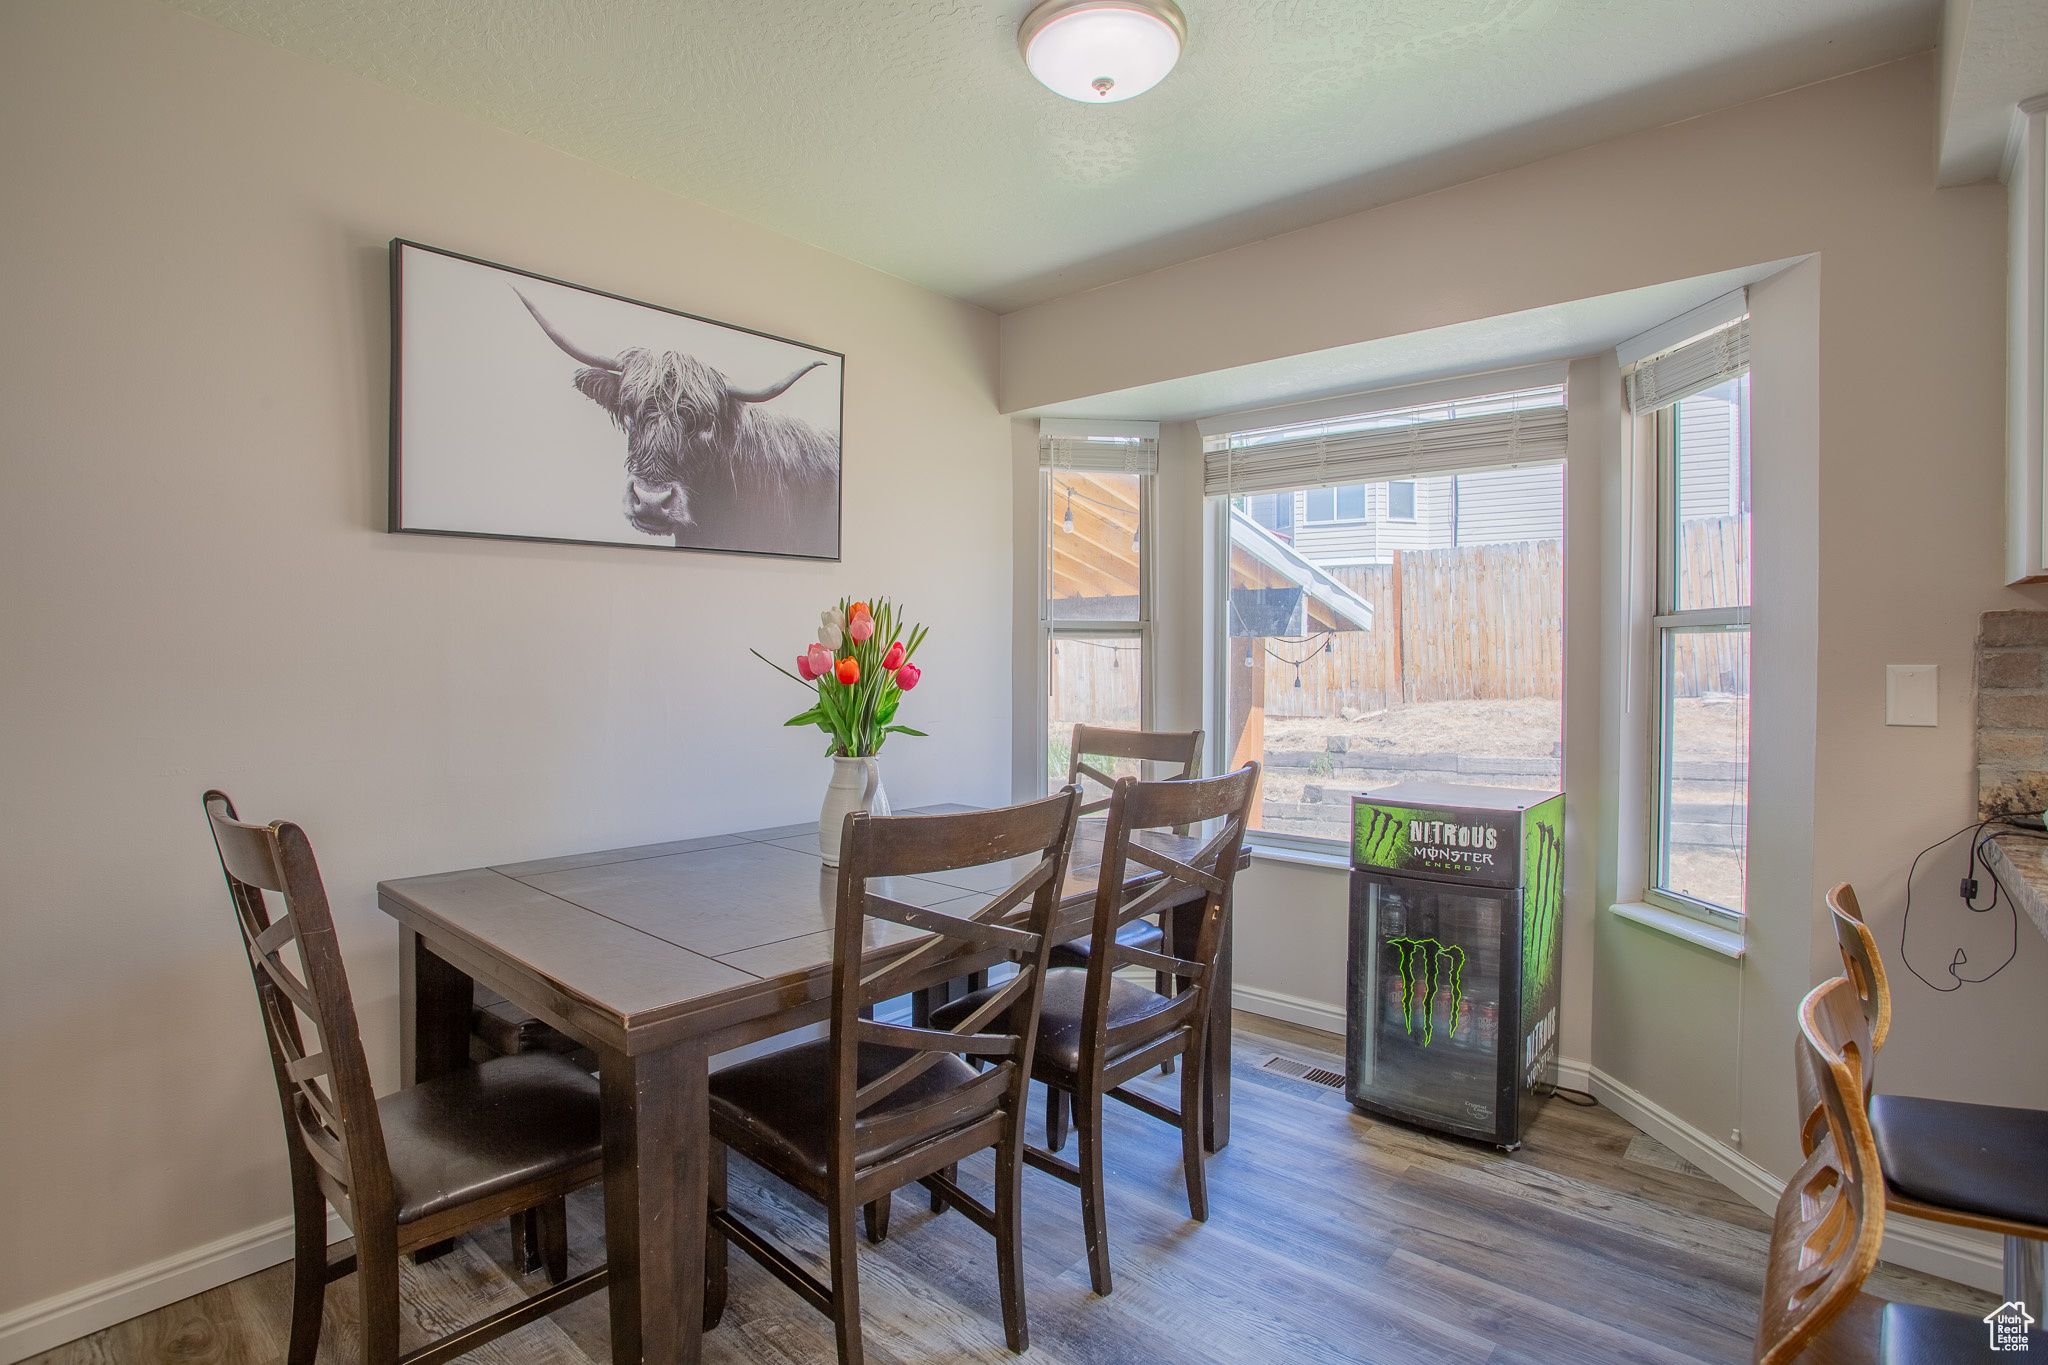
Active
$675,000
4
bds
|
3
ba
|
1,754
sqft
|
built
1972
8485 S 1575 E, Sandy, UT 84093
$-1,066
Cash flow
-8.2%
Cash-on-Cash Return
3.8%
Cap rate
0.5%
Rent to Value Ratio
161 out of 170 properties for sale in Sandy, UT
Limited Results Shown
Create a free account, or log in to reveal all property listings and enjoy the complete experience.
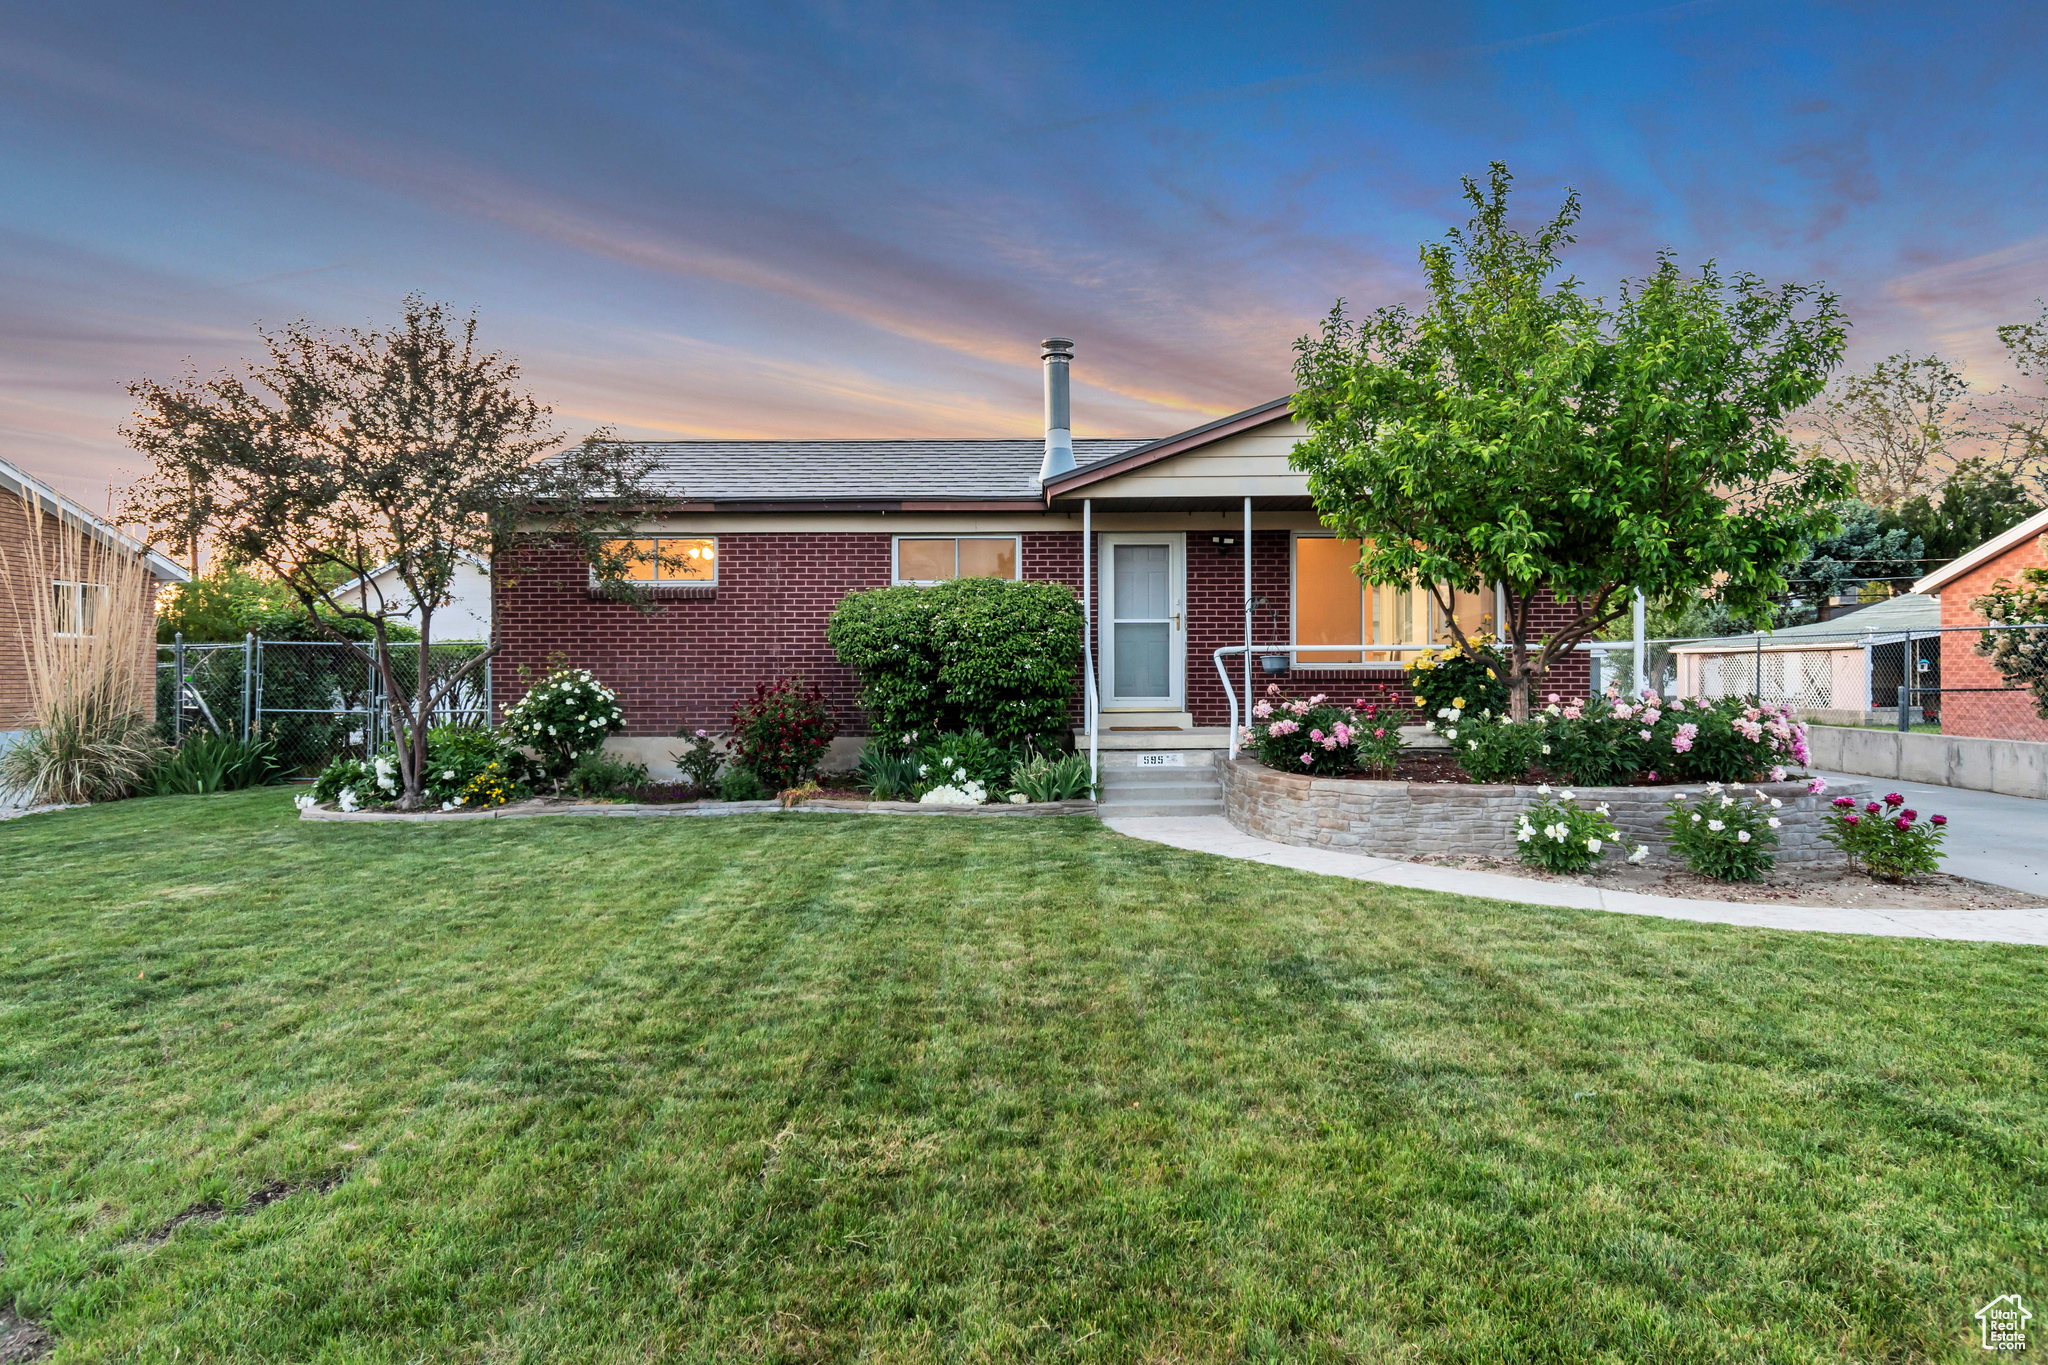
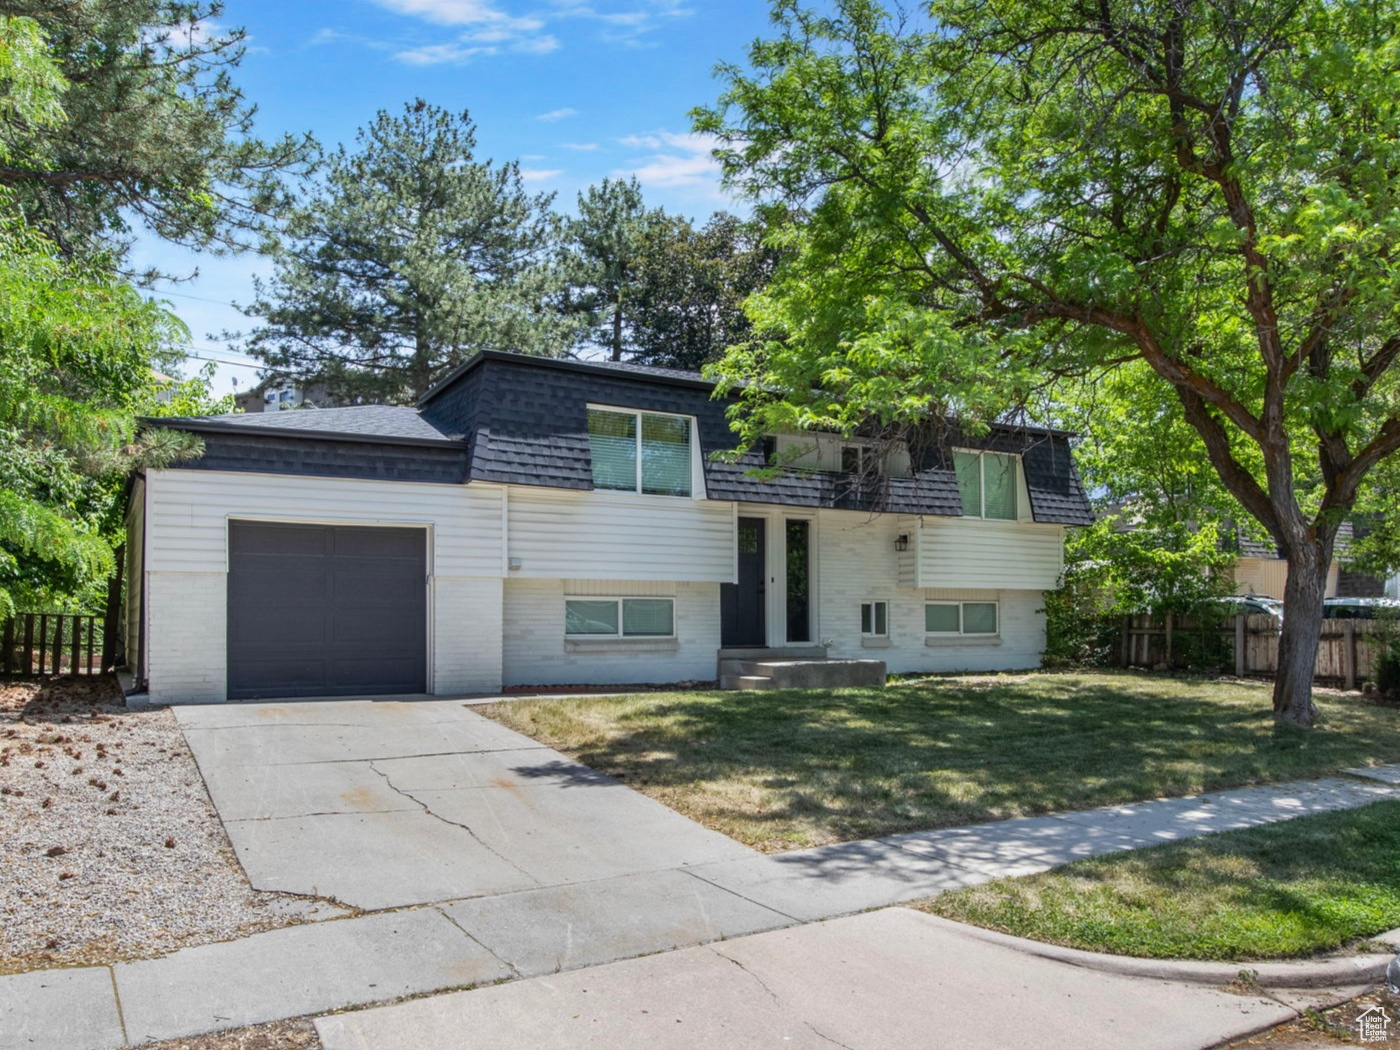
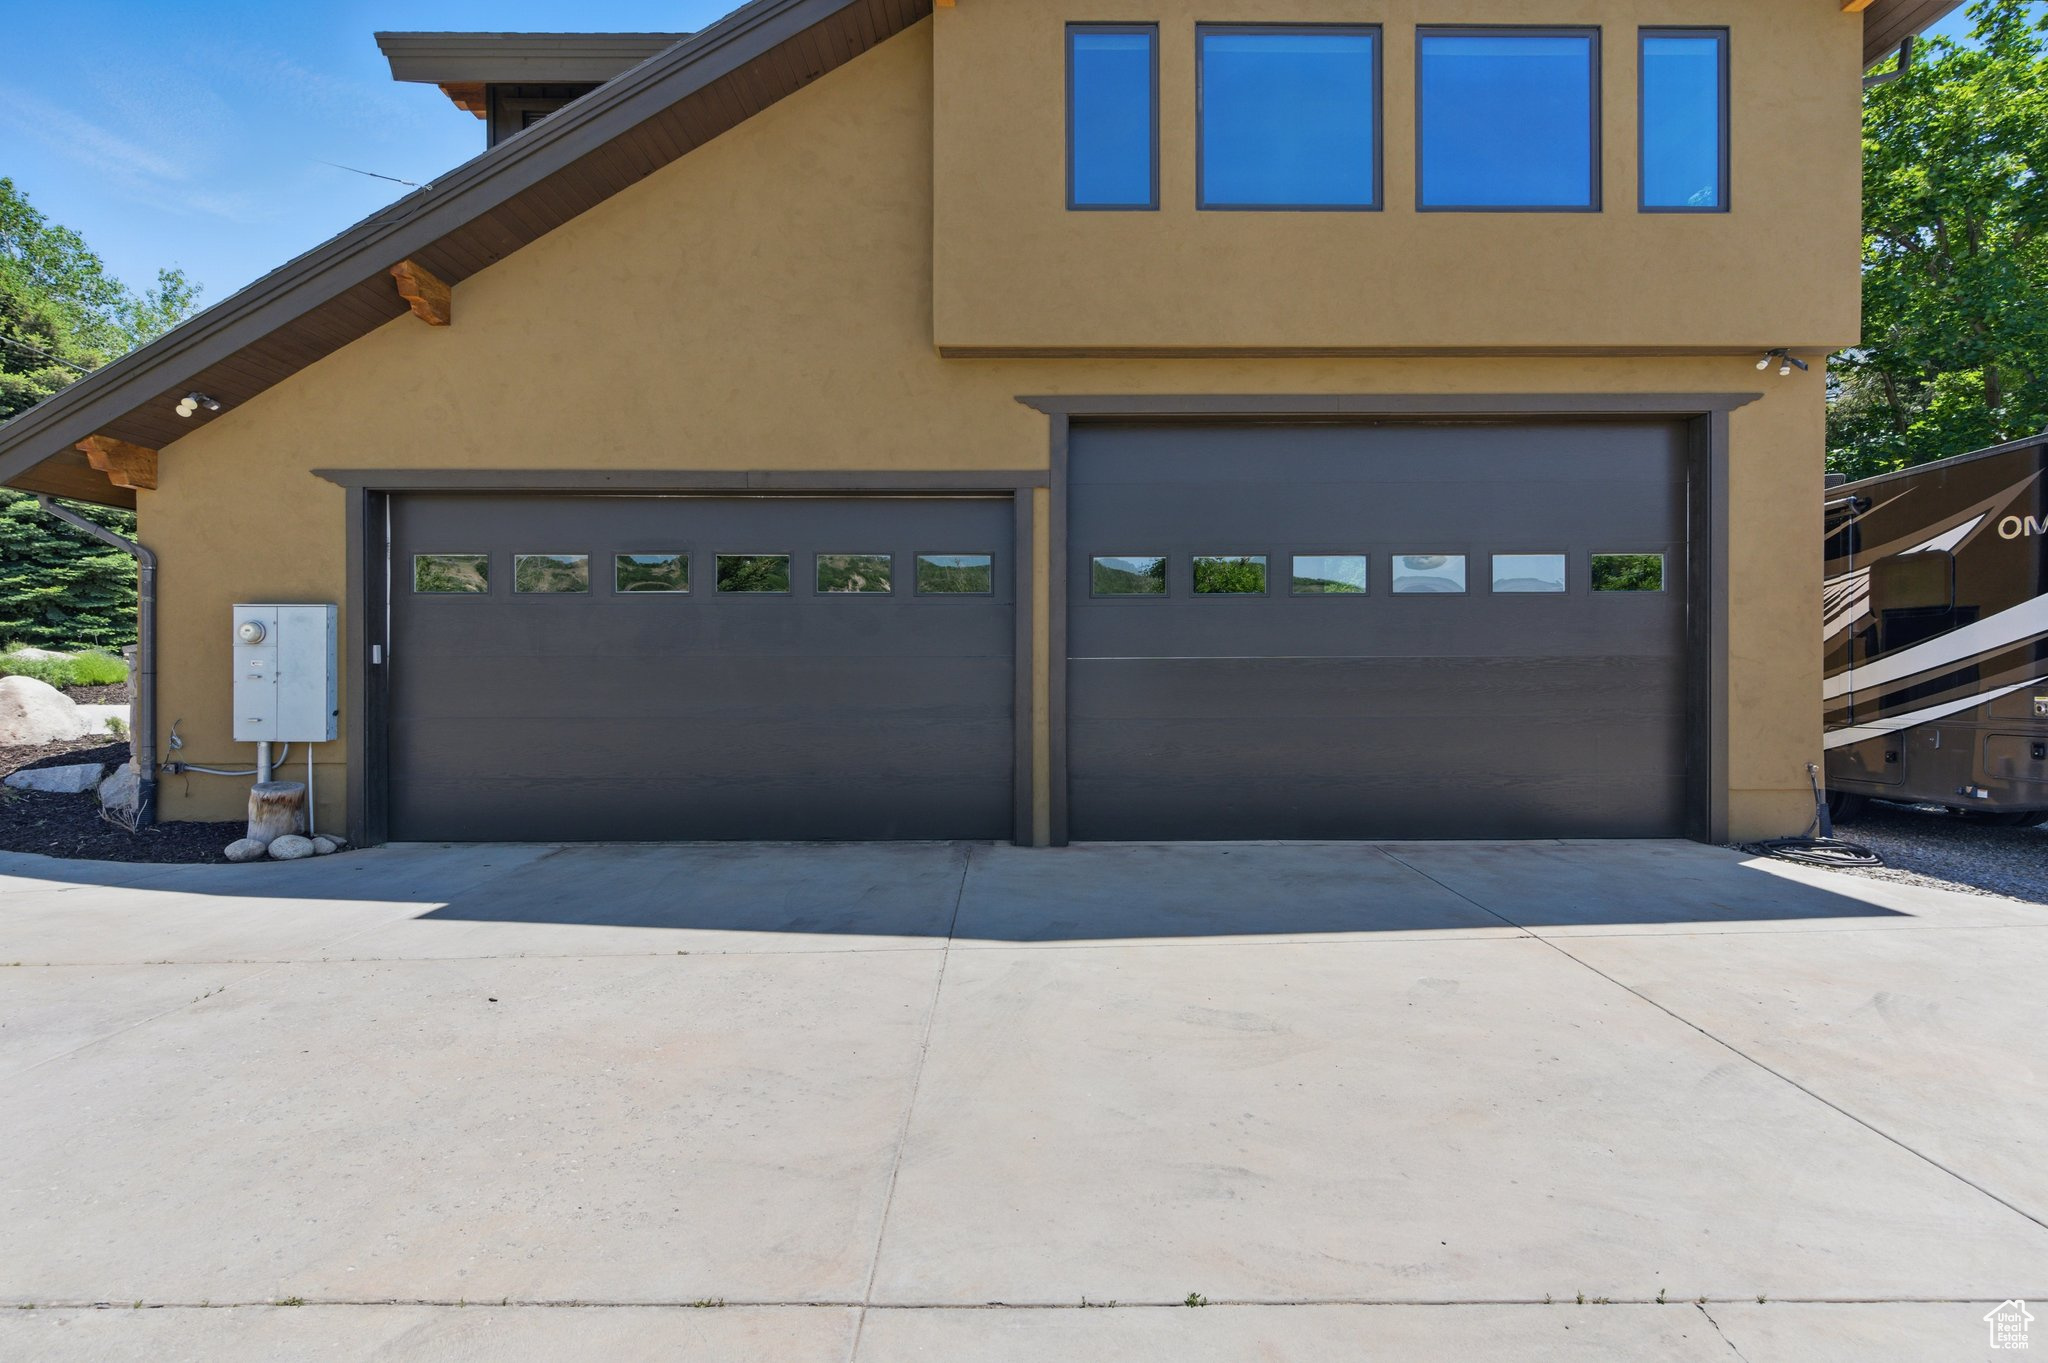
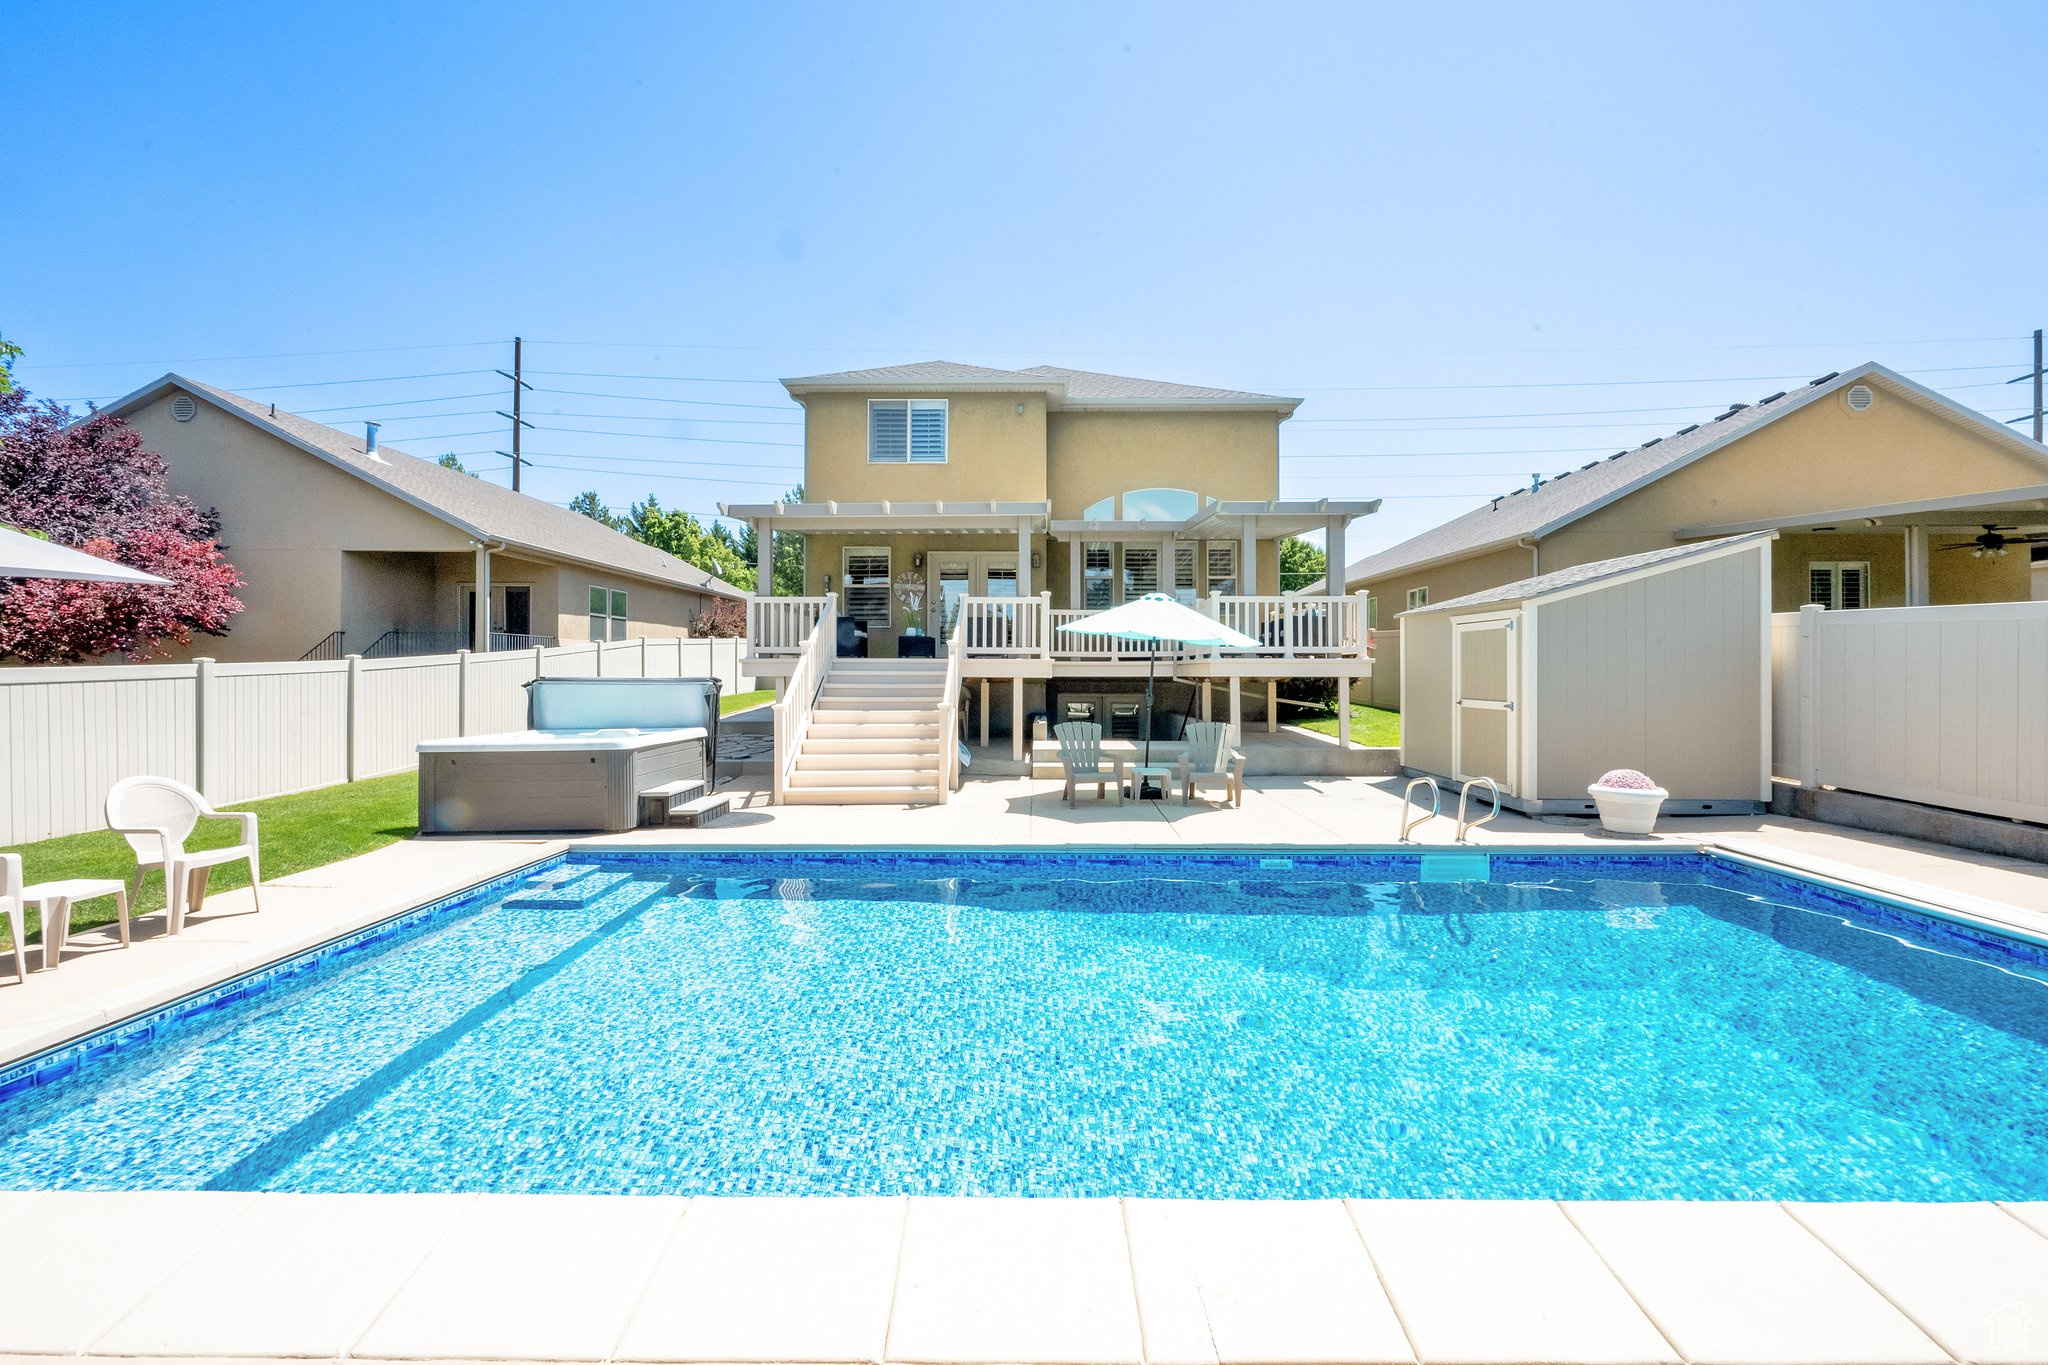
Active
$560,000
4
bds
|
2
ba
|
2,000
sqft
|
built
1959
595 E Wyandotte Ave, Sandy, UT 84070
$-1,657
Cash flow
-15.4%
Cash-on-Cash Return
2.1%
Cap rate
0.3%
Rent to Value Ratio
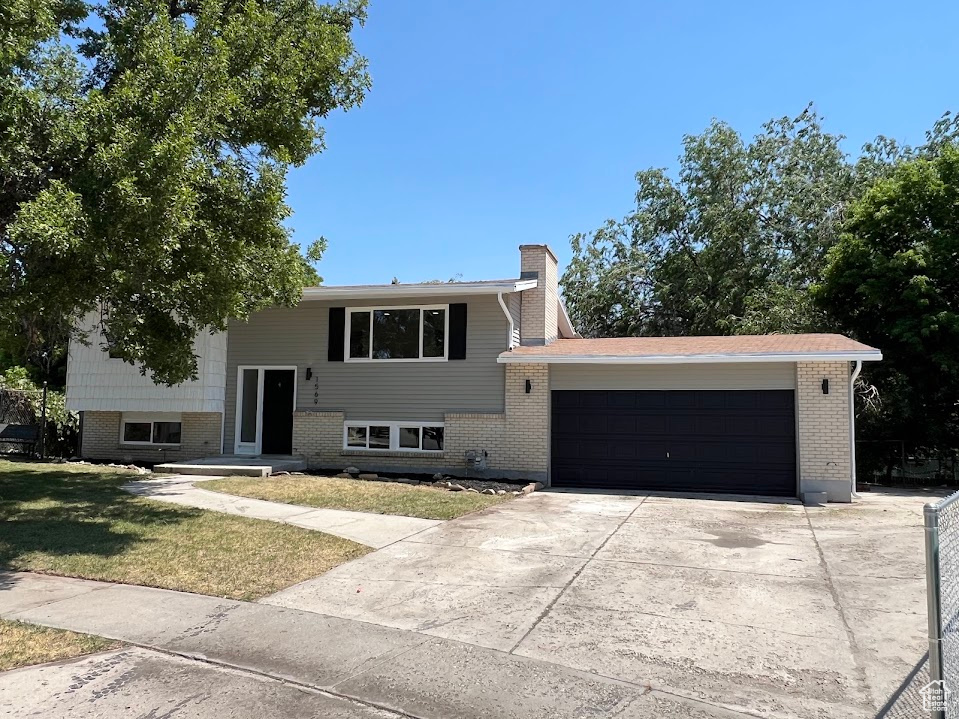
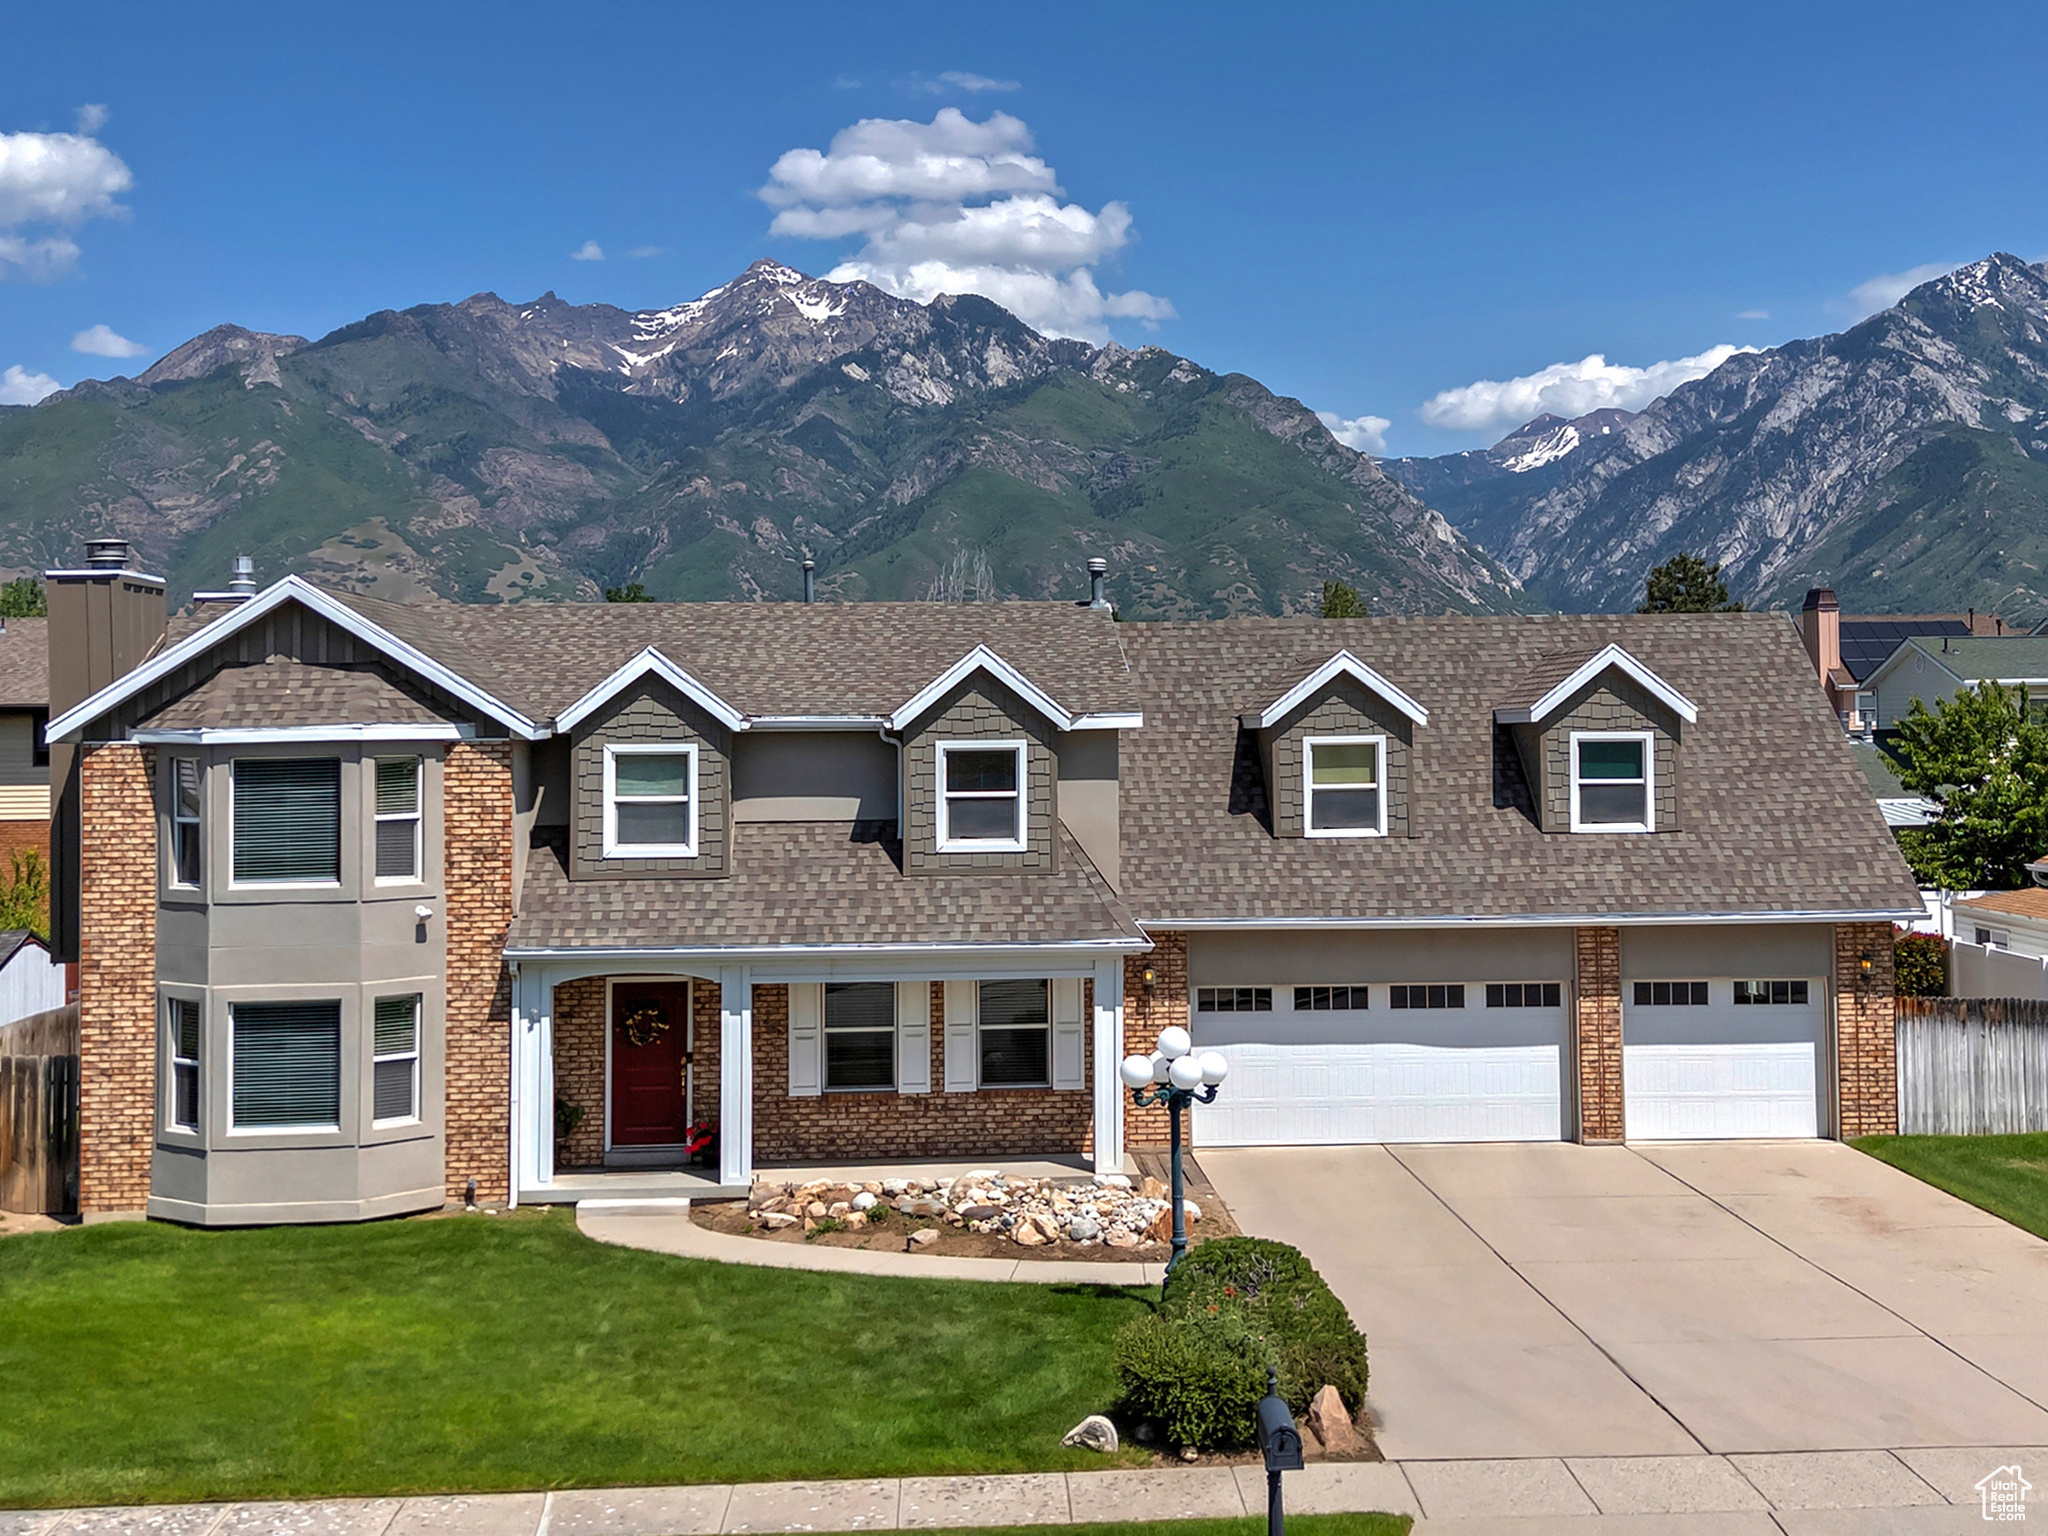
Active
$615,000
4
bds
|
2
ba
|
1,908
sqft
|
built
1973
1569 E Boysenberry Cir, Sandy, UT 84093
$-1,737
Cash flow
-14.7%
Cash-on-Cash Return
2.3%
Cap rate
0.3%
Rent to Value Ratio
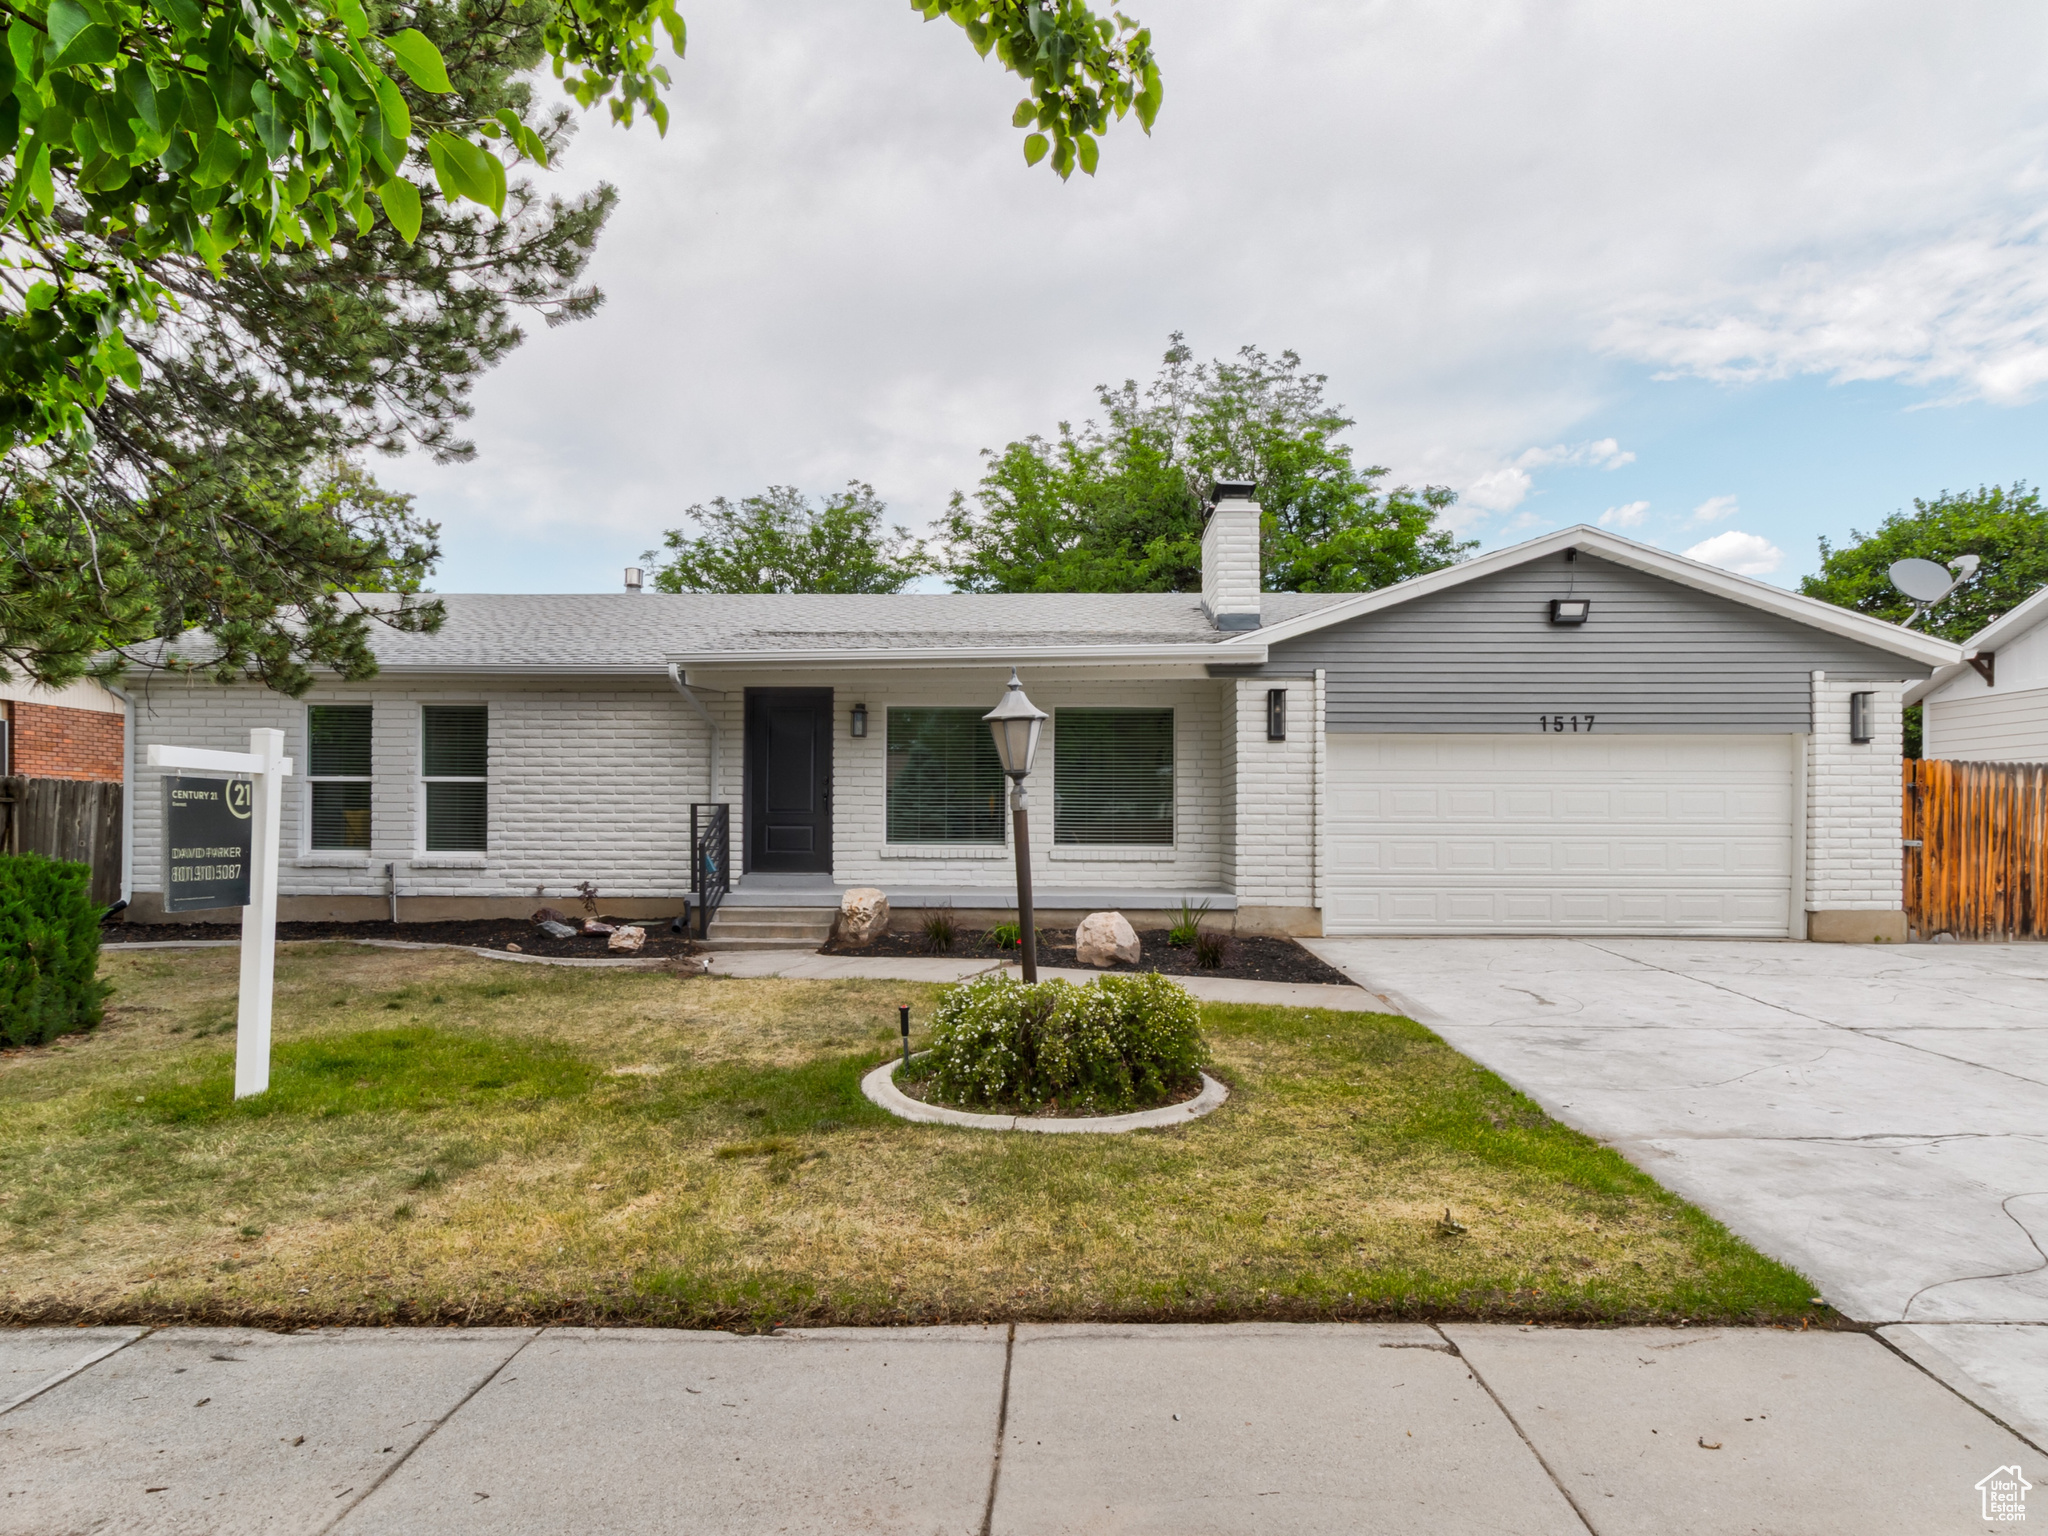
Pending
$675,000
6
bds
|
3
ba
|
2,080
sqft
|
built
1975
1517 E Plata Way, Sandy, UT 84093
$-2,166
Cash flow
-16.7%
Cash-on-Cash Return
1.8%
Cap rate
0.3%
Rent to Value Ratio
Active
$614,000
4
bds
|
3
ba
|
2,154
sqft
|
built
1972
8359 S Fayeway Dr, Sandy, UT 84094
$-1,618
Cash flow
-13.7%
Cash-on-Cash Return
2.5%
Cap rate
0.4%
Rent to Value Ratio
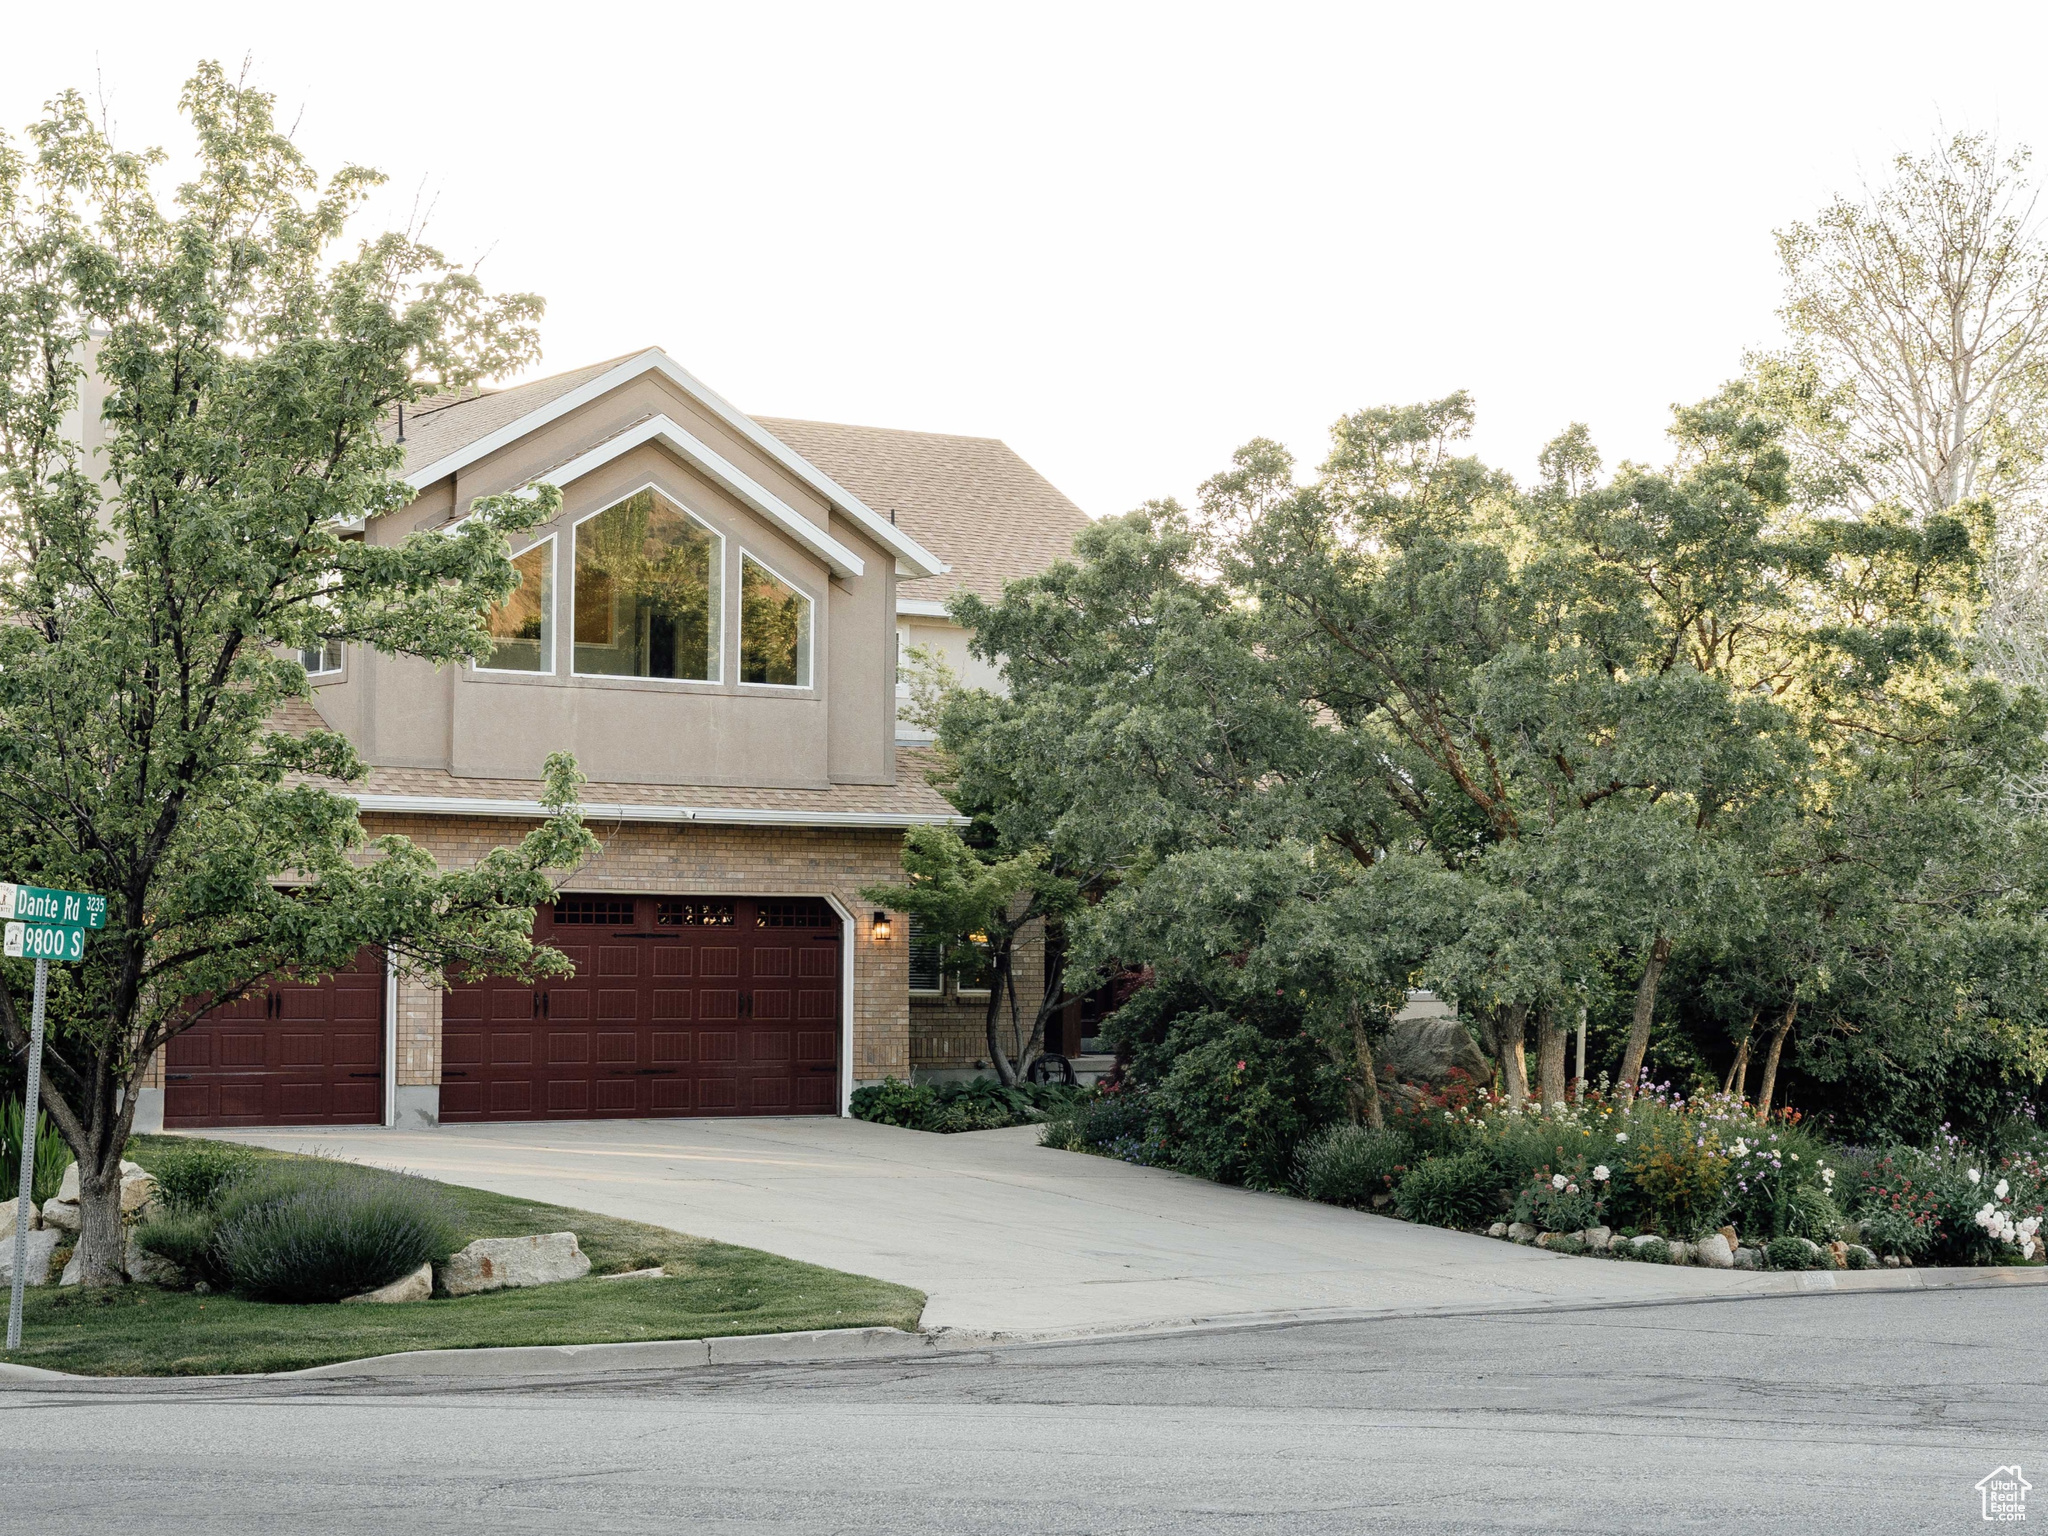
Active
$1,350,000
6
bds
|
4
ba
|
4,925
sqft
|
built
1993
9788 S Dante Rd, Sandy, UT 84092
$-3,771
Cash flow
-14.6%
Cash-on-Cash Return
2.3%
Cap rate
0.3%
Rent to Value Ratio
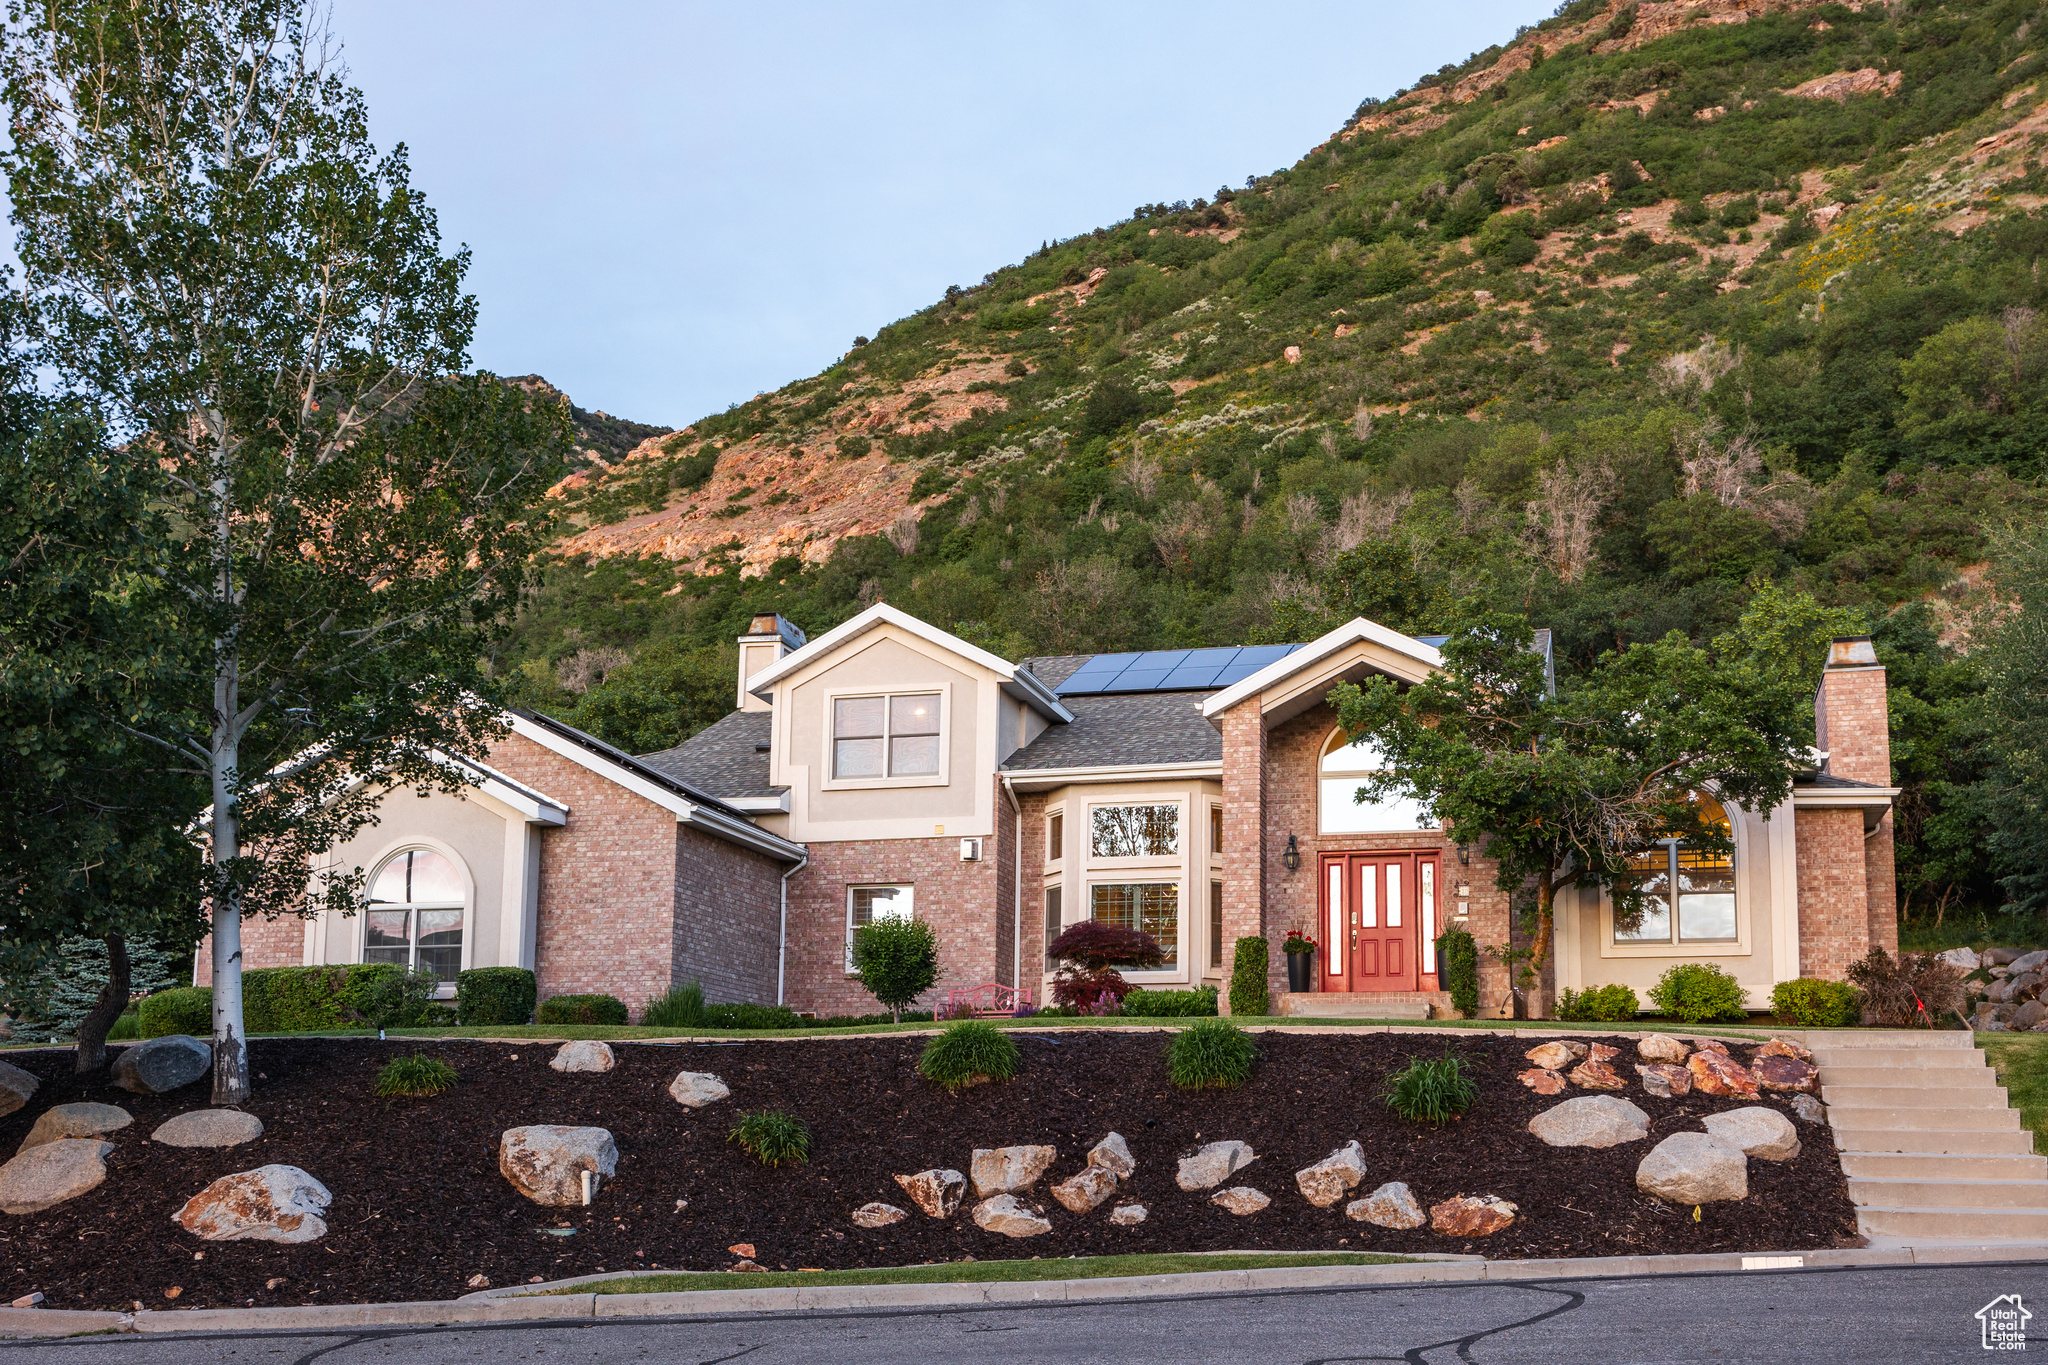
Active
$775,000
4
bds
|
3
ba
|
3,039
sqft
|
built
1979
10365 S 2505 E, Sandy, UT 84092
$-1,914
Cash flow
-12.9%
Cash-on-Cash Return
2.7%
Cap rate
0.4%
Rent to Value Ratio
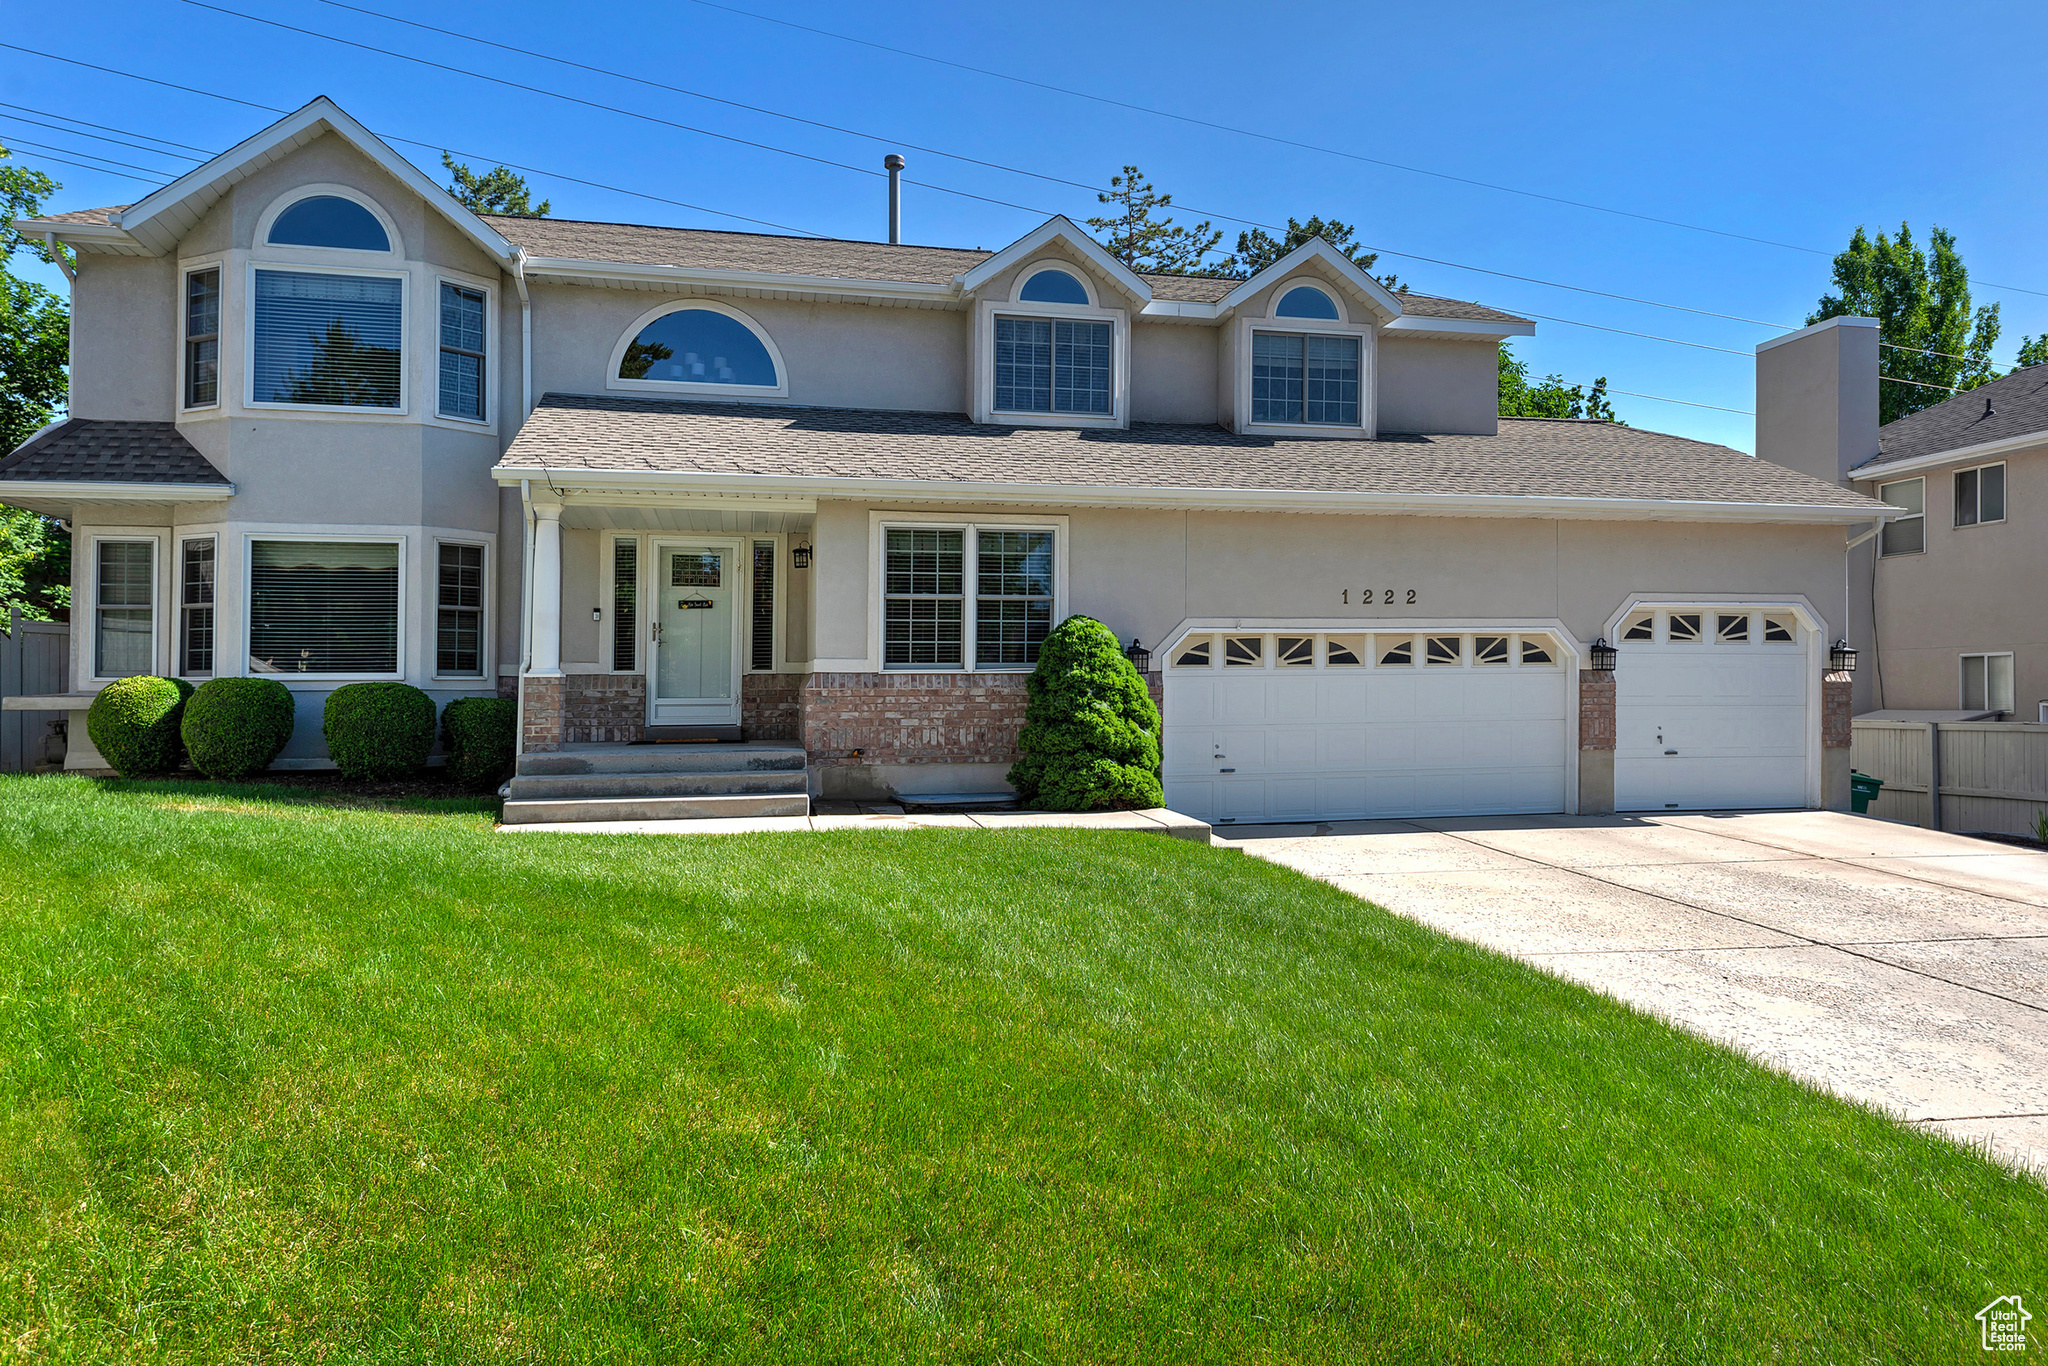
Active
$895,000
4
bds
|
3
ba
|
4,004
sqft
|
built
1993
1222 E Big Pine Cir, Sandy, UT 84094
$-2,400
Cash flow
-14.0%
Cash-on-Cash Return
2.5%
Cap rate
0.3%
Rent to Value Ratio
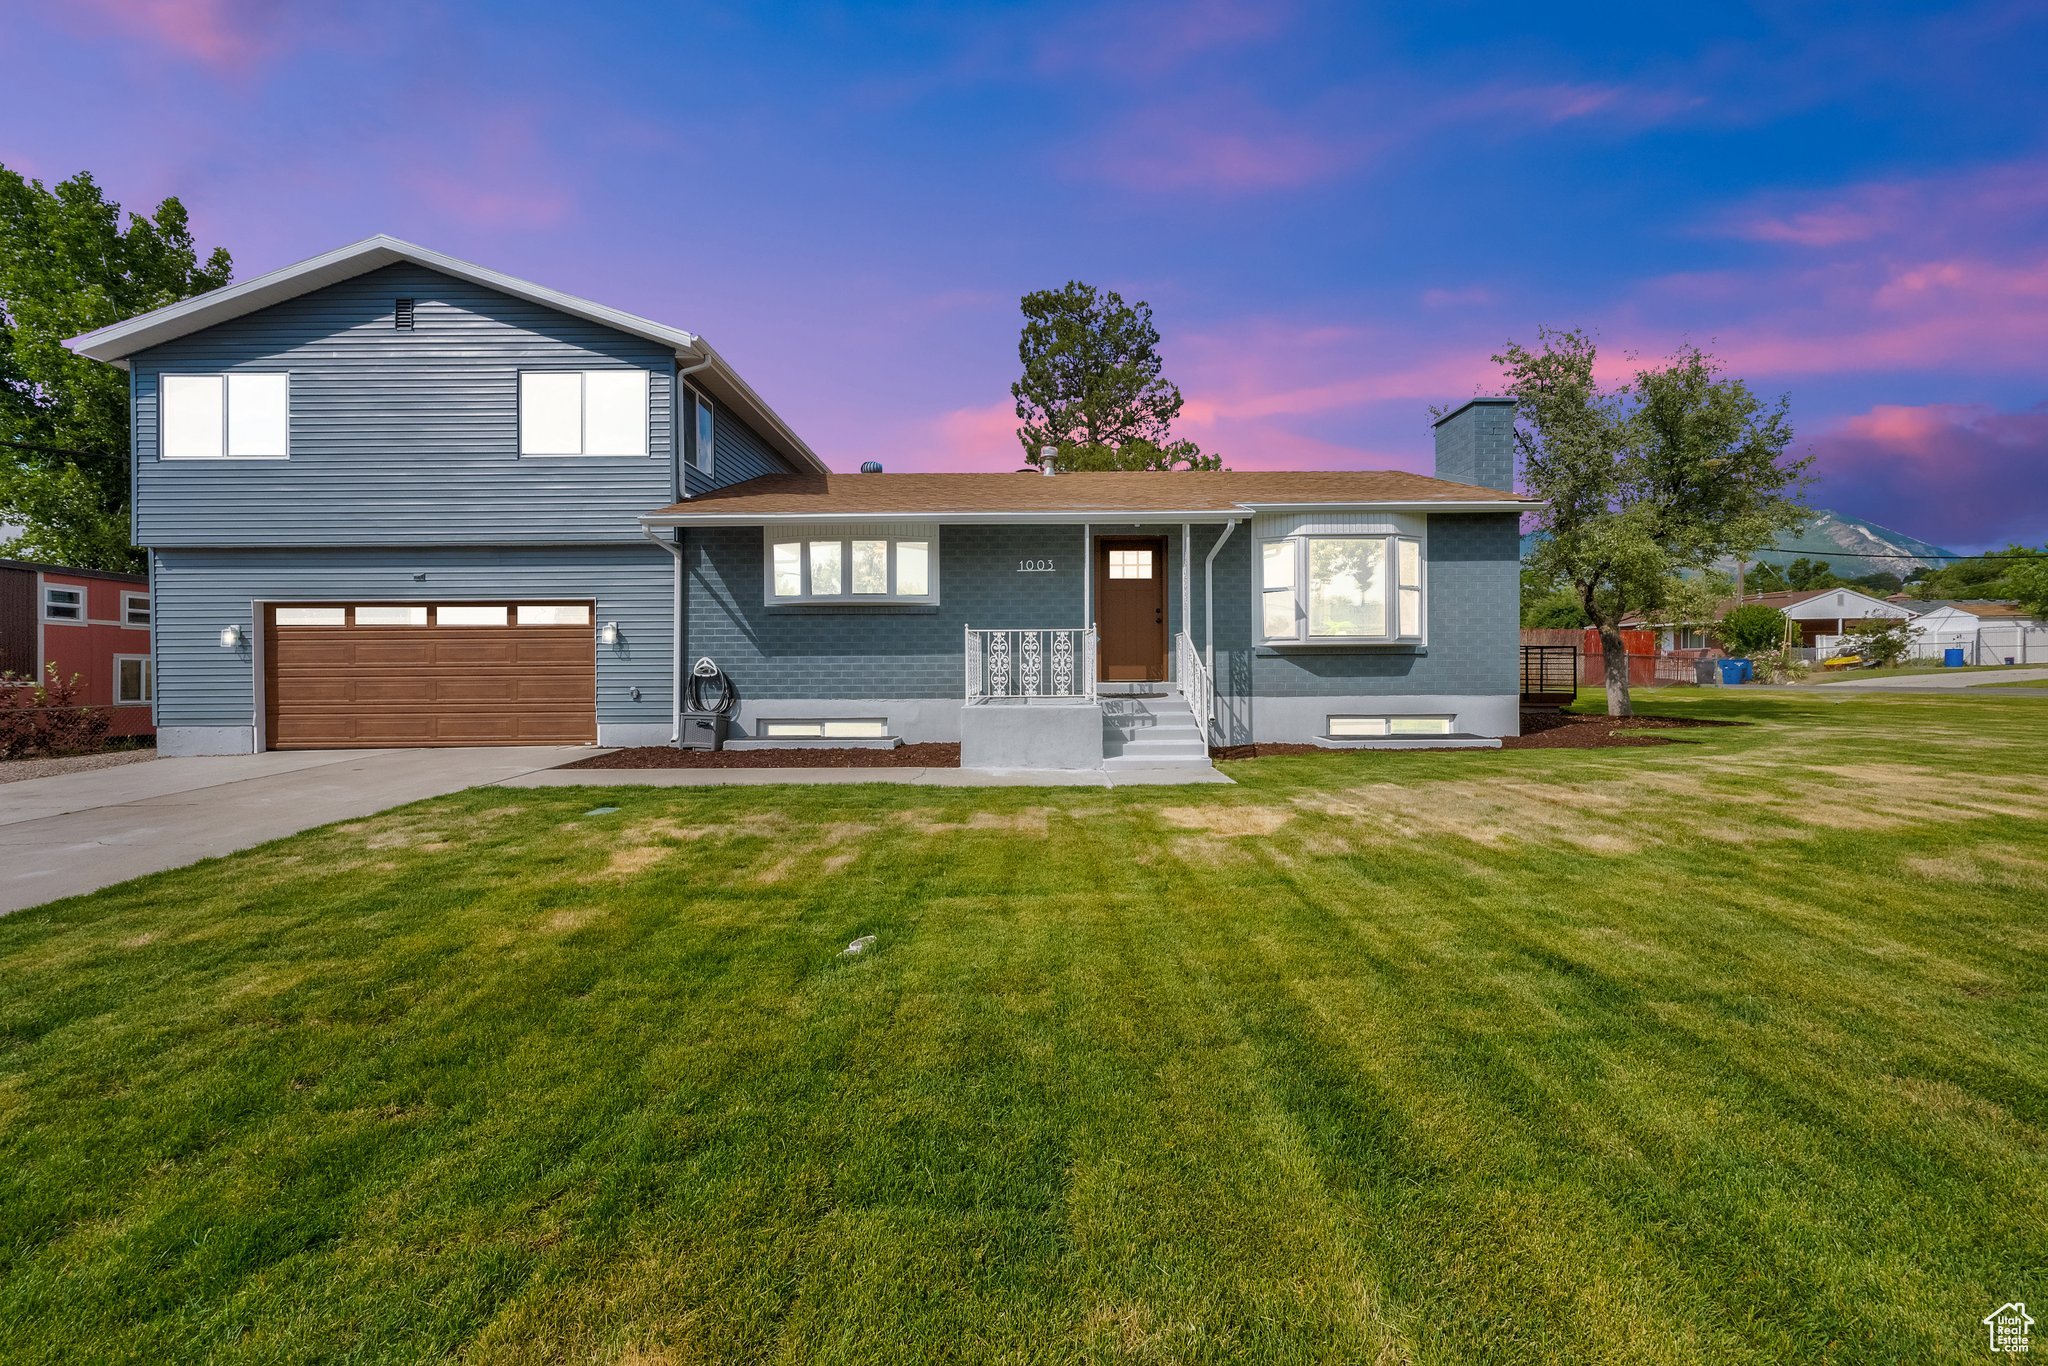
Active
$685,000
5
bds
|
3
ba
|
2,863
sqft
|
built
1959
1003 E Platinum Way, Sandy, UT 84094
$-1,773
Cash flow
-13.5%
Cash-on-Cash Return
2.6%
Cap rate
0.4%
Rent to Value Ratio
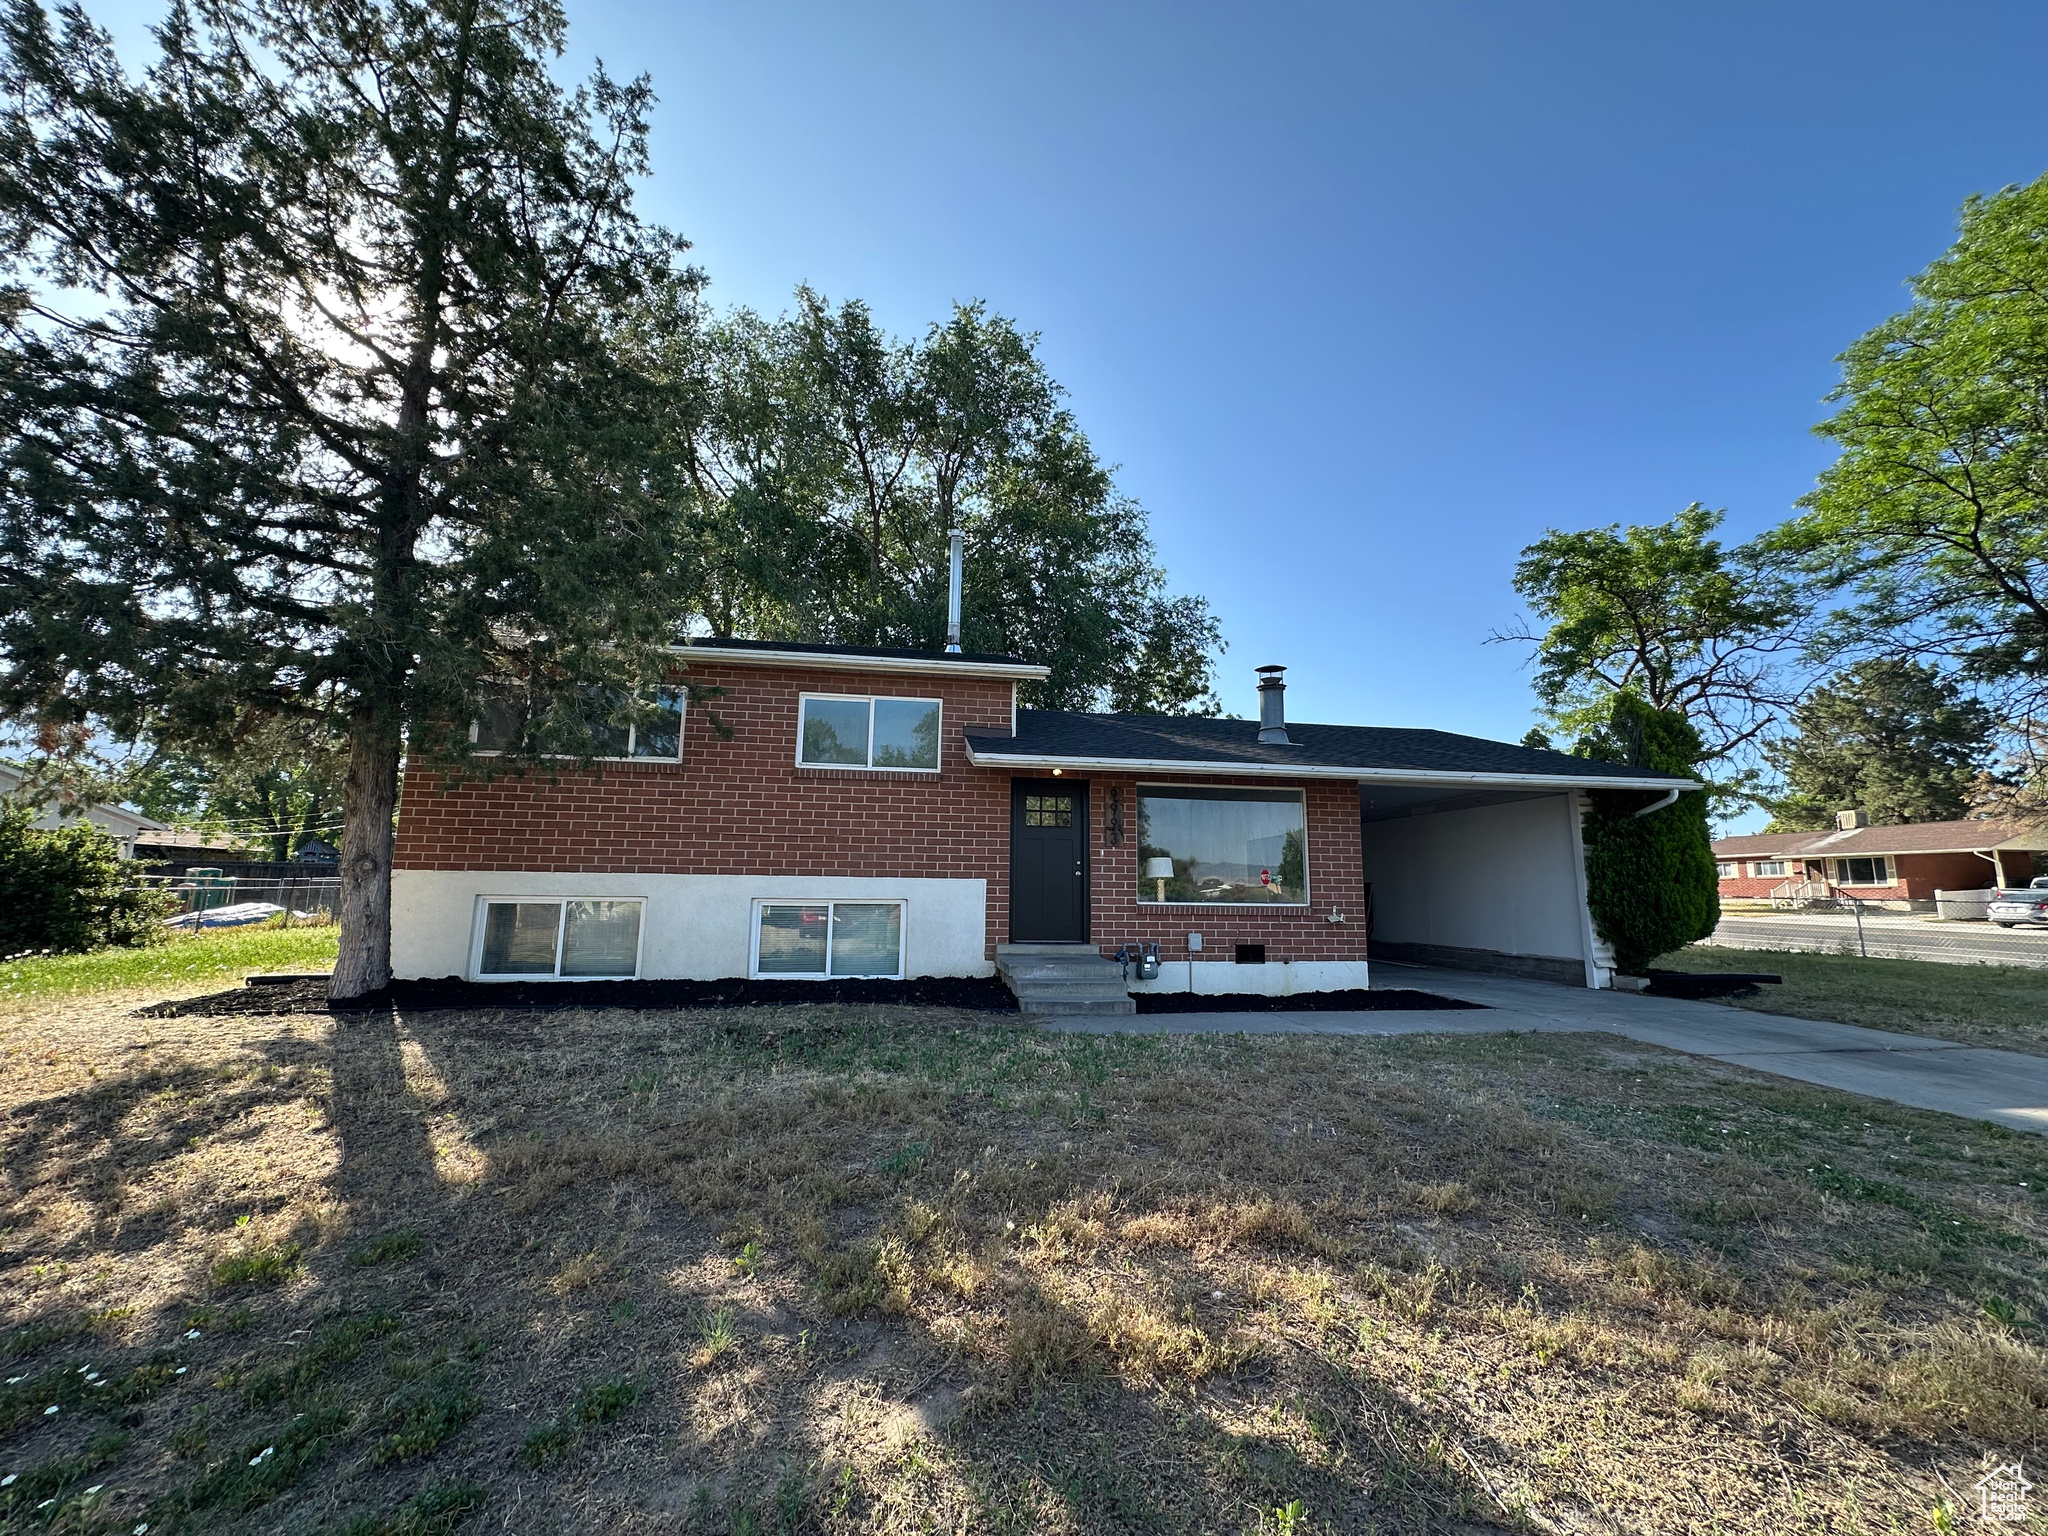
Active
$524,900
4
bds
|
2
ba
|
1,674
sqft
|
built
1959
9993 S Barium Ln, Sandy, UT 84094
$-1,413
Cash flow
-14.0%
Cash-on-Cash Return
2.4%
Cap rate
0.3%
Rent to Value Ratio
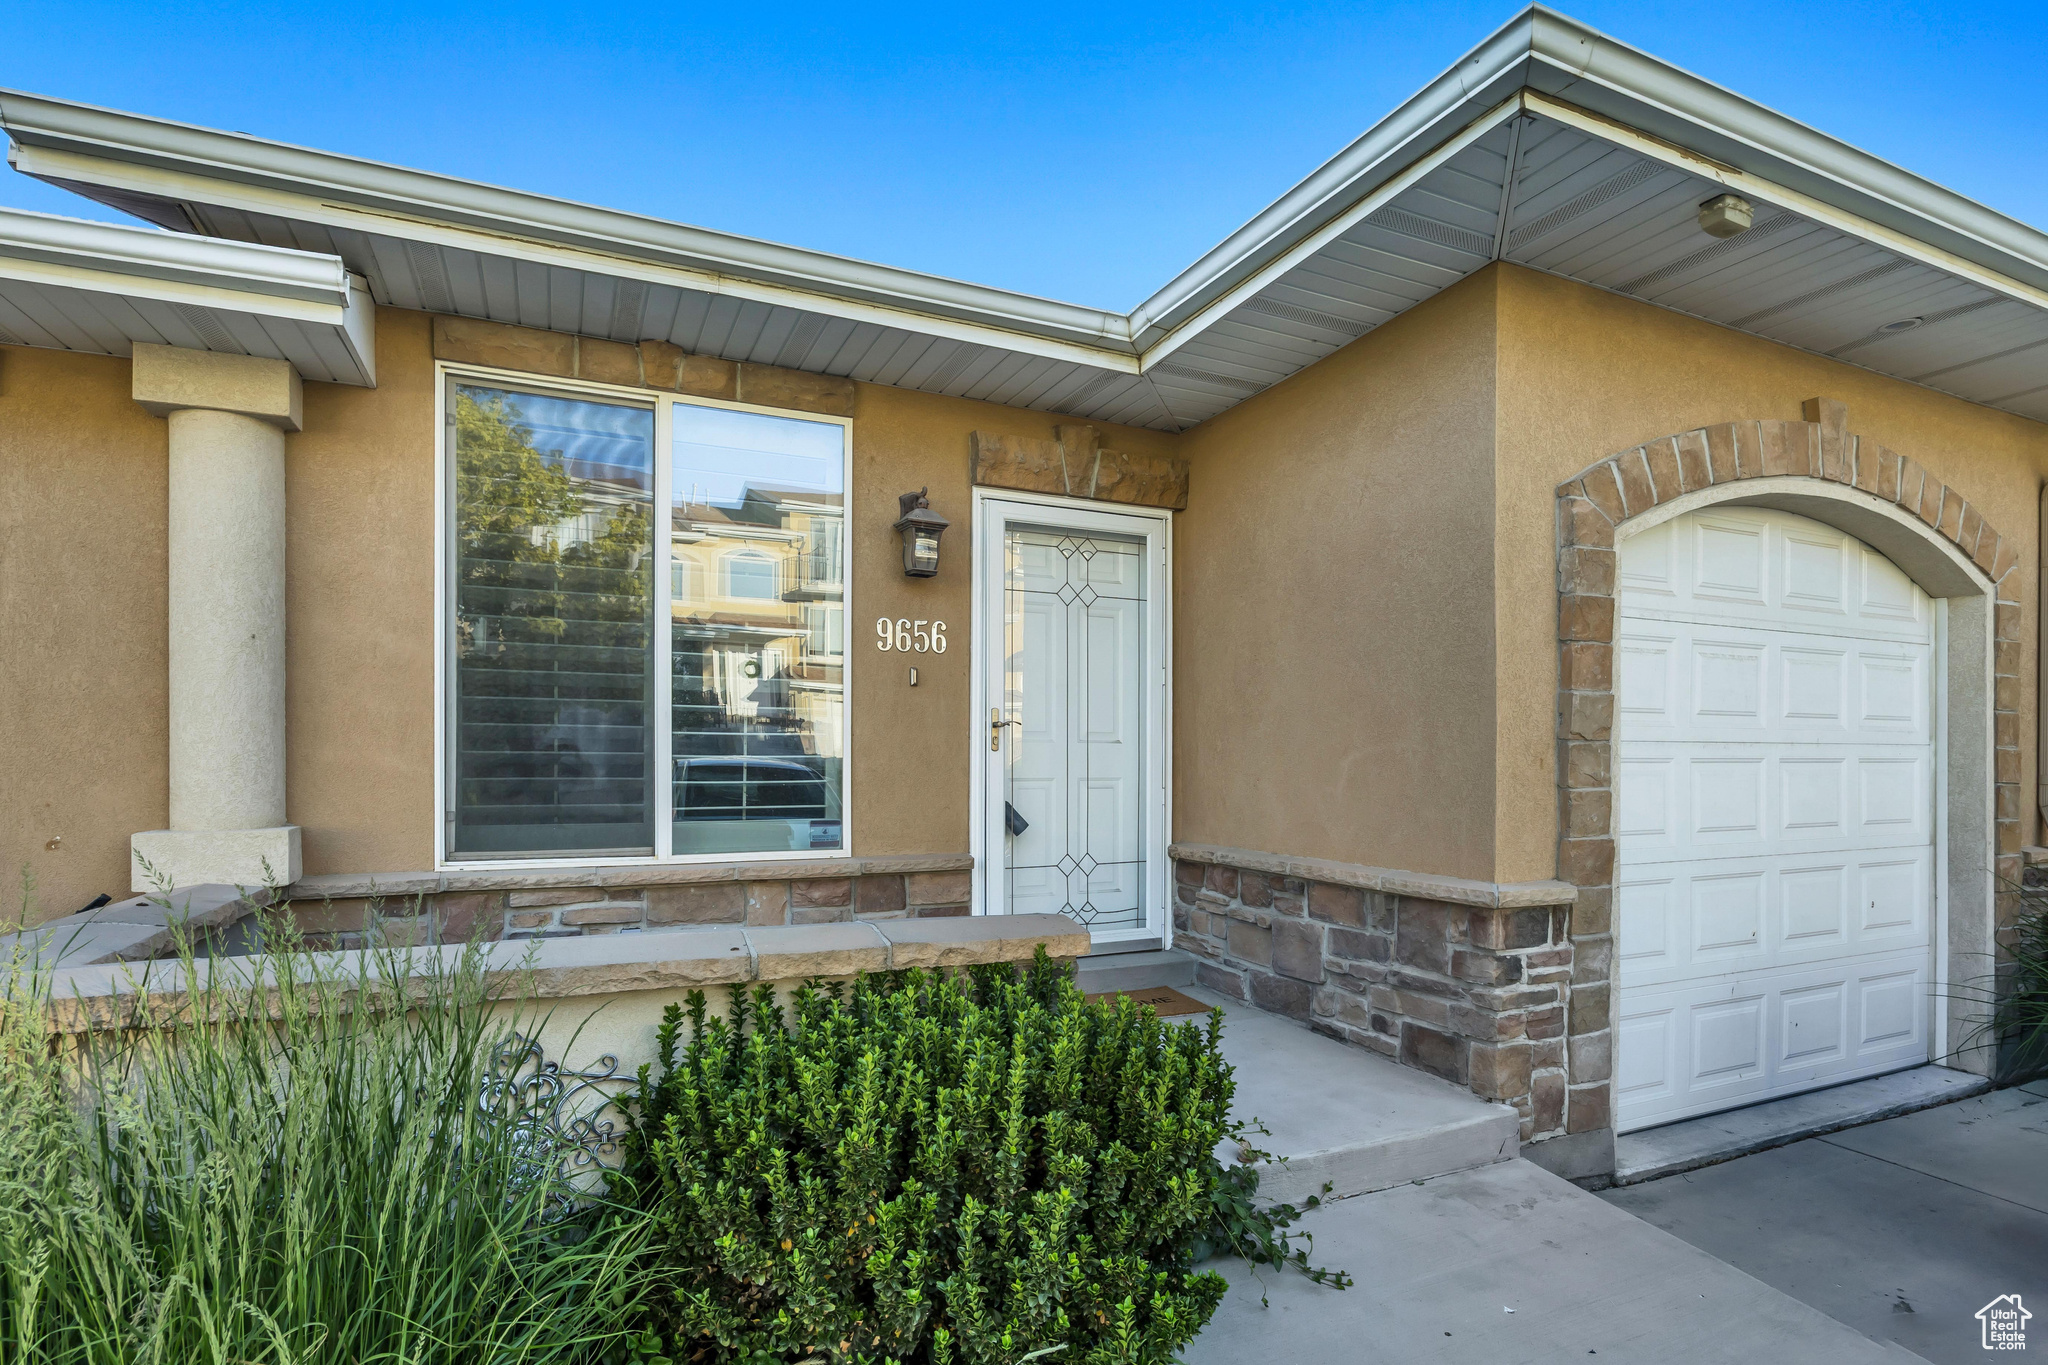
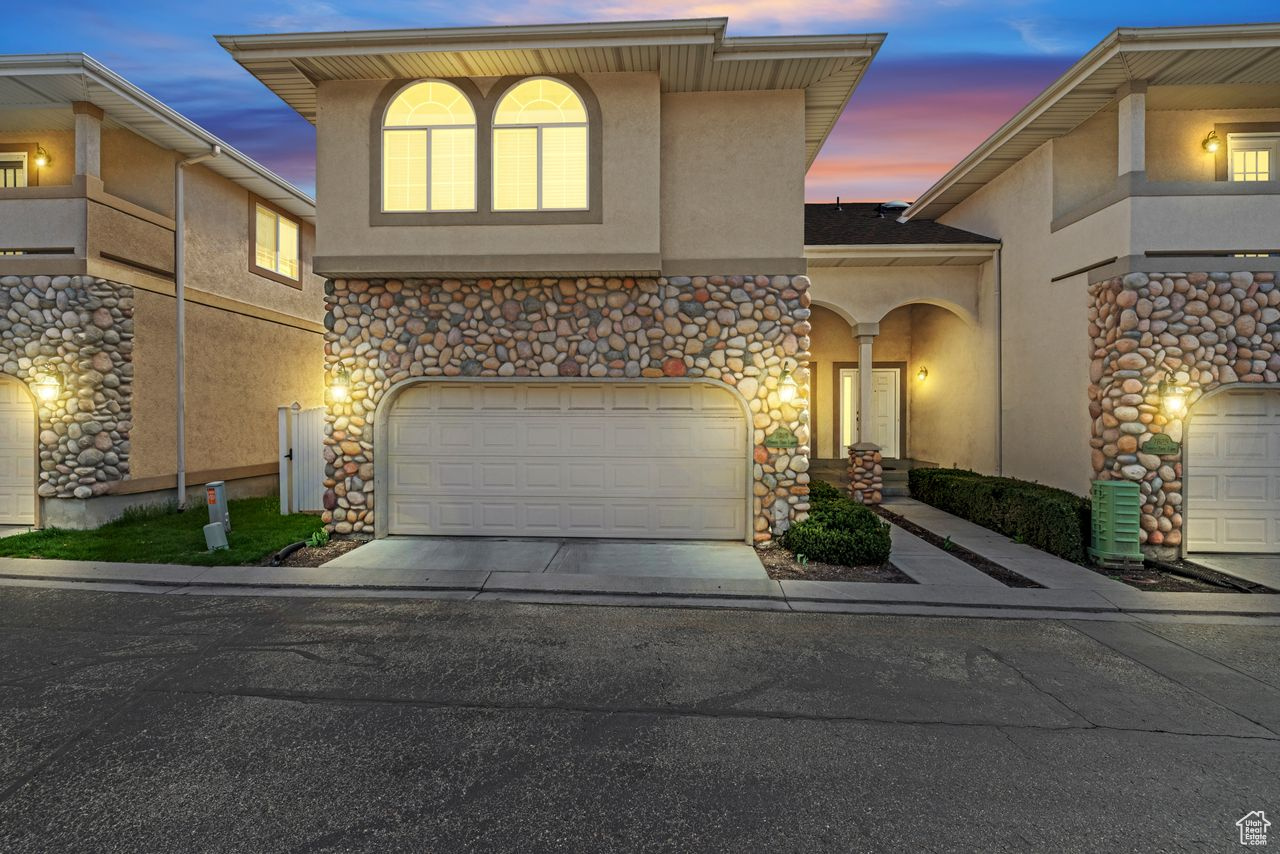
Active
$439,900
3
bds
|
3
ba
|
1,704
sqft
|
built
2003
9656 S Villa Springs Cv, Sandy, UT 84070
$-1,580
Cash flow
-18.7%
Cash-on-Cash Return
1.4%
Cap rate
0.3%
Rent to Value Ratio
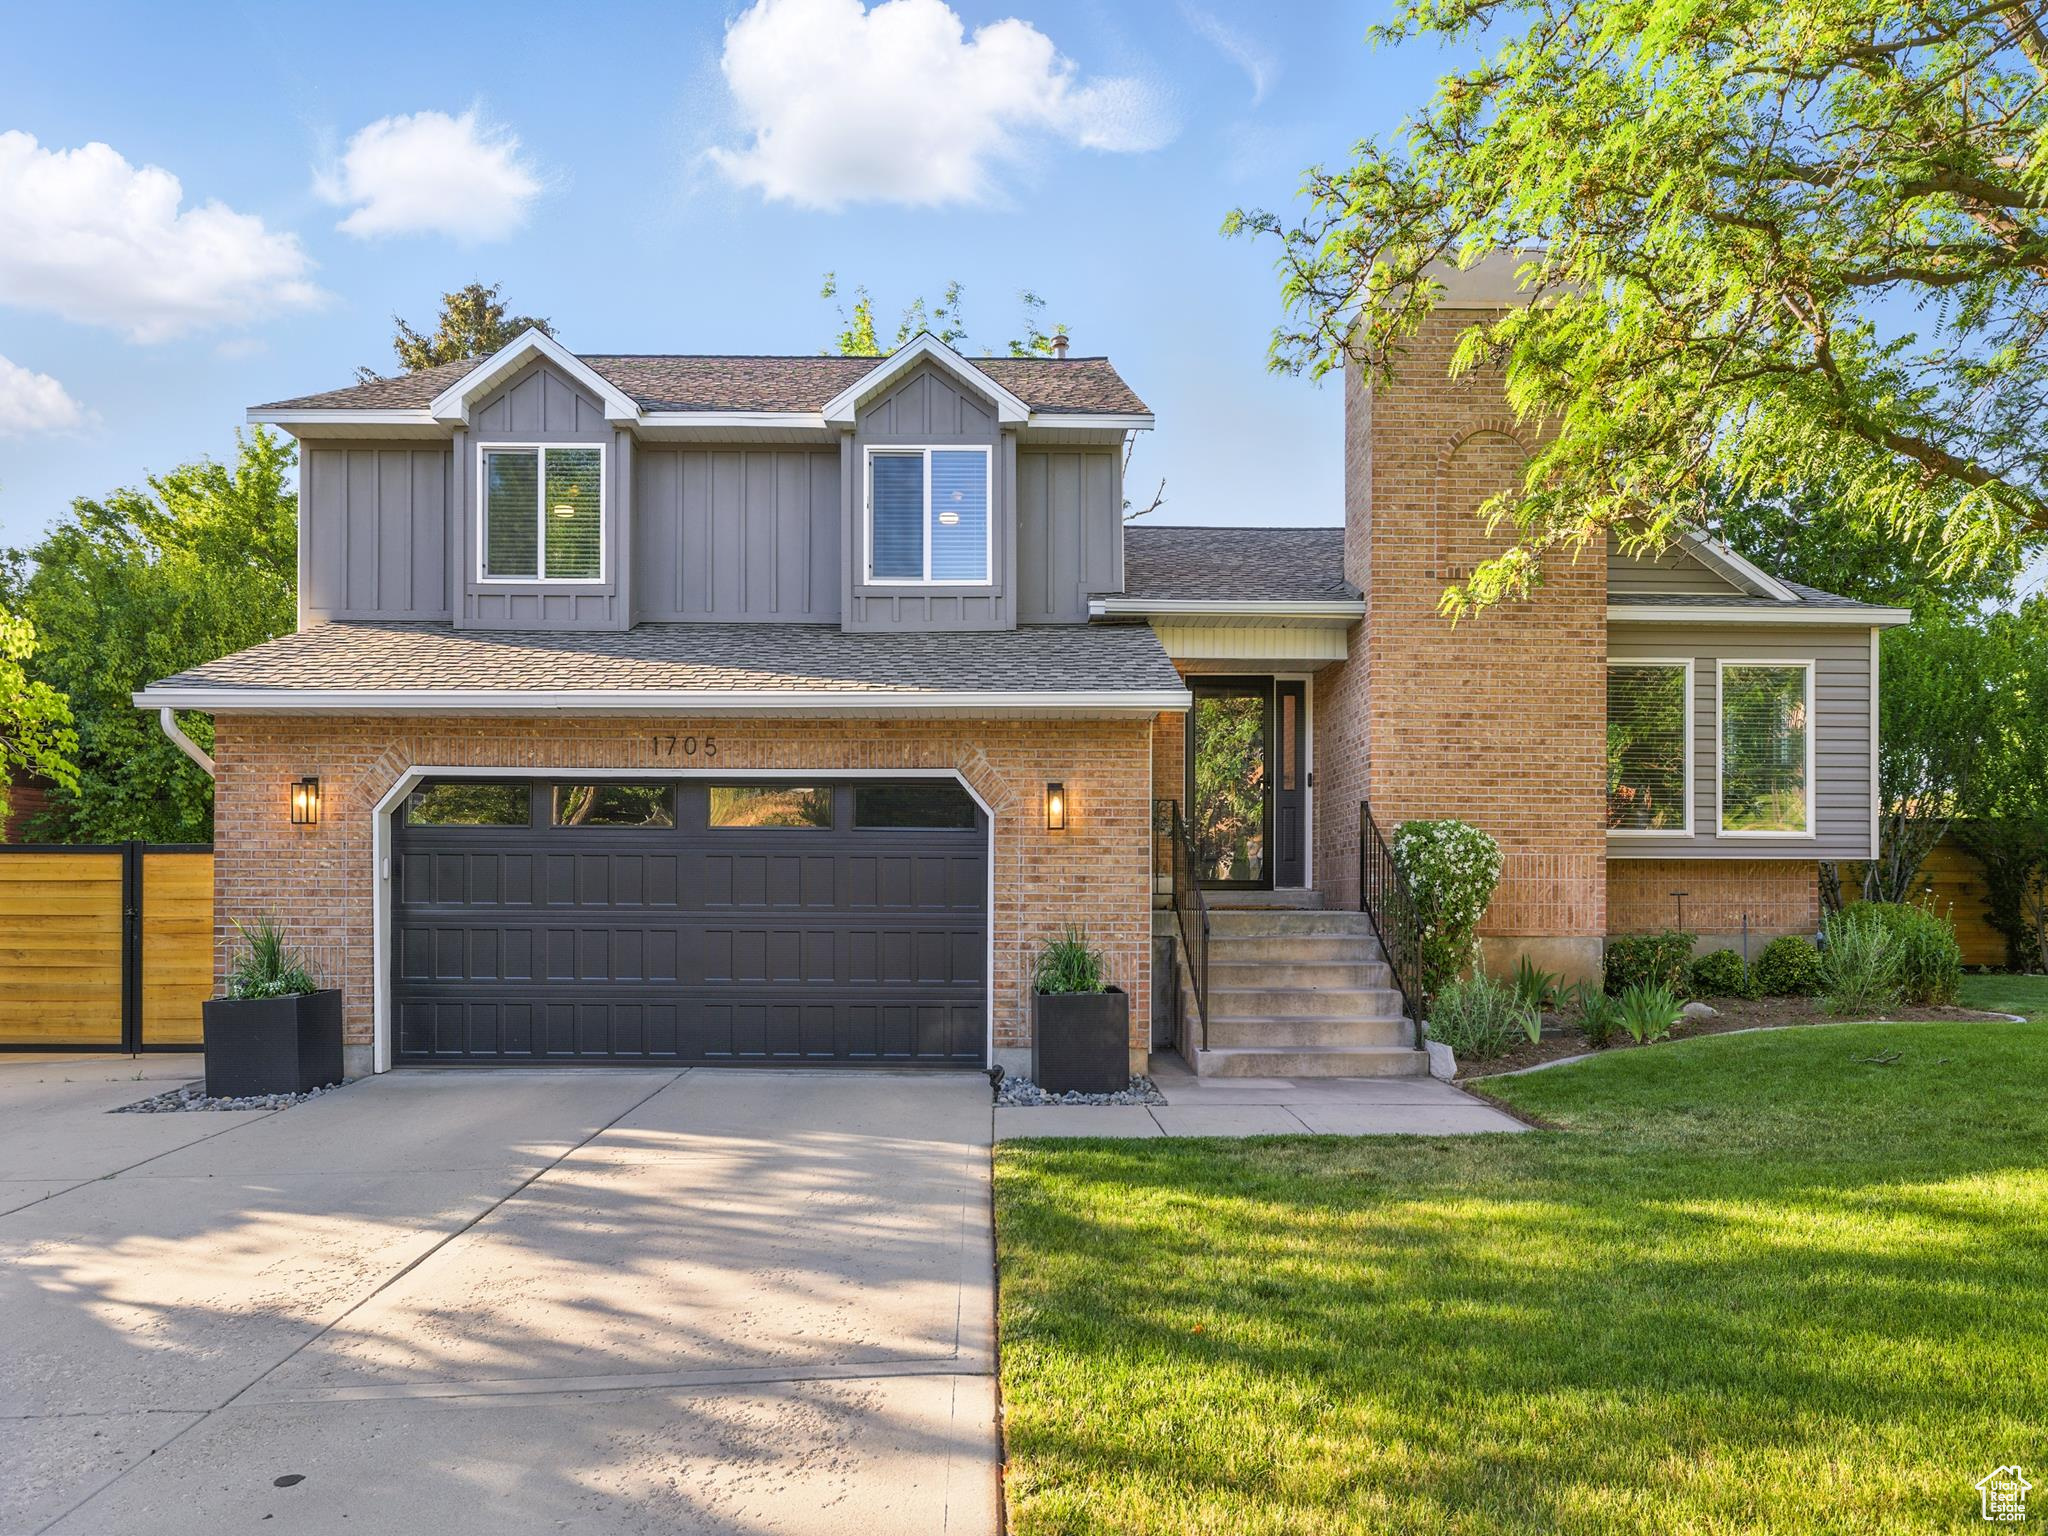
Active
$725,000
3
bds
|
3
ba
|
2,568
sqft
|
built
1988
1705 E Plata Way, Sandy, UT 84093
$-1,772
Cash flow
-12.8%
Cash-on-Cash Return
2.7%
Cap rate
0.4%
Rent to Value Ratio
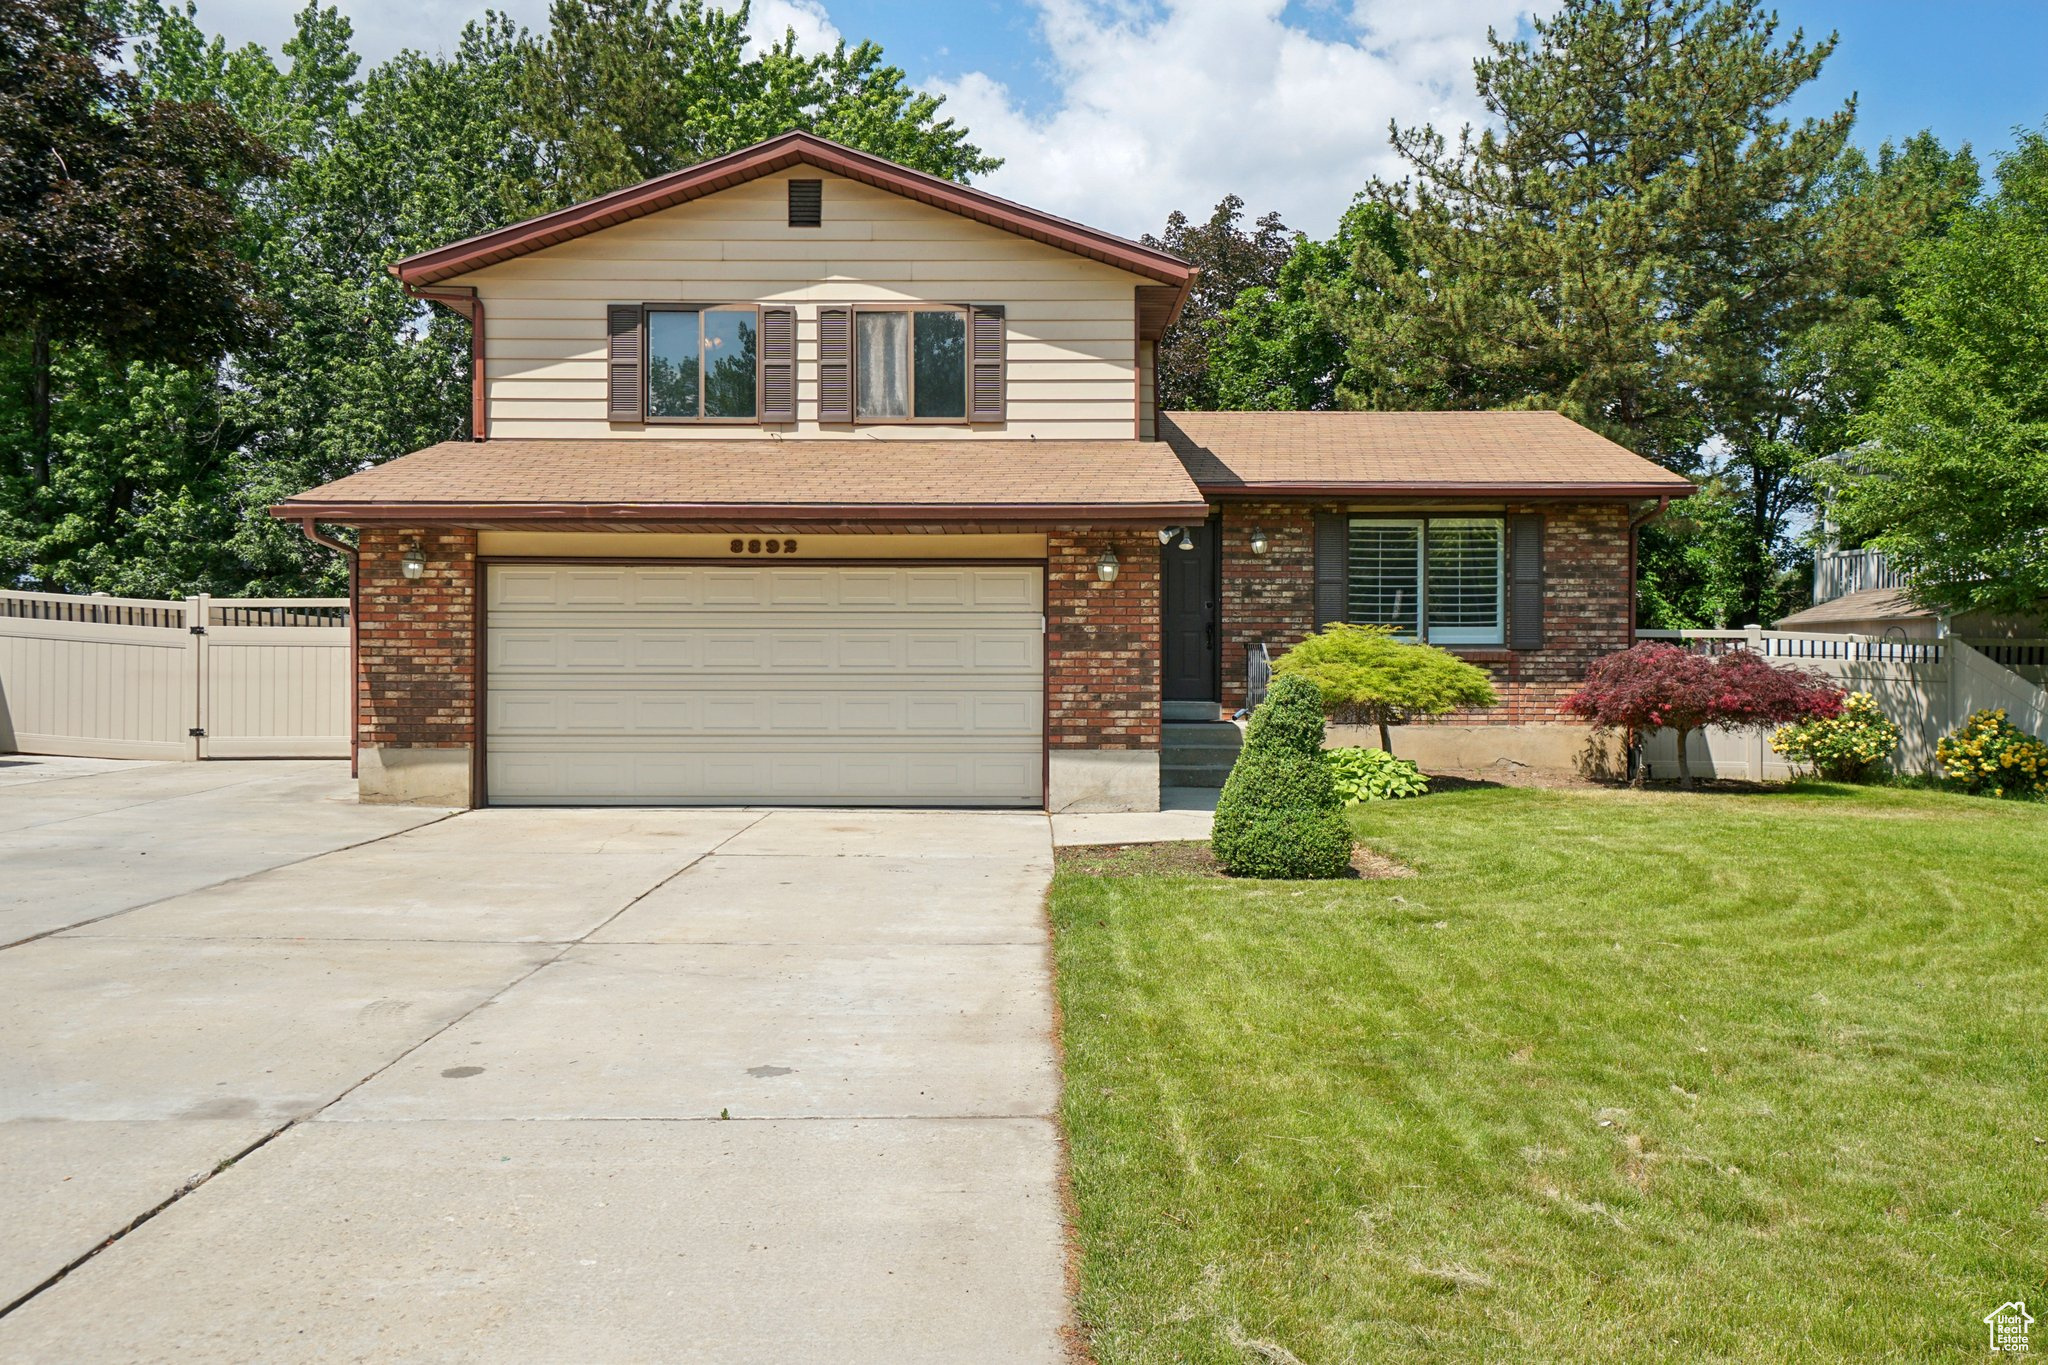
Active
$630,000
4
bds
|
2
ba
|
1,854
sqft
|
built
1983
8892 S Flatiron Dr, Sandy, UT 84093
$-1,285
Cash flow
-10.6%
Cash-on-Cash Return
3.2%
Cap rate
0.4%
Rent to Value Ratio
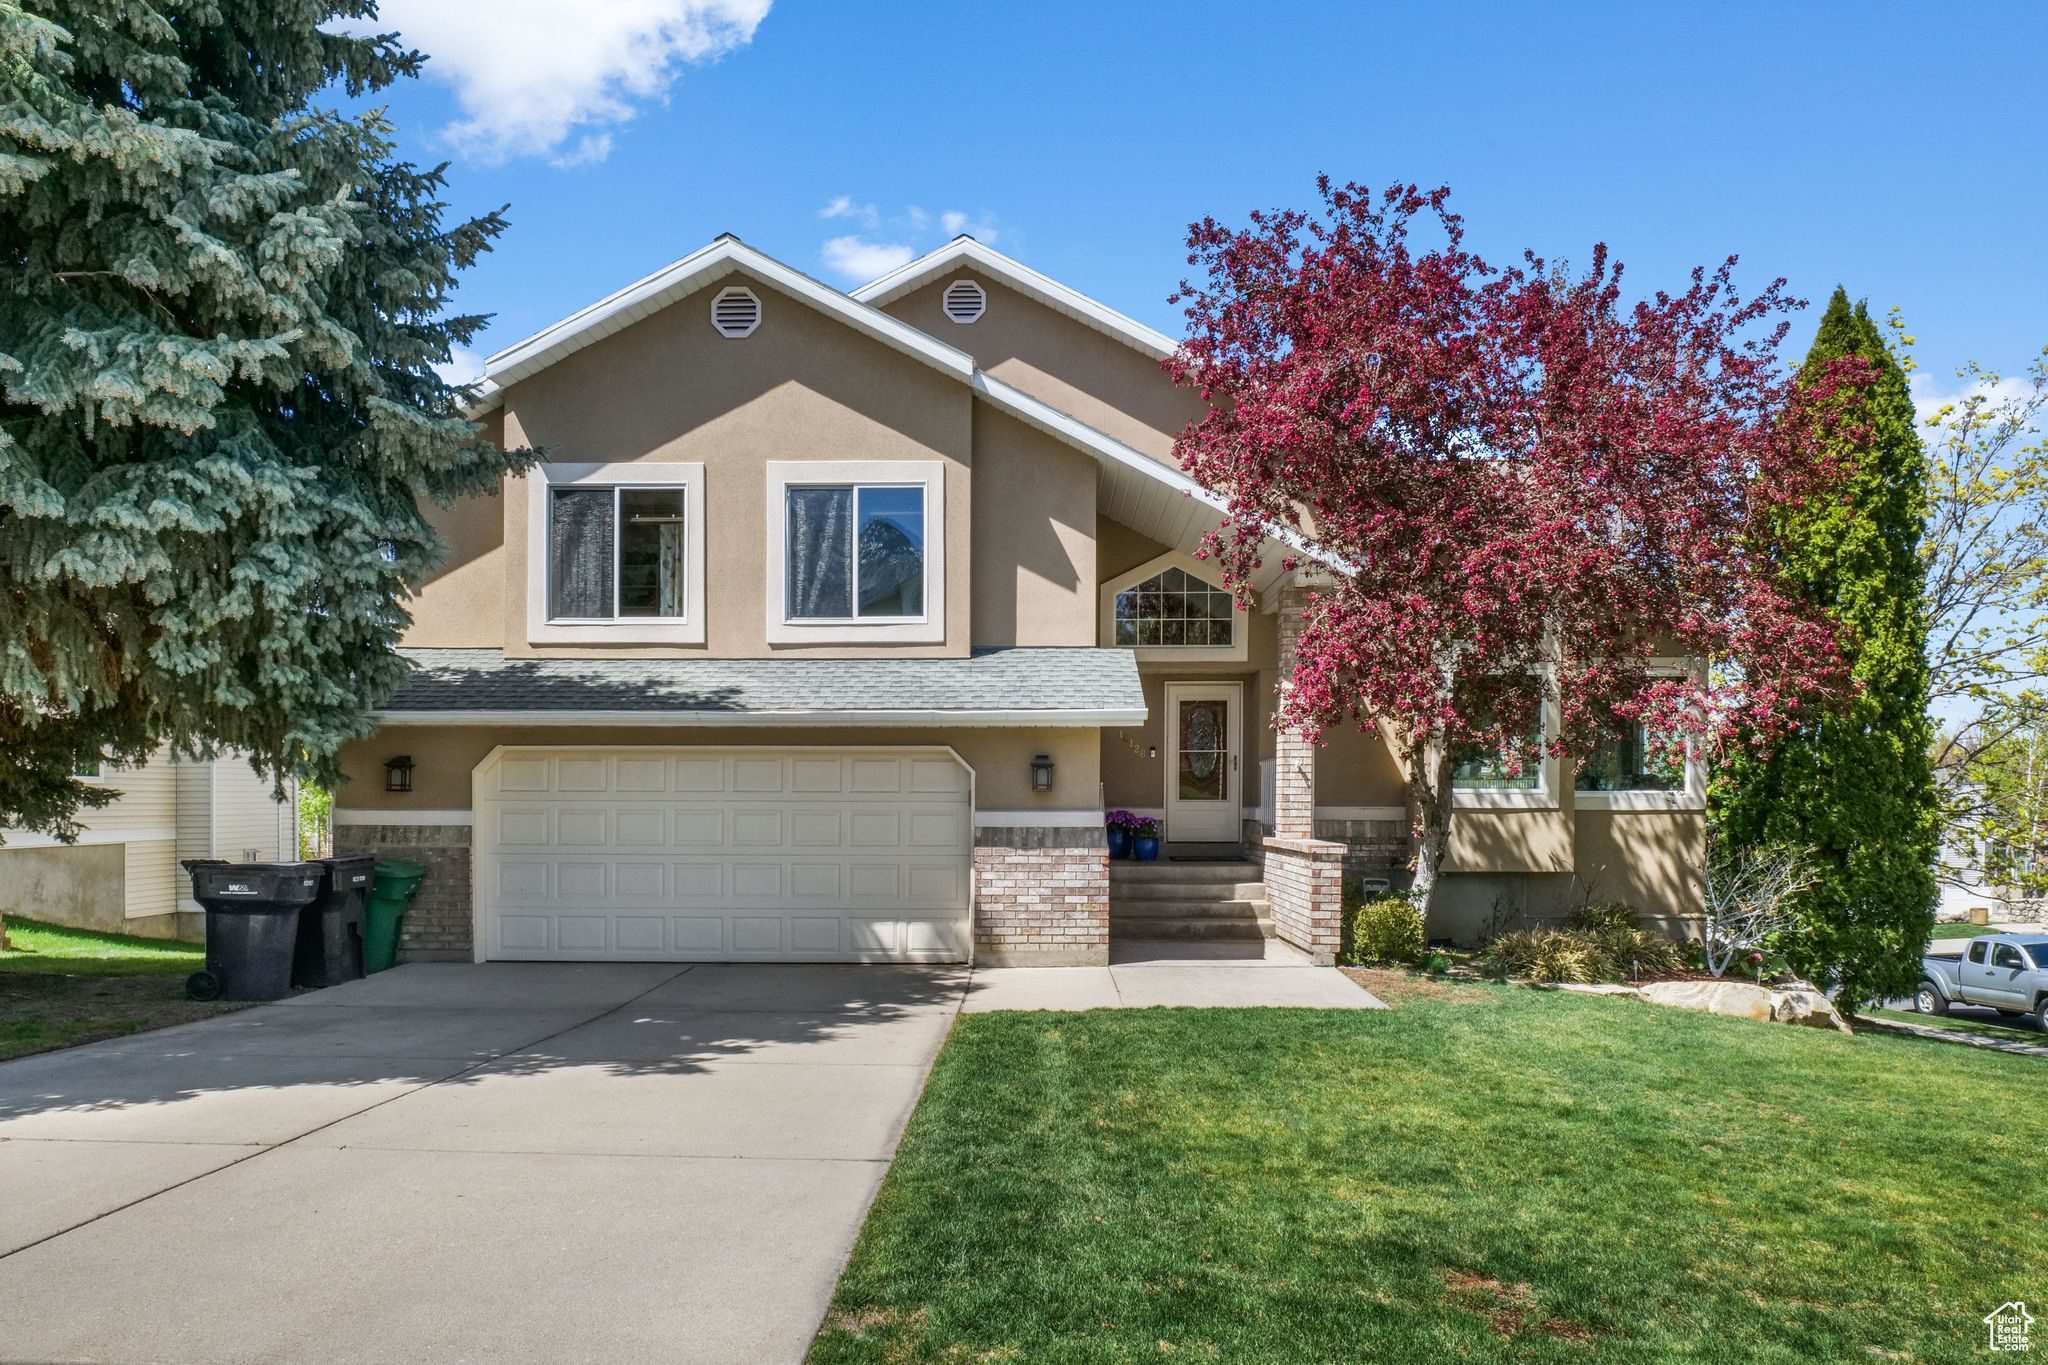
Active
$539,900
4
bds
|
3
ba
|
2,268
sqft
|
built
1964
1170 E Sego Lily Dr, Sandy, UT 84094
$-1,634
Cash flow
-15.8%
Cash-on-Cash Return
2.0%
Cap rate
0.3%
Rent to Value Ratio
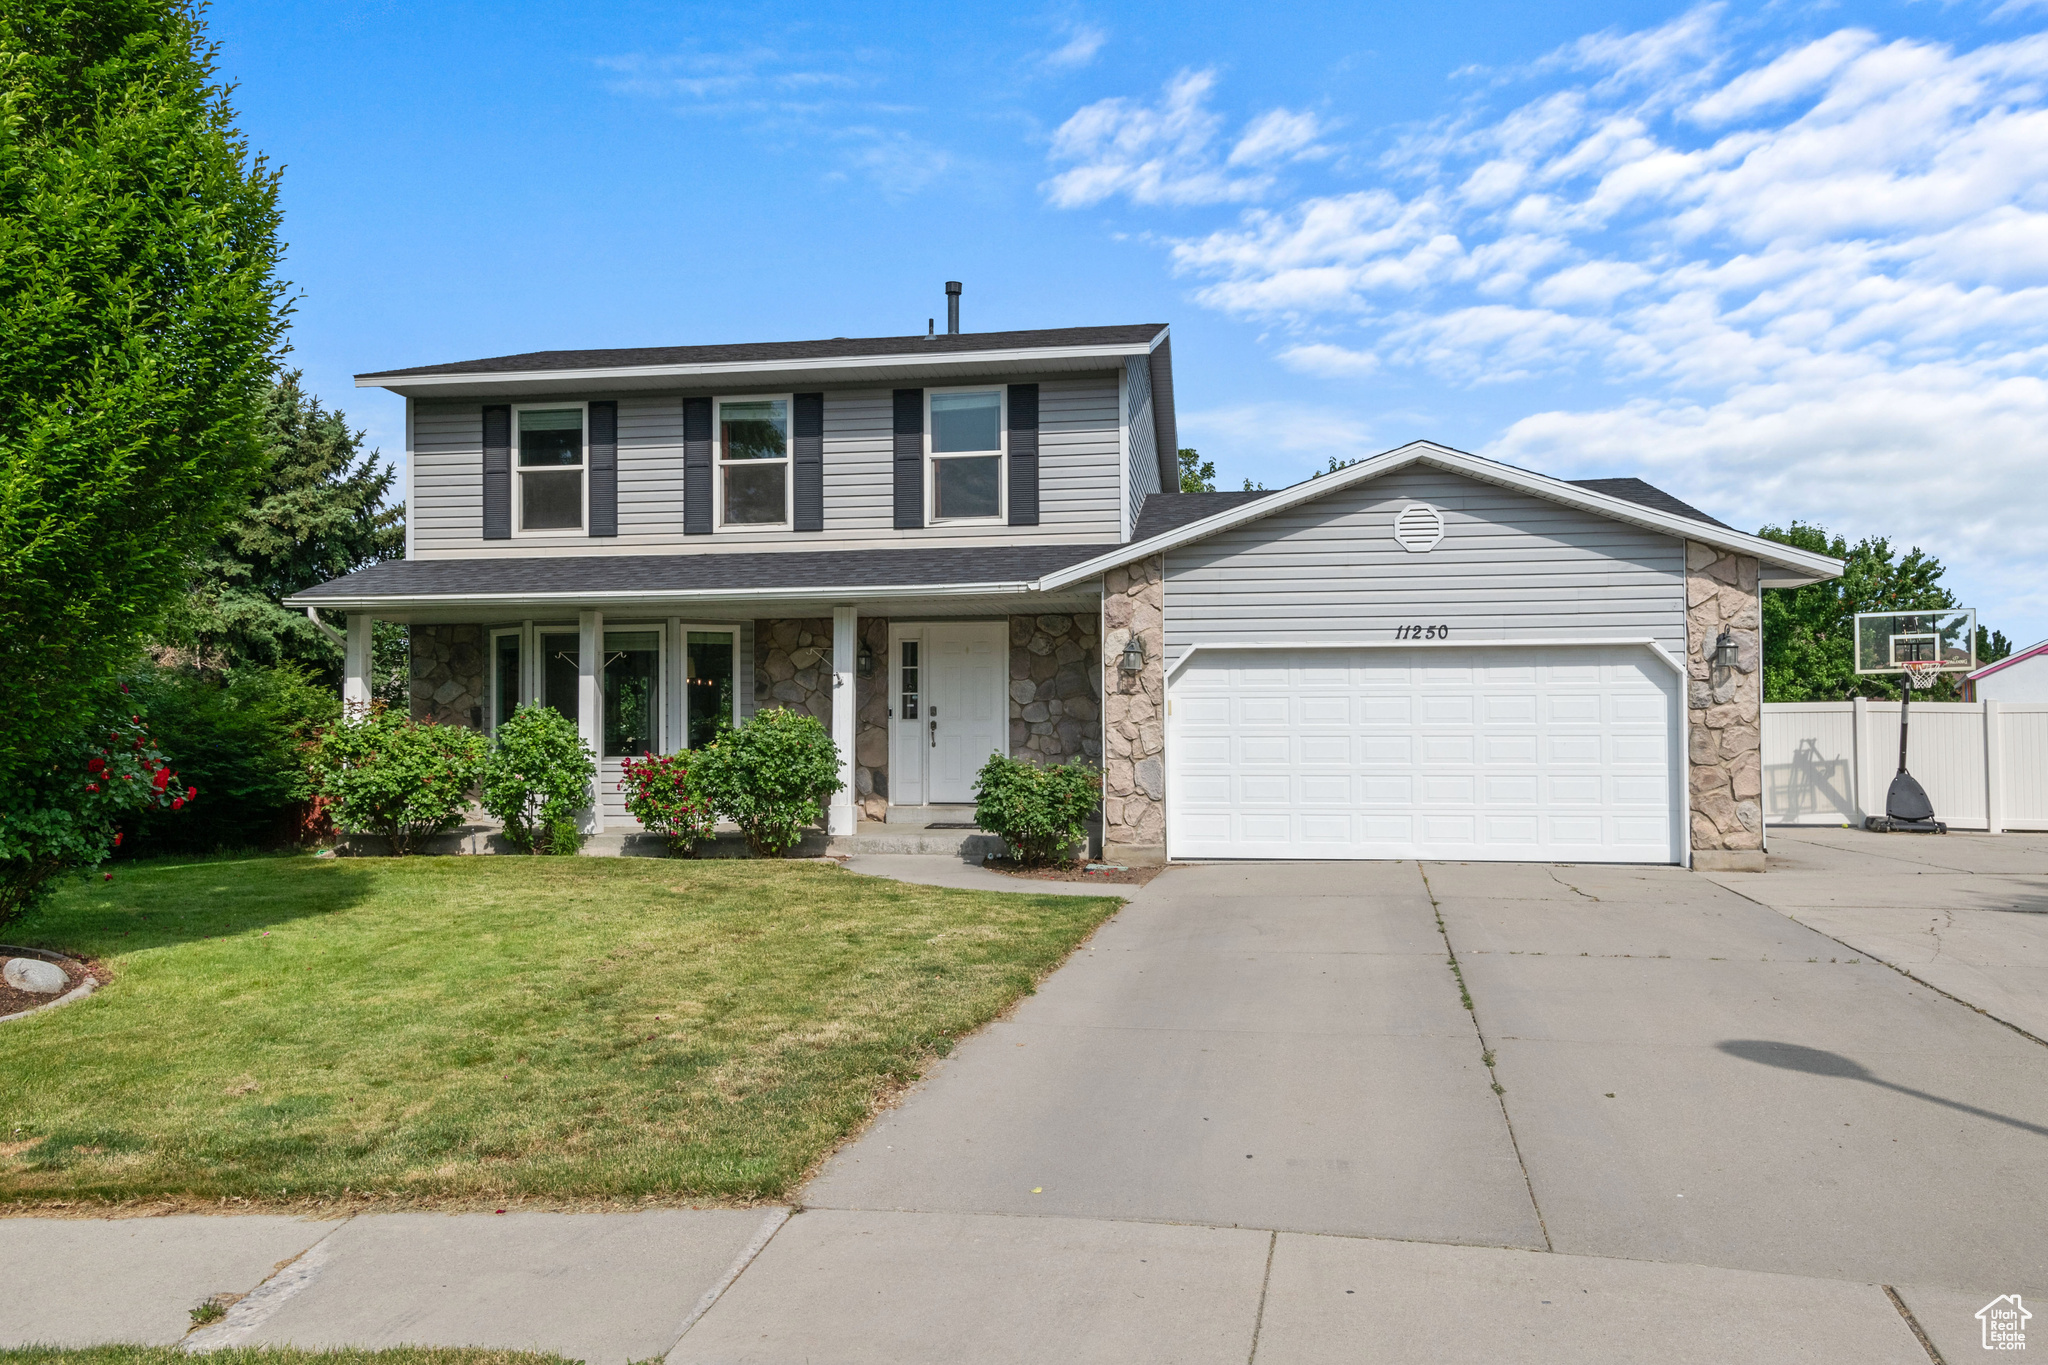
Active
$724,900
4
bds
|
4
ba
|
2,724
sqft
|
built
1989
11250 S Meadow Hill Cir, Sandy, UT 84070
$-1,300
Cash flow
-9.4%
Cash-on-Cash Return
3.5%
Cap rate
0.5%
Rent to Value Ratio
Active
$449,900
3
bds
|
2
ba
|
2,004
sqft
|
built
1973
8731 S Gladiator Way, Sandy, UT 84094
$-1,223
Cash flow
-14.2%
Cash-on-Cash Return
2.4%
Cap rate
0.4%
Rent to Value Ratio
Active
$629,900
4
bds
|
3
ba
|
1,902
sqft
|
built
1986
1211 E Spring Ridge Dr, Sandy, UT 84094
$-1,307
Cash flow
-10.8%
Cash-on-Cash Return
3.2%
Cap rate
0.4%
Rent to Value Ratio
Active
$3,250,000
6
bds
|
6
ba
|
8,164
sqft
|
built
2013
10280 S Dimple Dell Rd, Sandy, UT 84092
$-13,281
Cash flow
-21.3%
Cash-on-Cash Return
0.8%
Cap rate
0.1%
Rent to Value Ratio
Active
$869,900
5
bds
|
4
ba
|
4,146
sqft
|
built
1983
9039 S 1660 E, Sandy, UT 84093
$-2,217
Cash flow
-13.3%
Cash-on-Cash Return
2.6%
Cap rate
0.4%
Rent to Value Ratio
Active
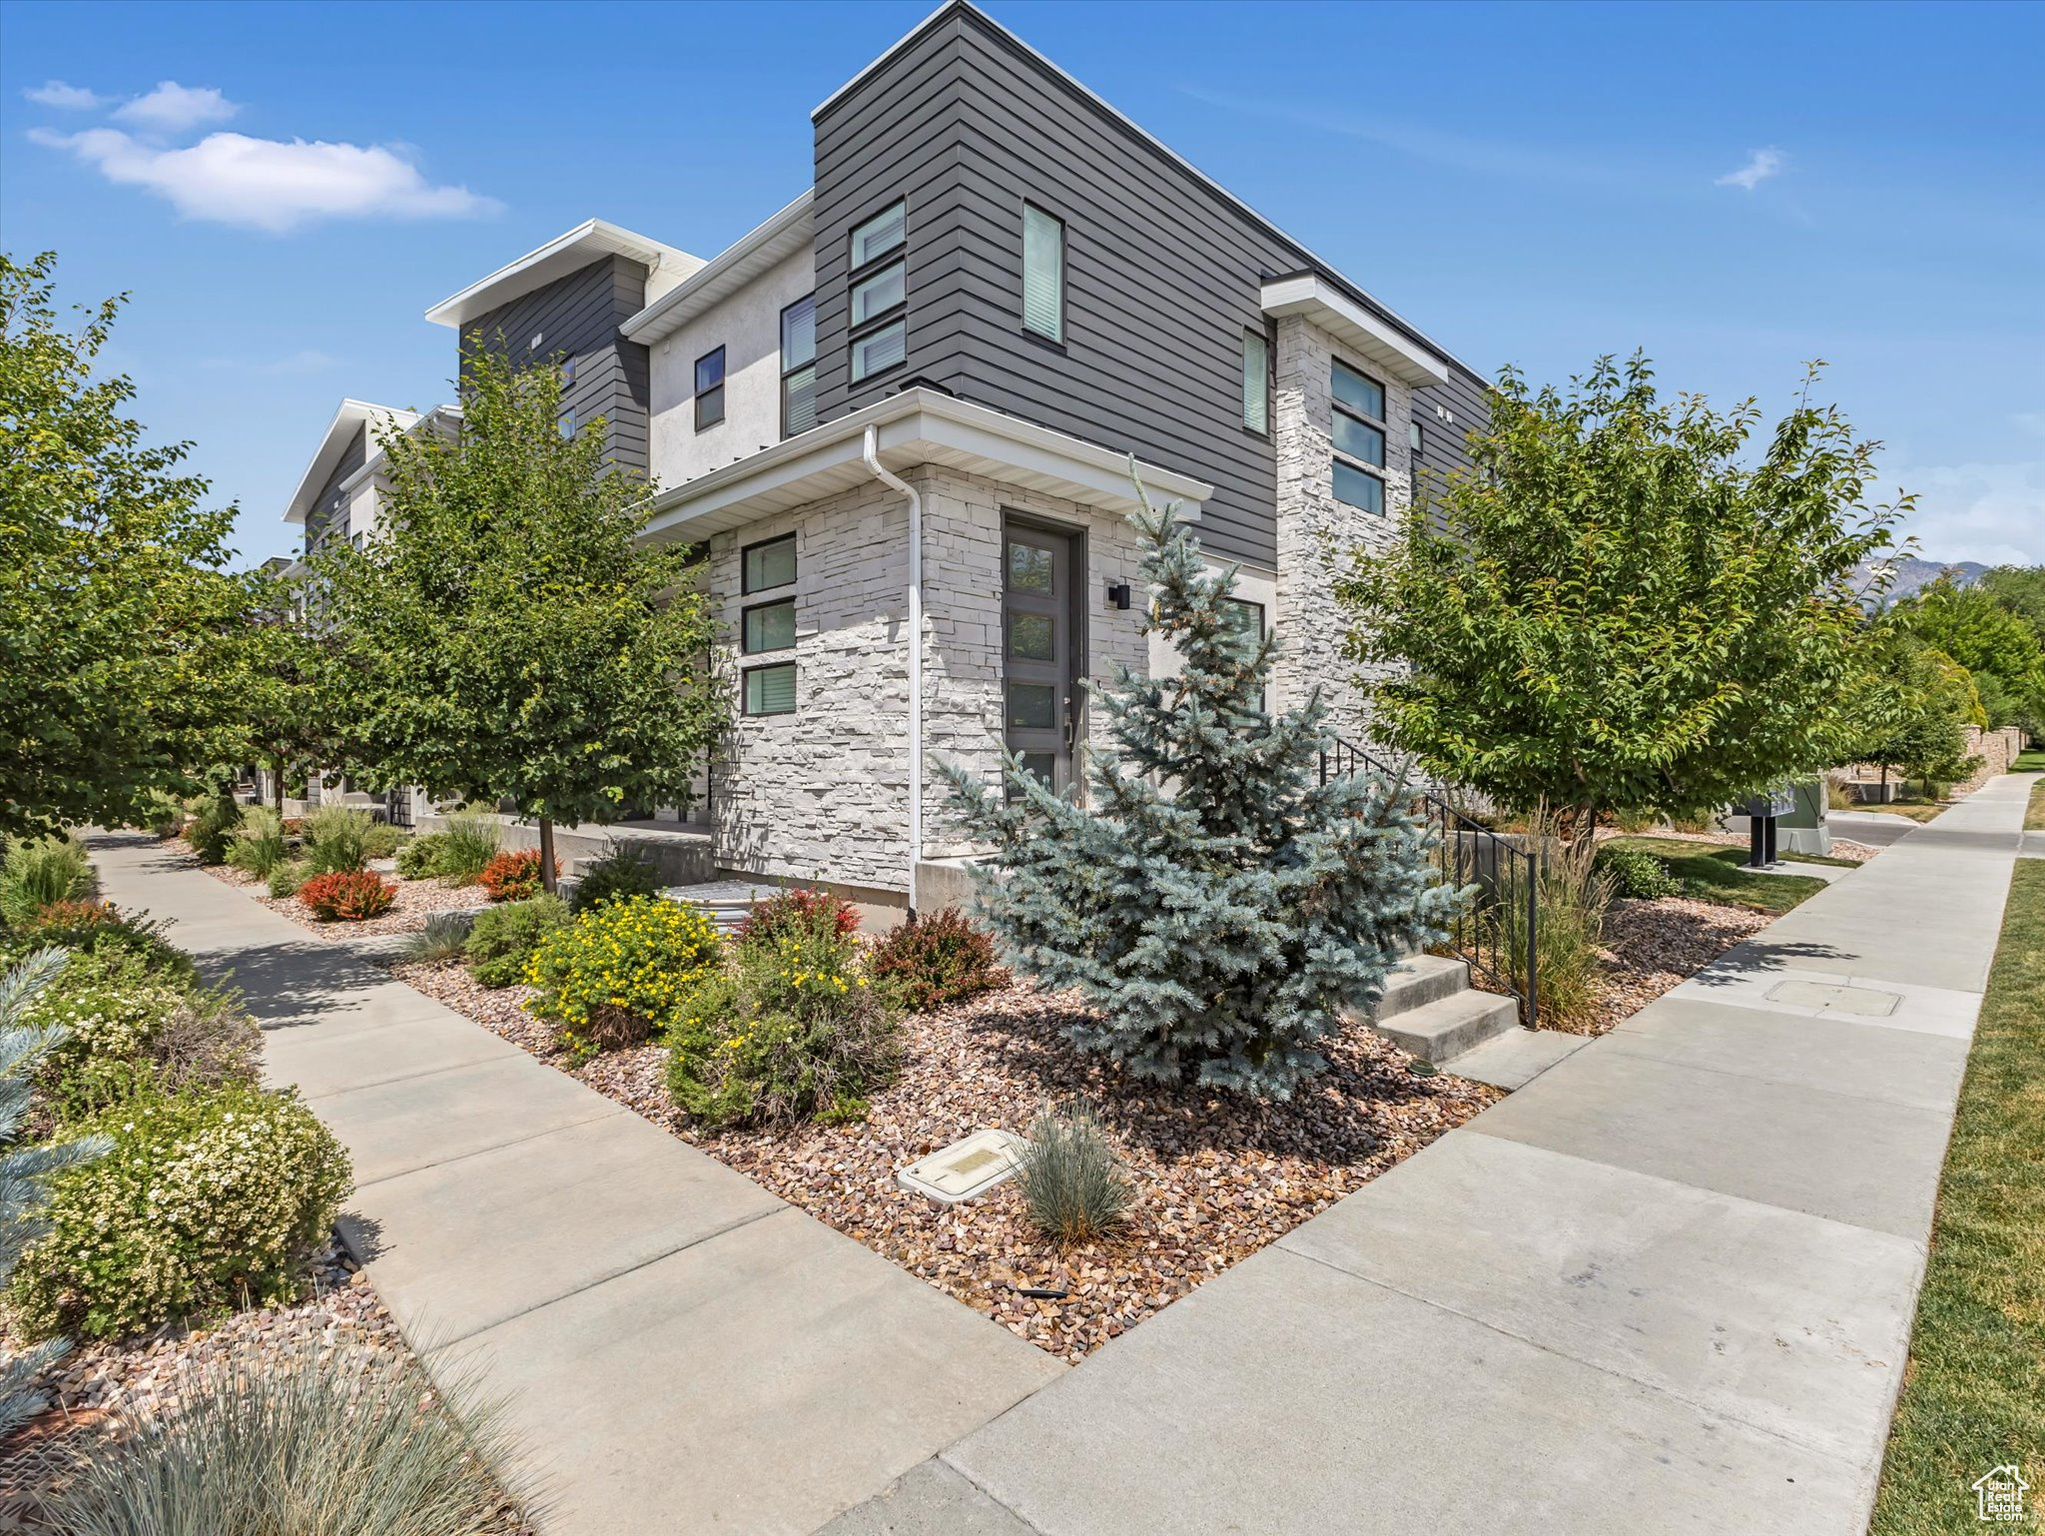
$519,000
3
bds
|
3
ba
|
2,306
sqft
|
built
2020
9217 S Holiday Bowl Ct, Sandy, UT 84094
$-1,554
Cash flow
-15.6%
Cash-on-Cash Return
2.1%
Cap rate
0.4%
Rent to Value Ratio
Active
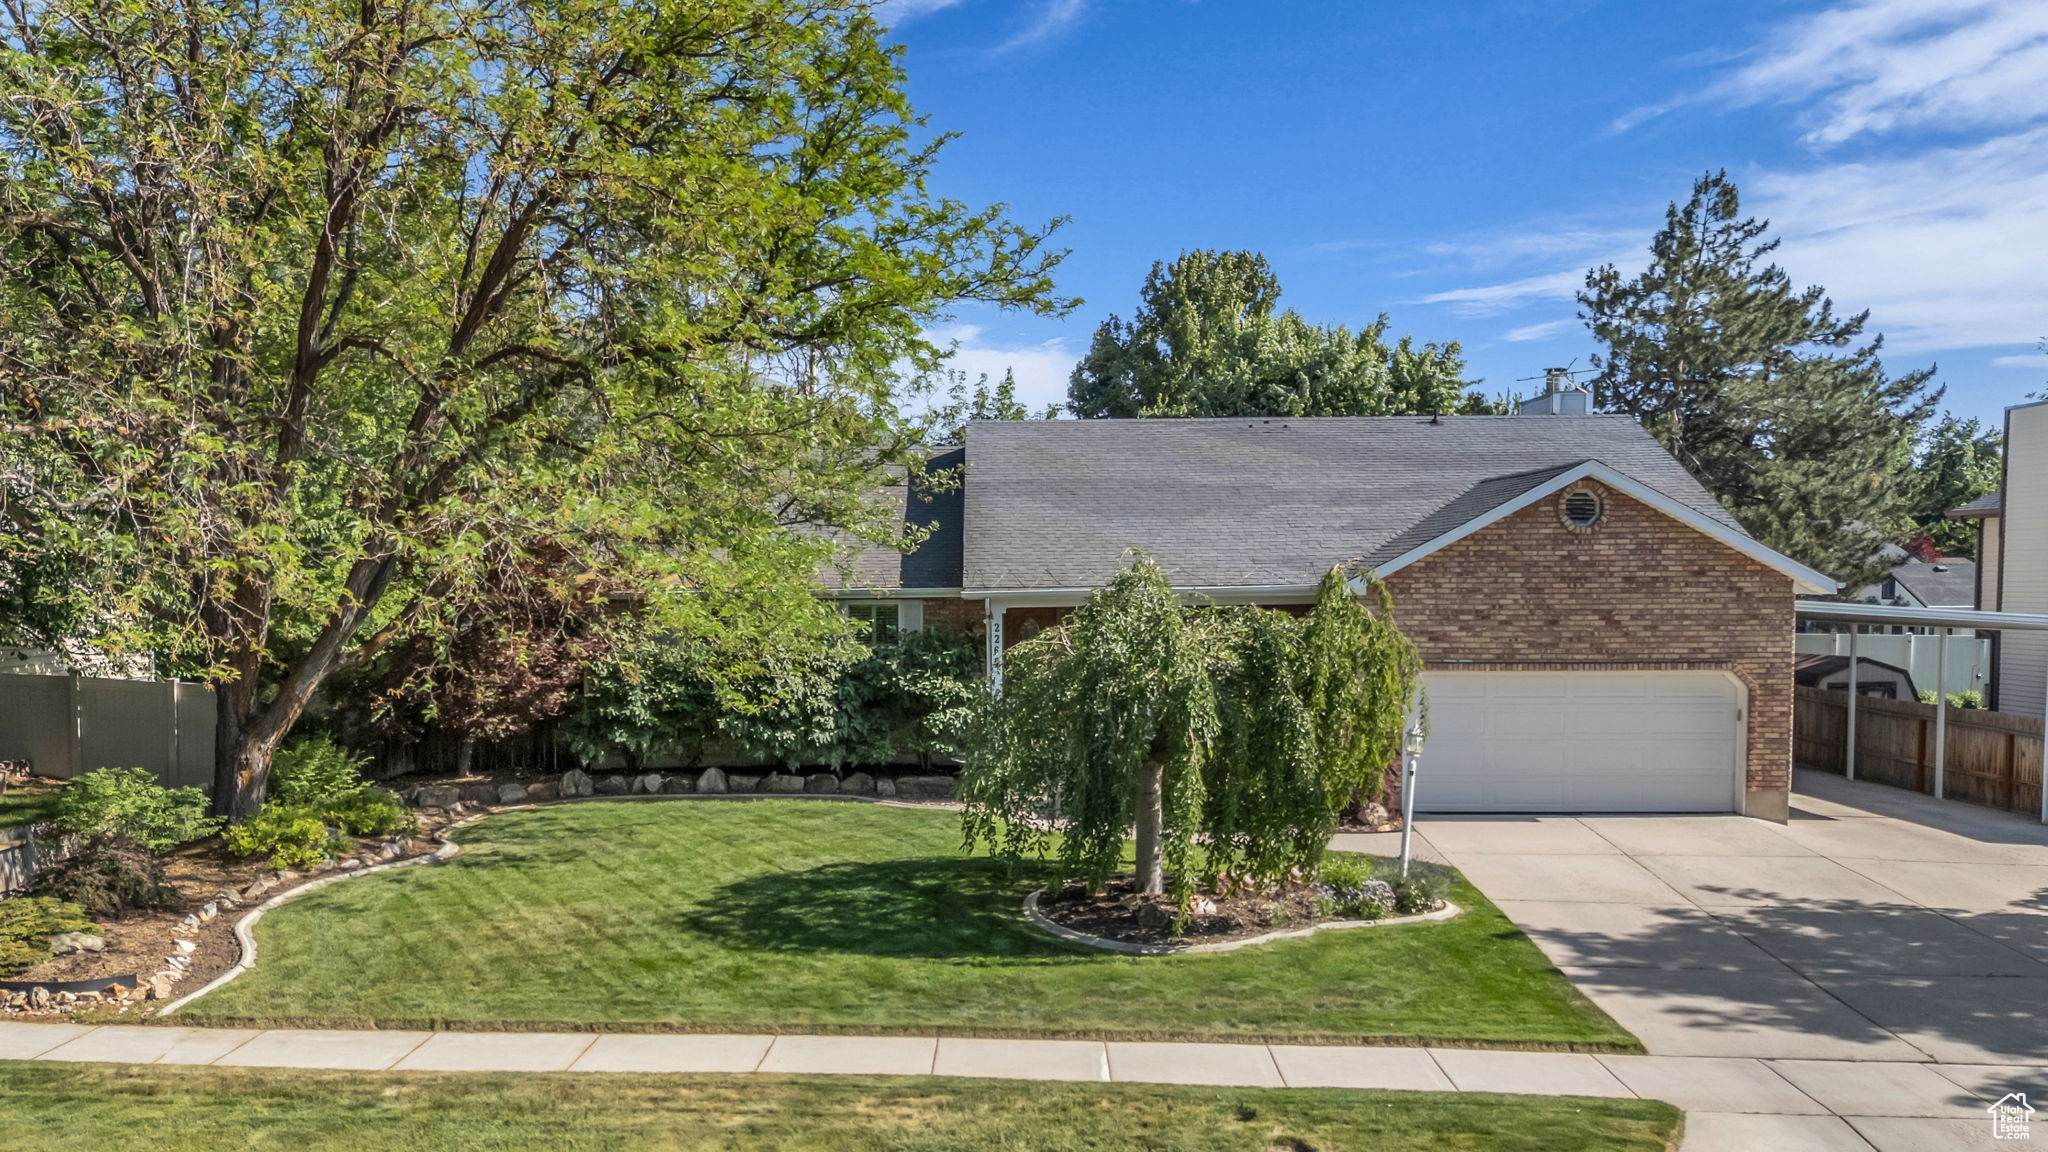
$739,000
5
bds
|
3
ba
|
3,090
sqft
|
built
1985
2268 E 10140 S, Sandy, UT 84092
$-1,822
Cash flow
-12.9%
Cash-on-Cash Return
2.7%
Cap rate
0.4%
Rent to Value Ratio
Active
$1,650,000
5
bds
|
6
ba
|
6,569
sqft
|
built
1980
12144 S Mountain Shadow Rd, Sandy, UT 84092
$-5,213
Cash flow
-16.5%
Cash-on-Cash Return
1.9%
Cap rate
0.3%
Rent to Value Ratio
Active
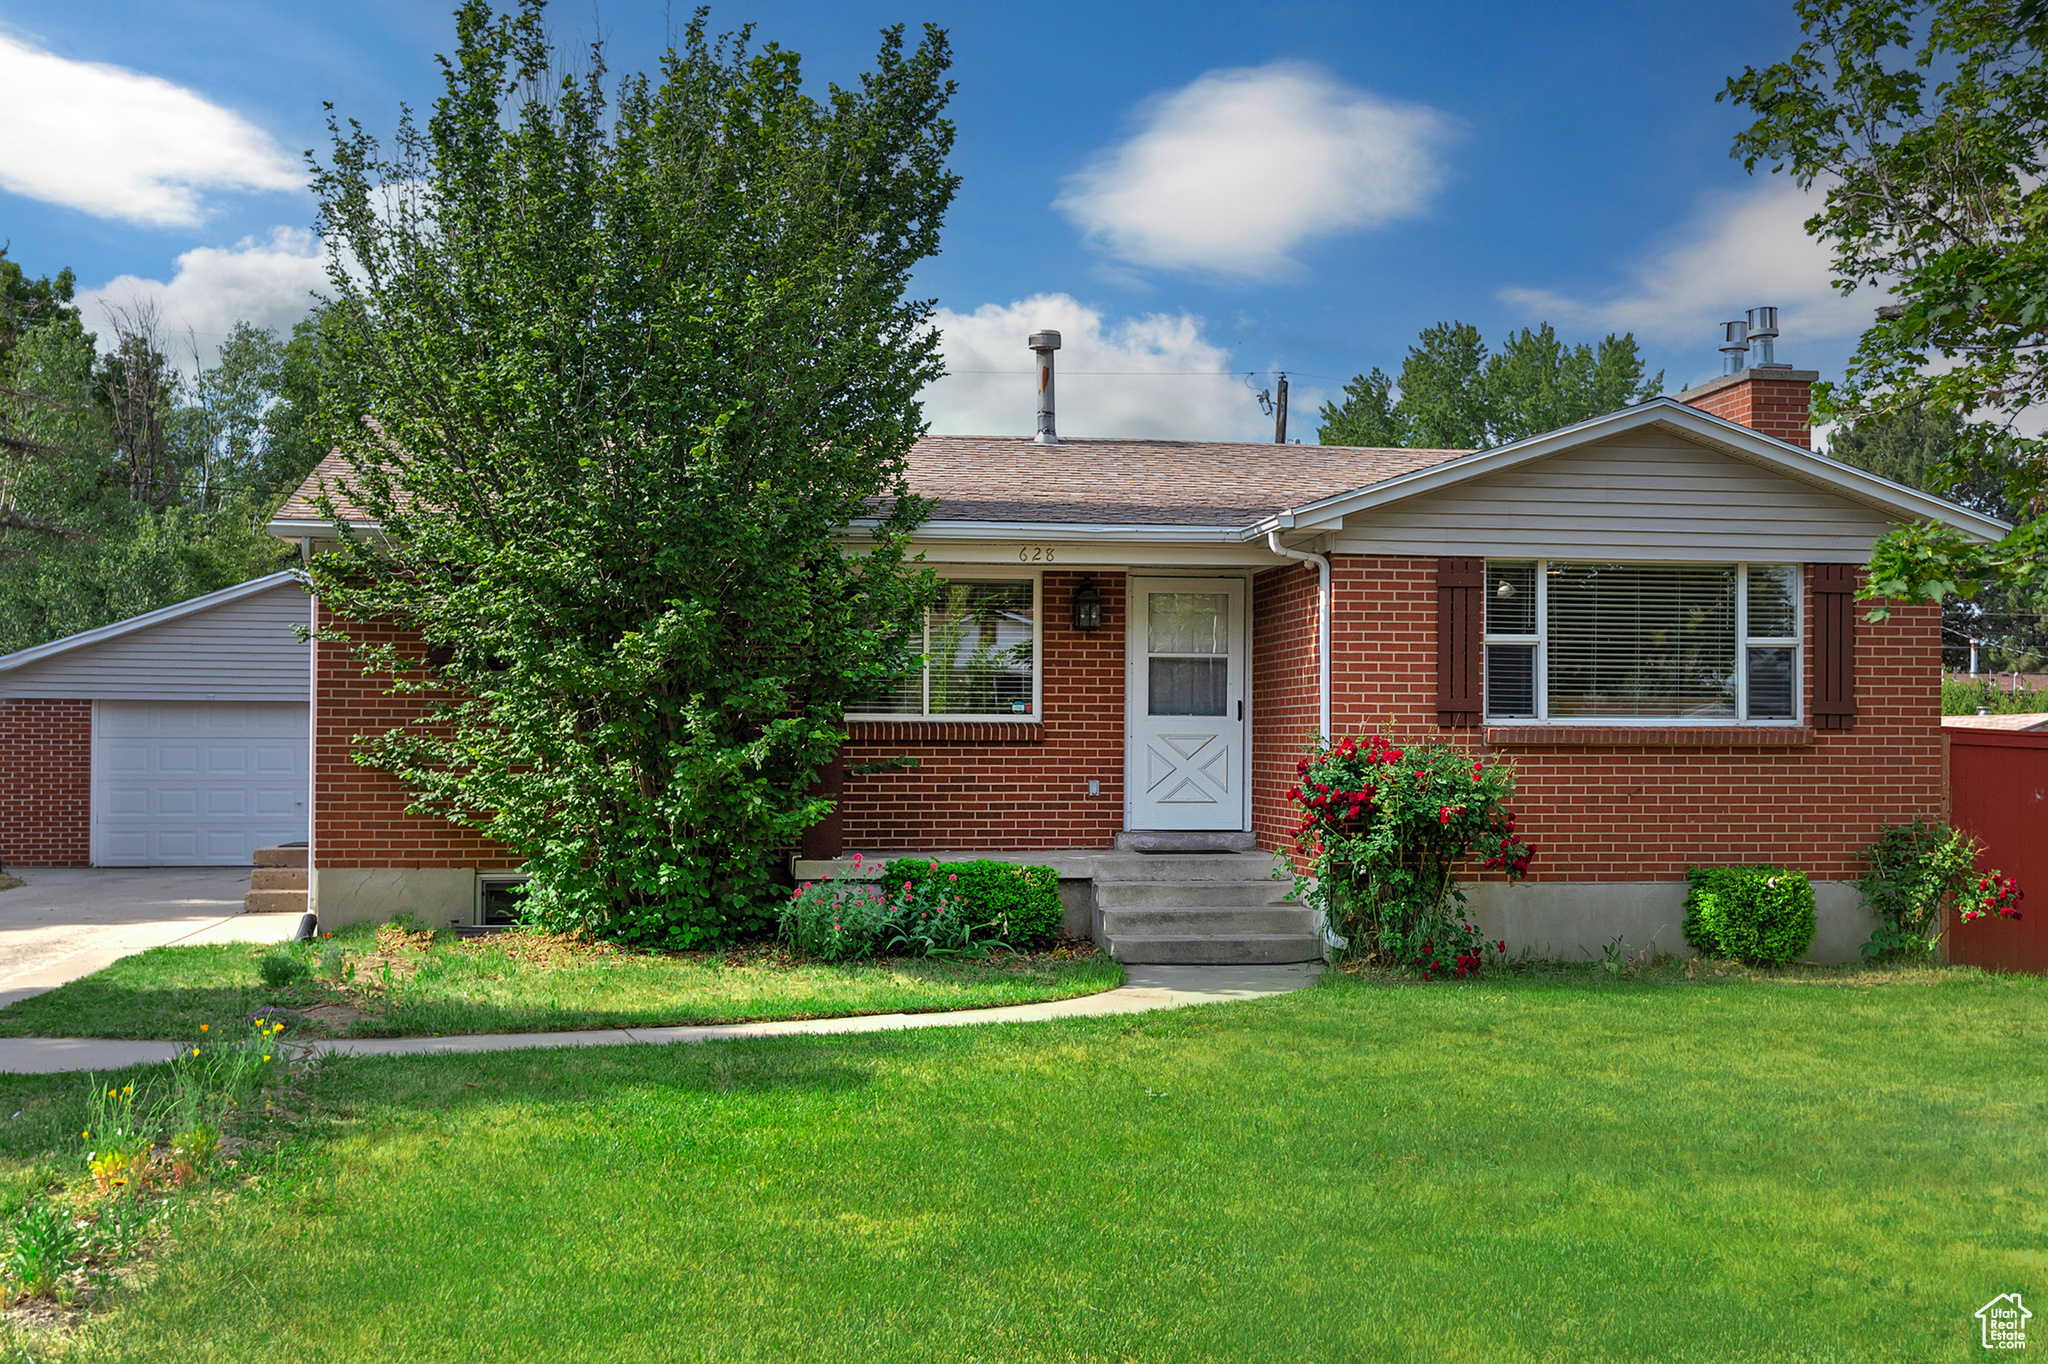
$575,000
4
bds
|
2
ba
|
2,268
sqft
|
built
1964
628 E Wyandotte Ave, Sandy, UT 84070
$-1,117
Cash flow
-10.1%
Cash-on-Cash Return
3.3%
Cap rate
0.5%
Rent to Value Ratio
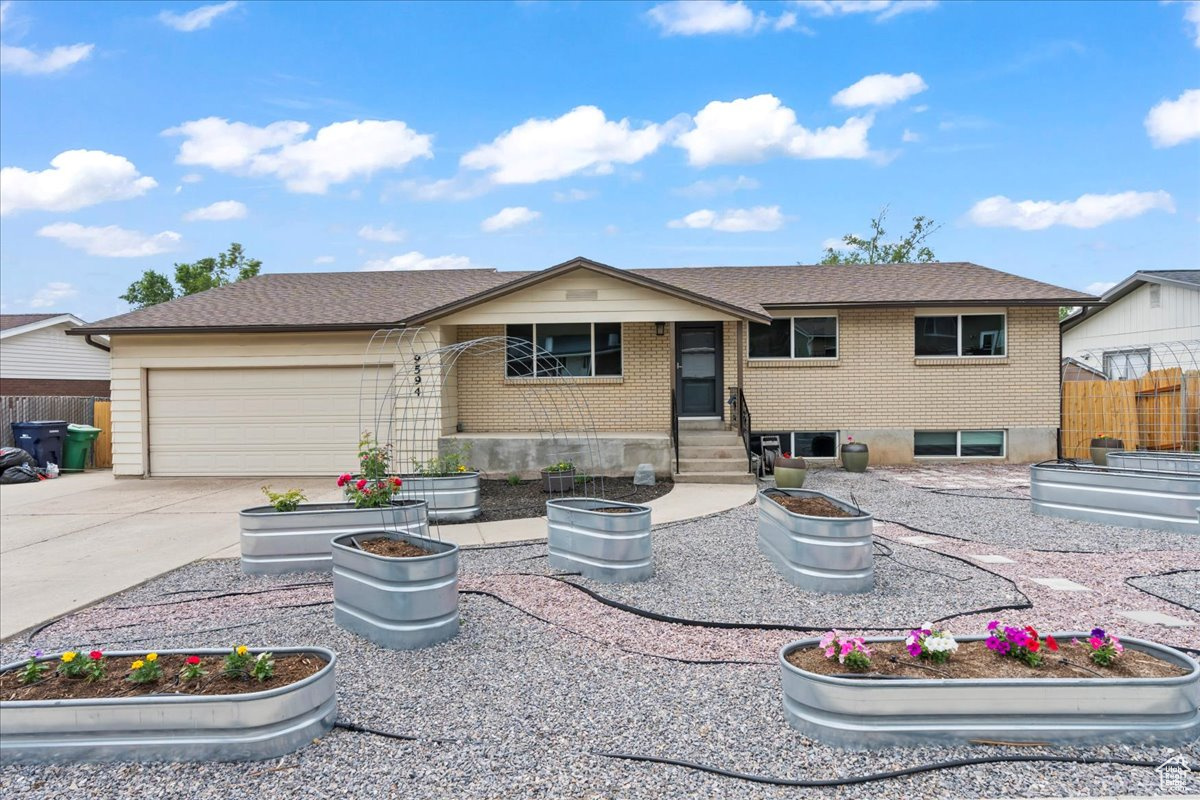
Active
$620,000
5
bds
|
3
ba
|
2,786
sqft
|
built
1975
9594 S 1210 E, Sandy, UT 84094
$-1,230
Cash flow
-10.4%
Cash-on-Cash Return
3.3%
Cap rate
0.5%
Rent to Value Ratio
Active
$999,000
5
bds
|
4
ba
|
3,480
sqft
|
built
1990
11496 S Rockhampton Dr, Sandy, UT 84092
$-2,890
Cash flow
-15.1%
Cash-on-Cash Return
2.2%
Cap rate
0.3%
Rent to Value Ratio
Active
$939,000
5
bds
|
4
ba
|
3,512
sqft
|
built
1989
10128 S 2460 E, Sandy, UT 84092
$-2,084
Cash flow
-11.6%
Cash-on-Cash Return
3.0%
Cap rate
0.4%
Rent to Value Ratio
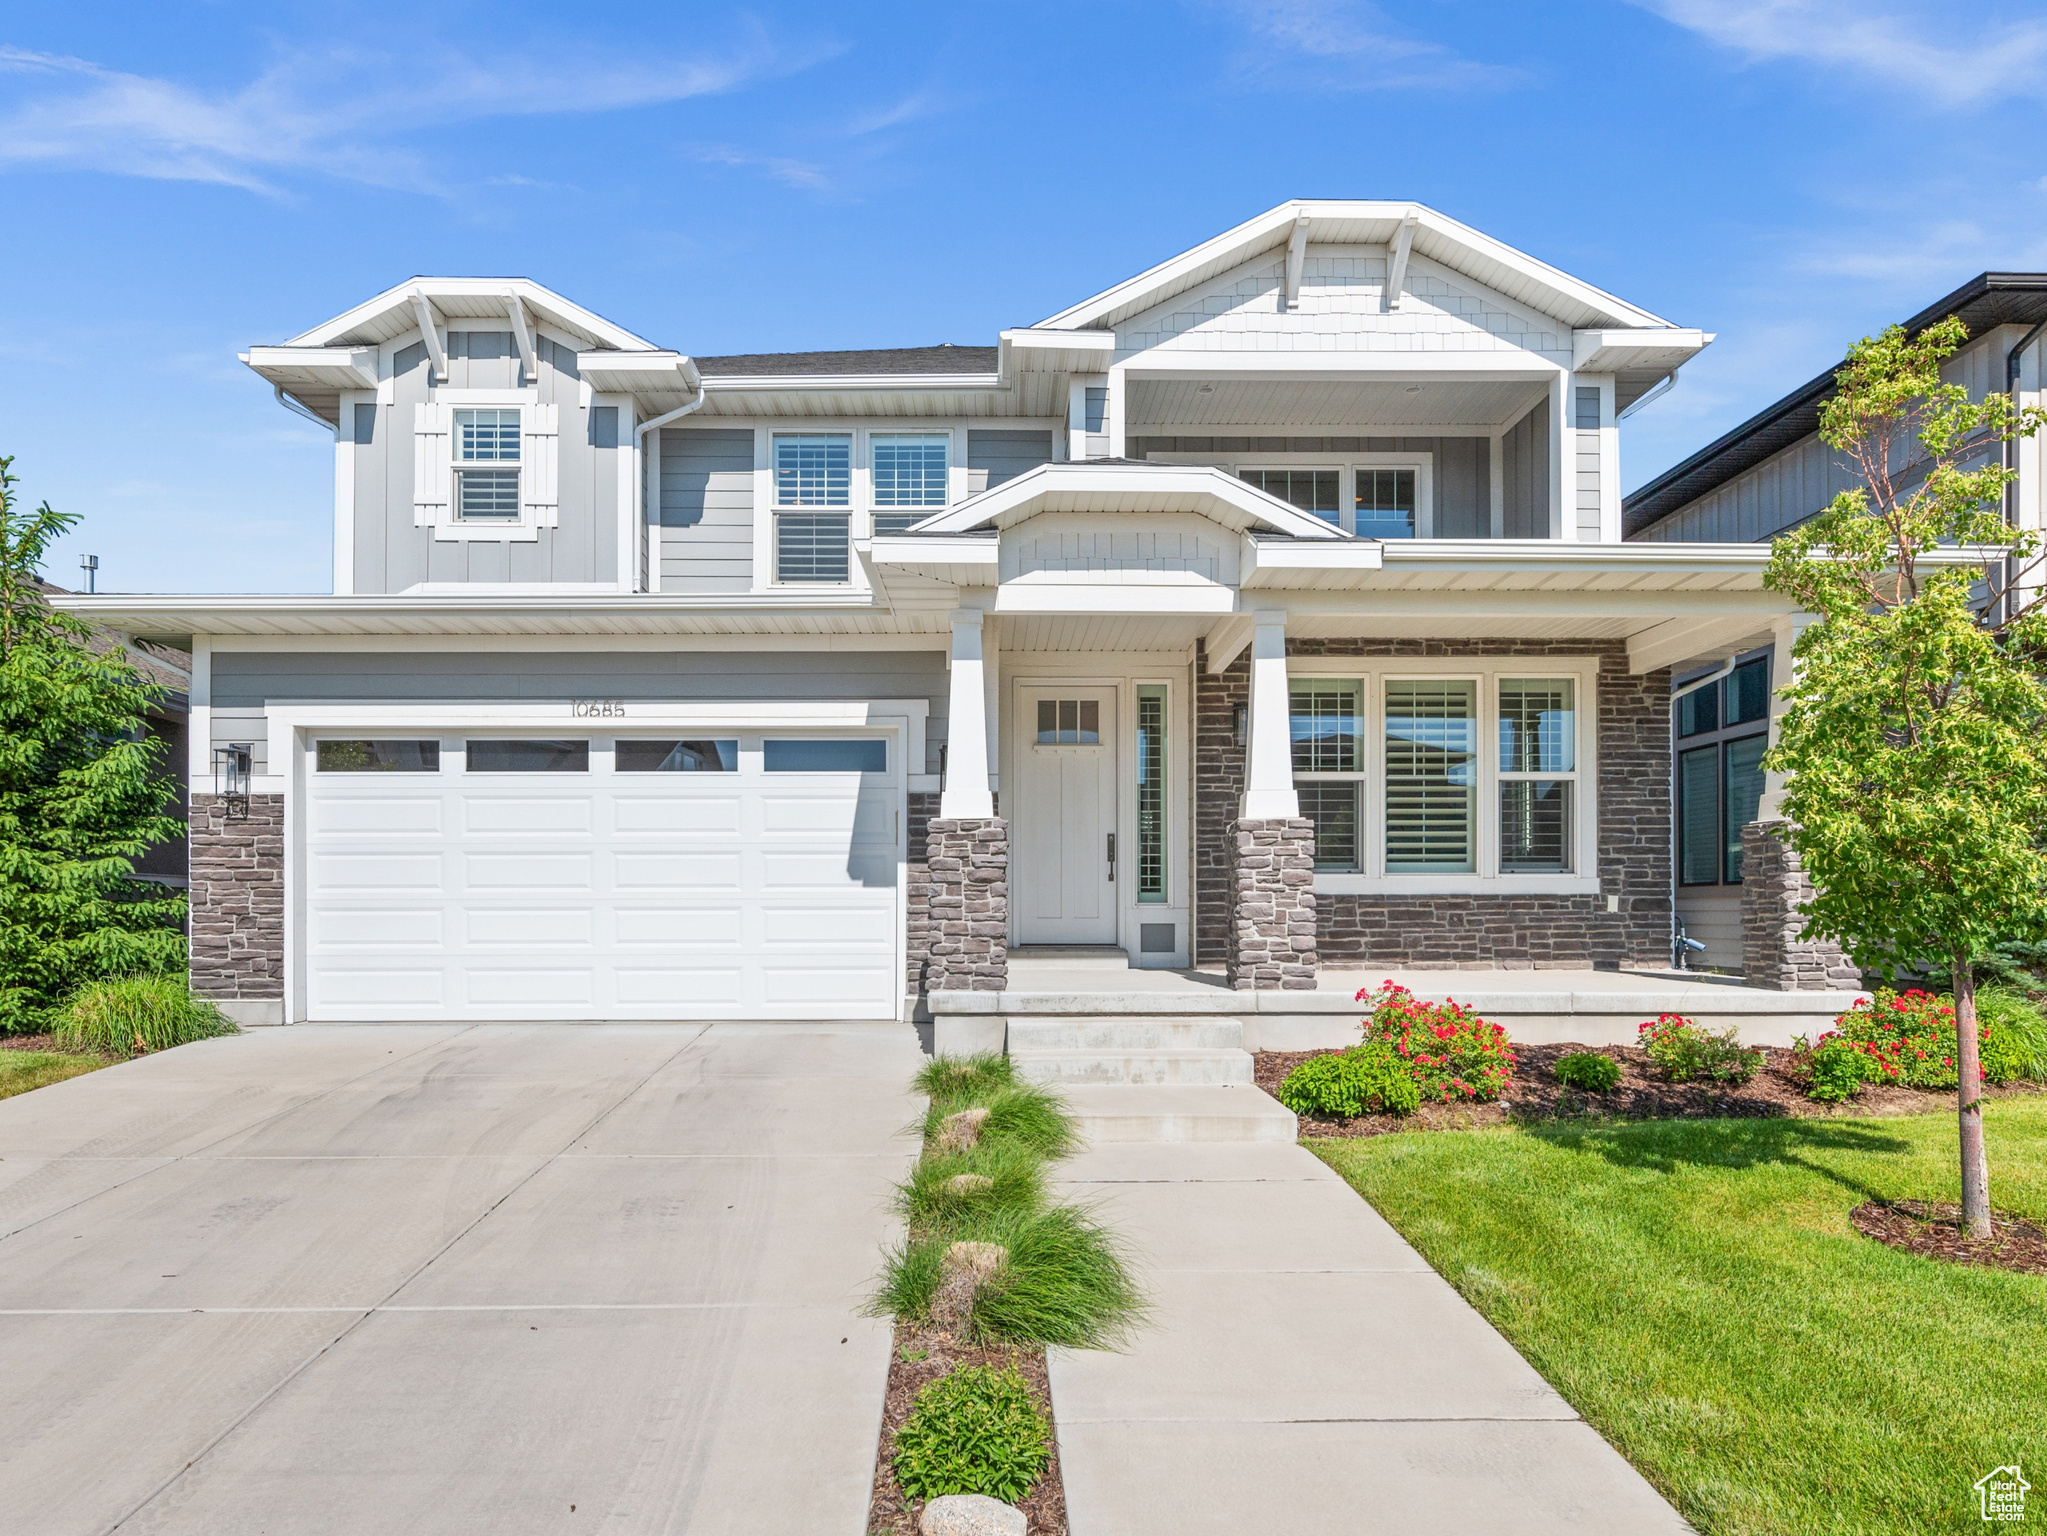
Active under contract
$799,000
3
bds
|
3
ba
|
3,603
sqft
|
built
2018
10685 S Dielsdorf Rd, Sandy, UT 84092
$-1,272
Cash flow
-8.3%
Cash-on-Cash Return
3.8%
Cap rate
0.6%
Rent to Value Ratio
Active
$930,000
4
bds
|
4
ba
|
3,178
sqft
|
built
2004
8036 S 1000 E, Sandy, UT 84094
$-2,620
Cash flow
-14.7%
Cash-on-Cash Return
2.3%
Cap rate
0.3%
Rent to Value Ratio
Active
$479,000
5
bds
|
3
ba
|
2,416
sqft
|
built
1978
8335 S 1050 E, Sandy, UT 84094
$-1,037
Cash flow
-11.3%
Cash-on-Cash Return
3.1%
Cap rate
0.5%
Rent to Value Ratio
Active
$2,699,000
5
bds
|
5
ba
|
4,299
sqft
|
built
1983
3787 E Little Cottonwood Ln, Sandy, UT 84092
$-10,856
Cash flow
-21.0%
Cash-on-Cash Return
0.9%
Cap rate
0.1%
Rent to Value Ratio
Active
$550,000
4
bds
|
4
ba
|
1,947
sqft
|
built
1998
7819 S Spruce Tree Ln, Sandy, UT 84094
$-1,262
Cash flow
-12.0%
Cash-on-Cash Return
2.9%
Cap rate
0.5%
Rent to Value Ratio
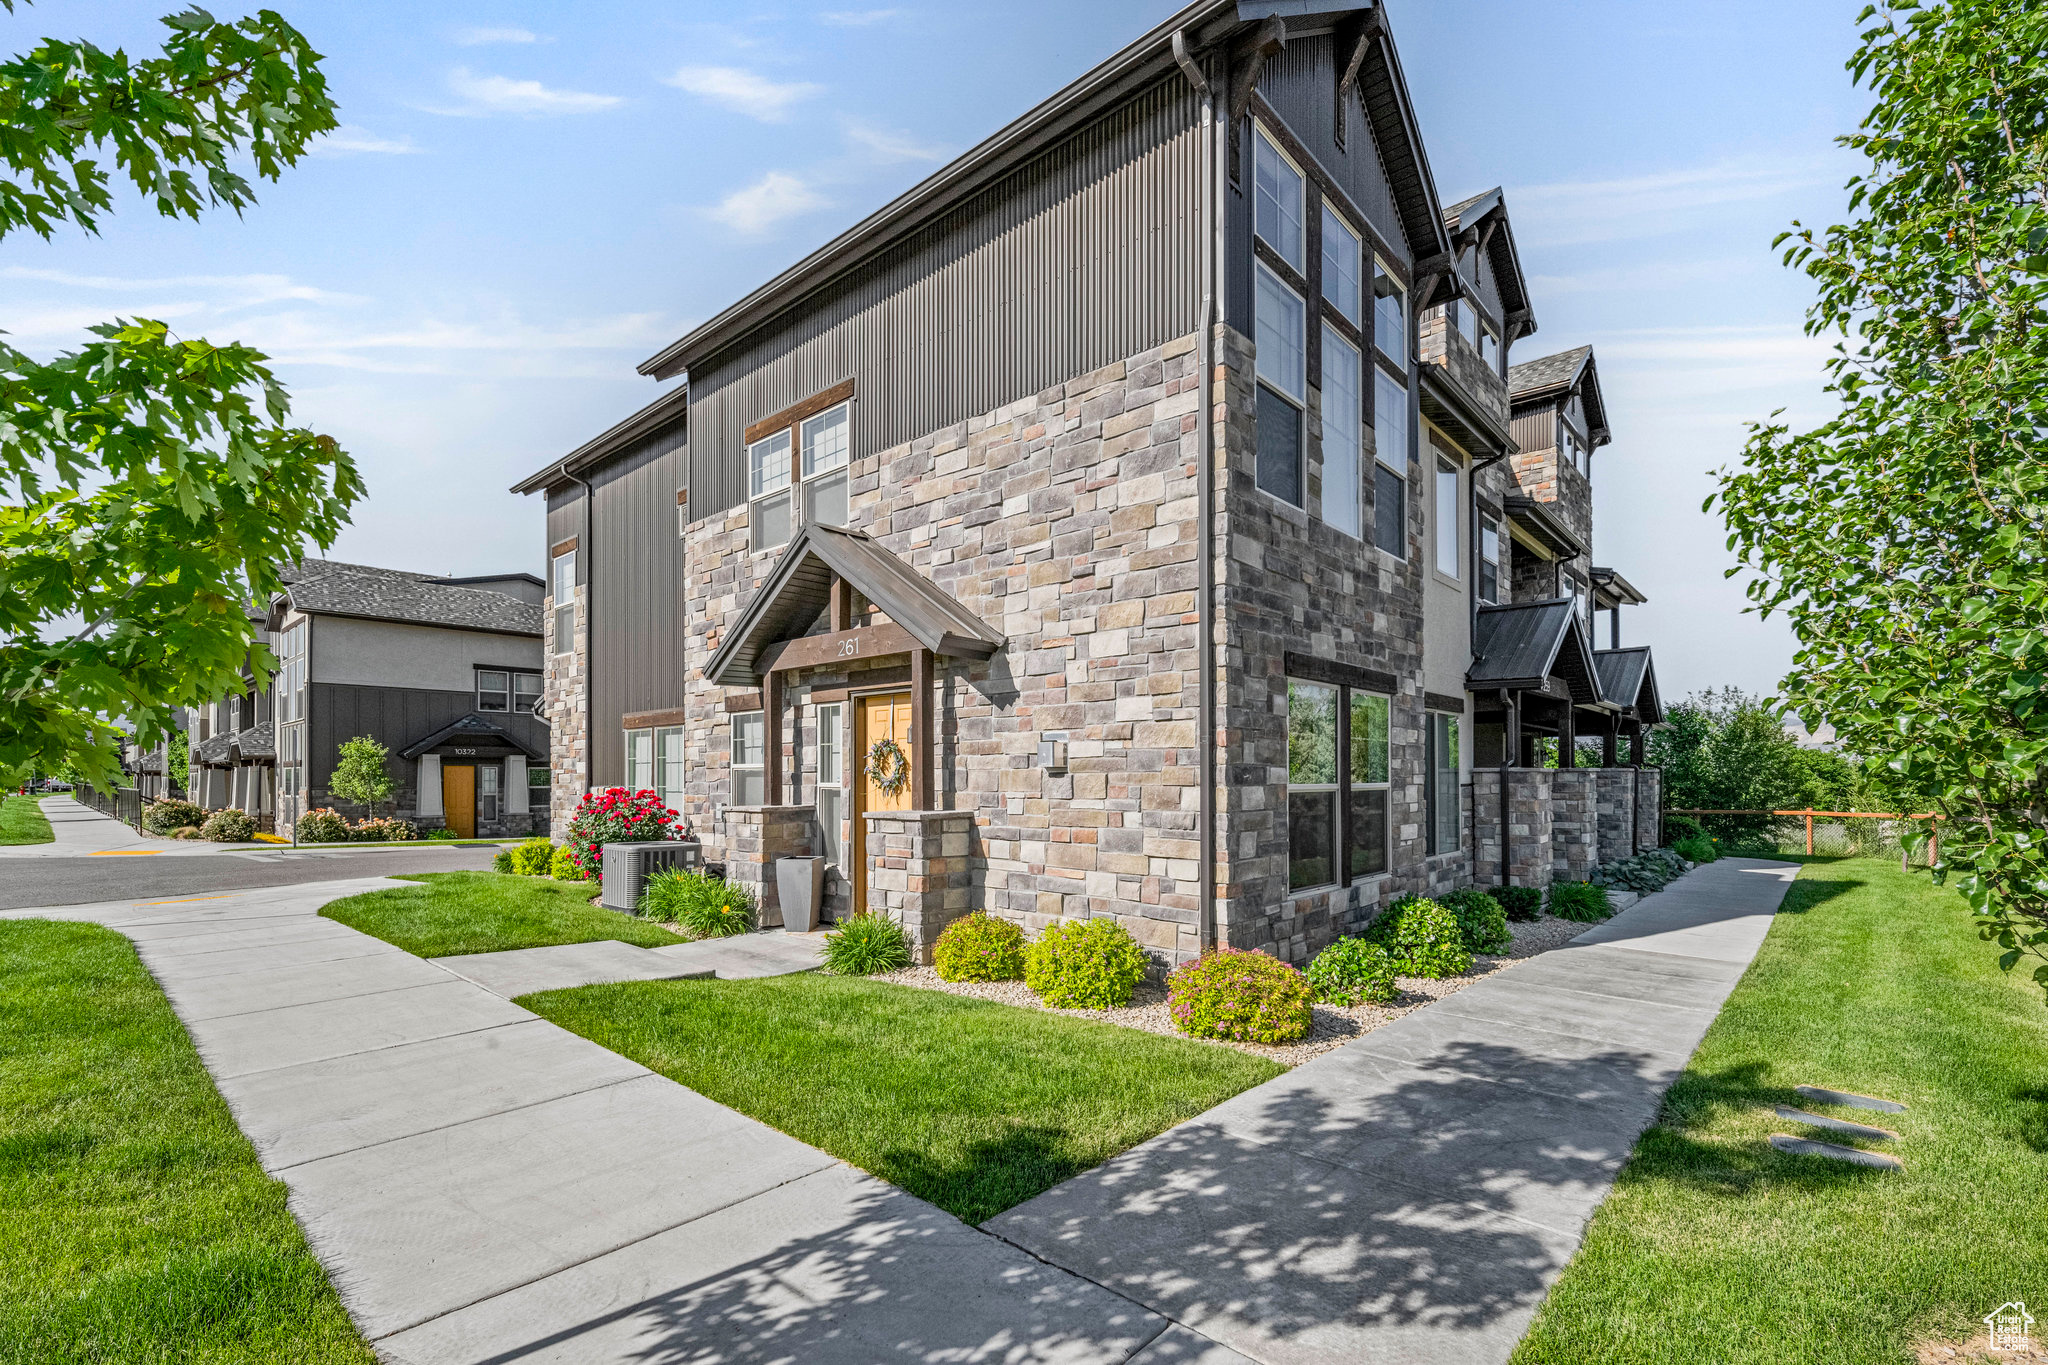
Active
$575,000
3
bds
|
3
ba
|
1,631
sqft
|
built
2020
261 E Sage Canal Way, Sandy, UT 84070
$-1,759
Cash flow
-16.0%
Cash-on-Cash Return
2.0%
Cap rate
0.3%
Rent to Value Ratio
Active
$1,695,000
6
bds
|
5
ba
|
6,435
sqft
|
built
1993
11939 S Hidden Canyon Ln, Sandy, UT 84092
$-5,599
Cash flow
-17.2%
Cash-on-Cash Return
1.7%
Cap rate
0.3%
Rent to Value Ratio
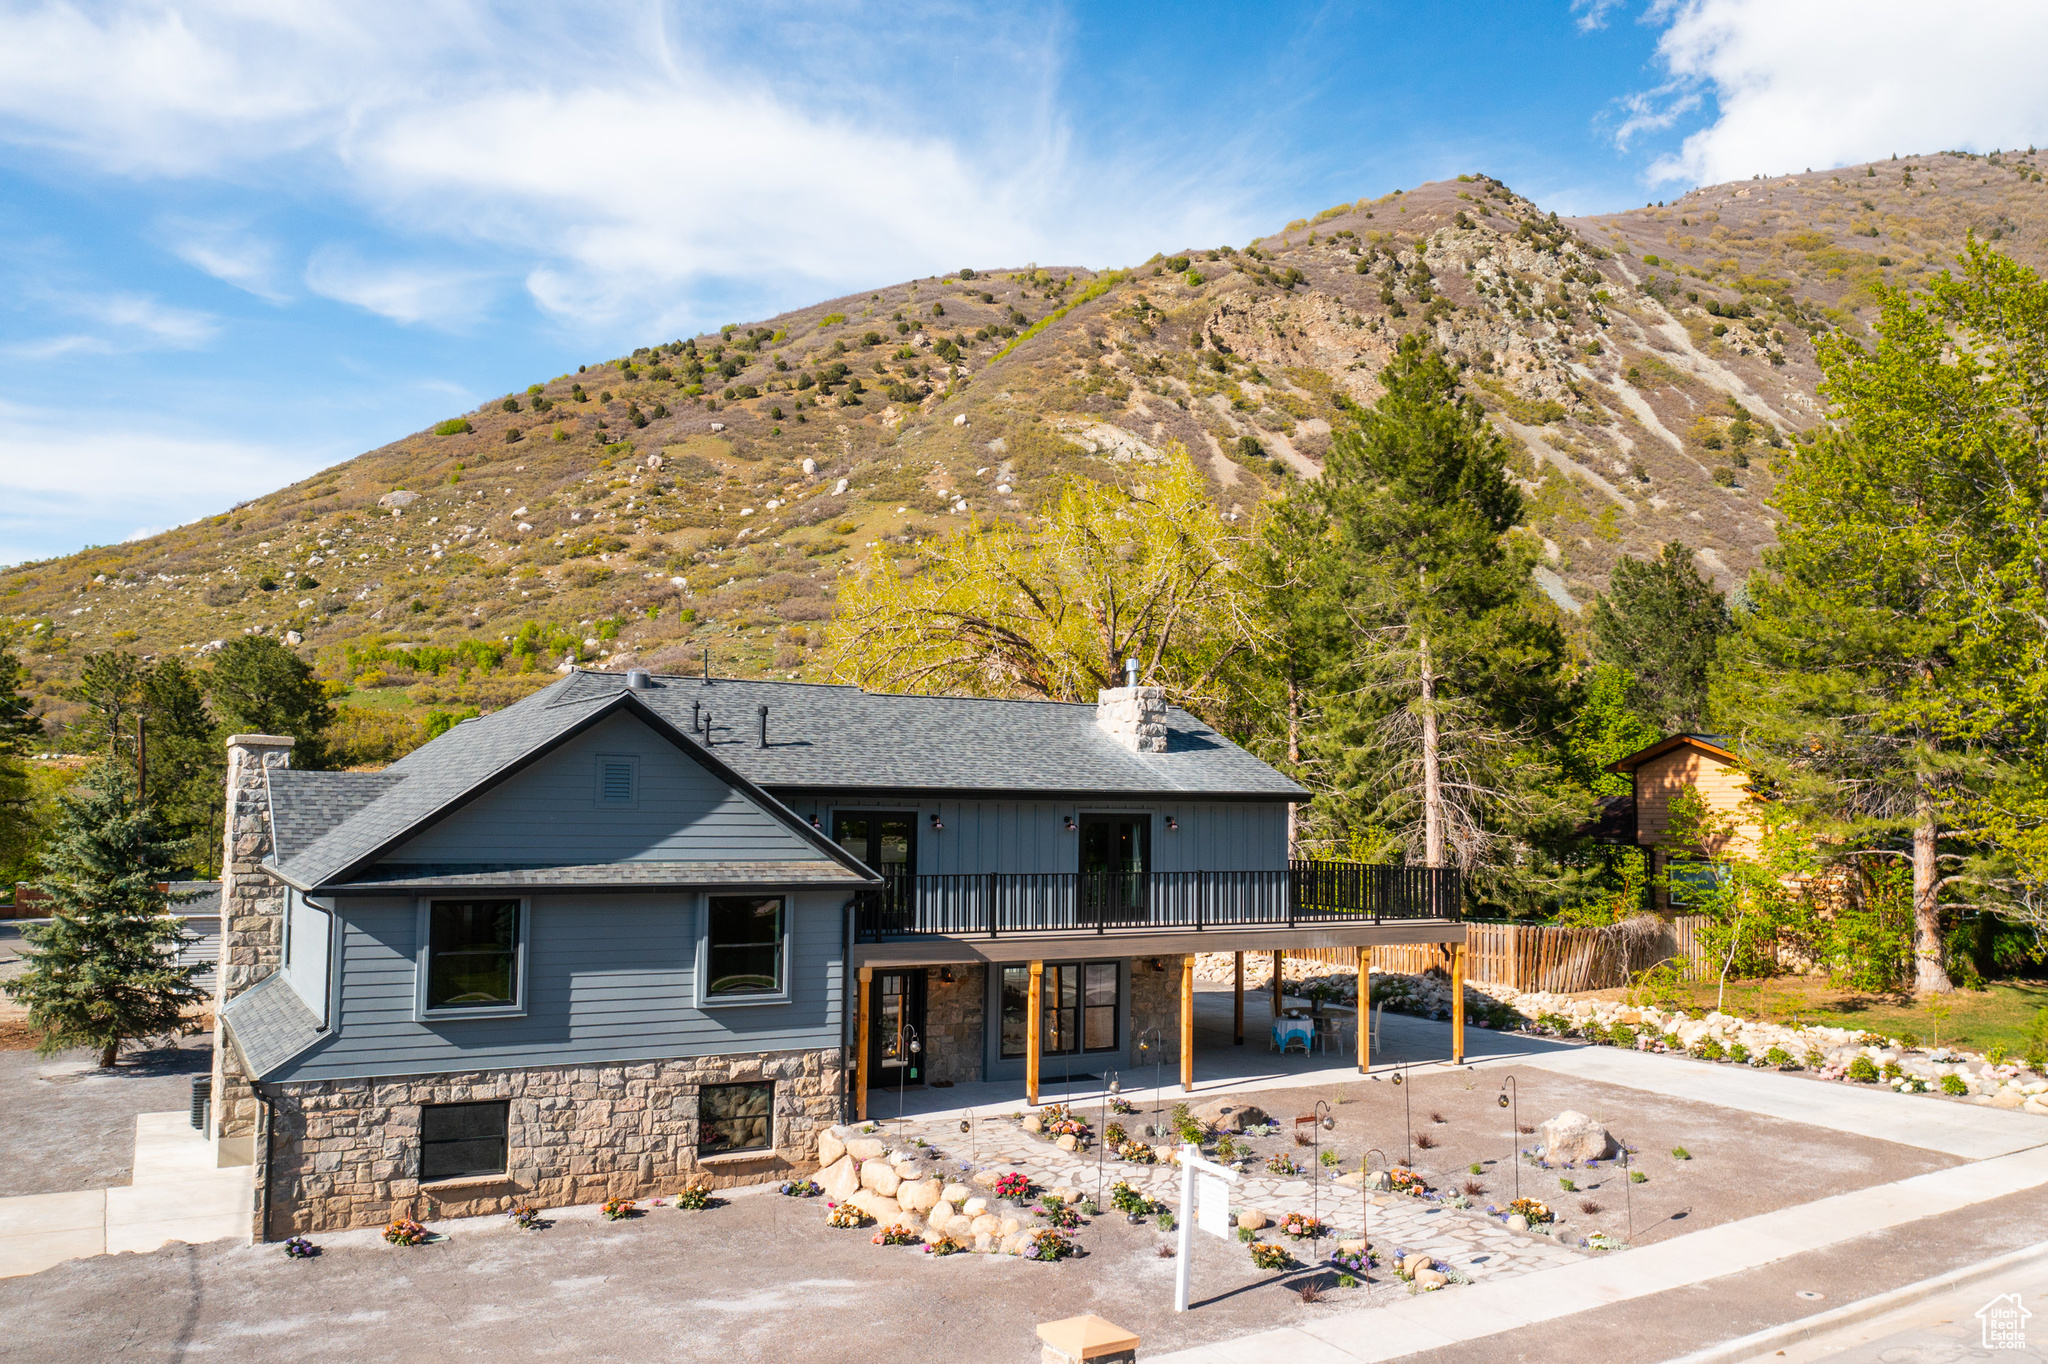
Active
$749,900
4
bds
|
3
ba
|
2,414
sqft
|
built
1986
9688 S 1700 E, Sandy, UT 84092
$-1,875
Cash flow
-13.0%
Cash-on-Cash Return
2.7%
Cap rate
0.4%
Rent to Value Ratio
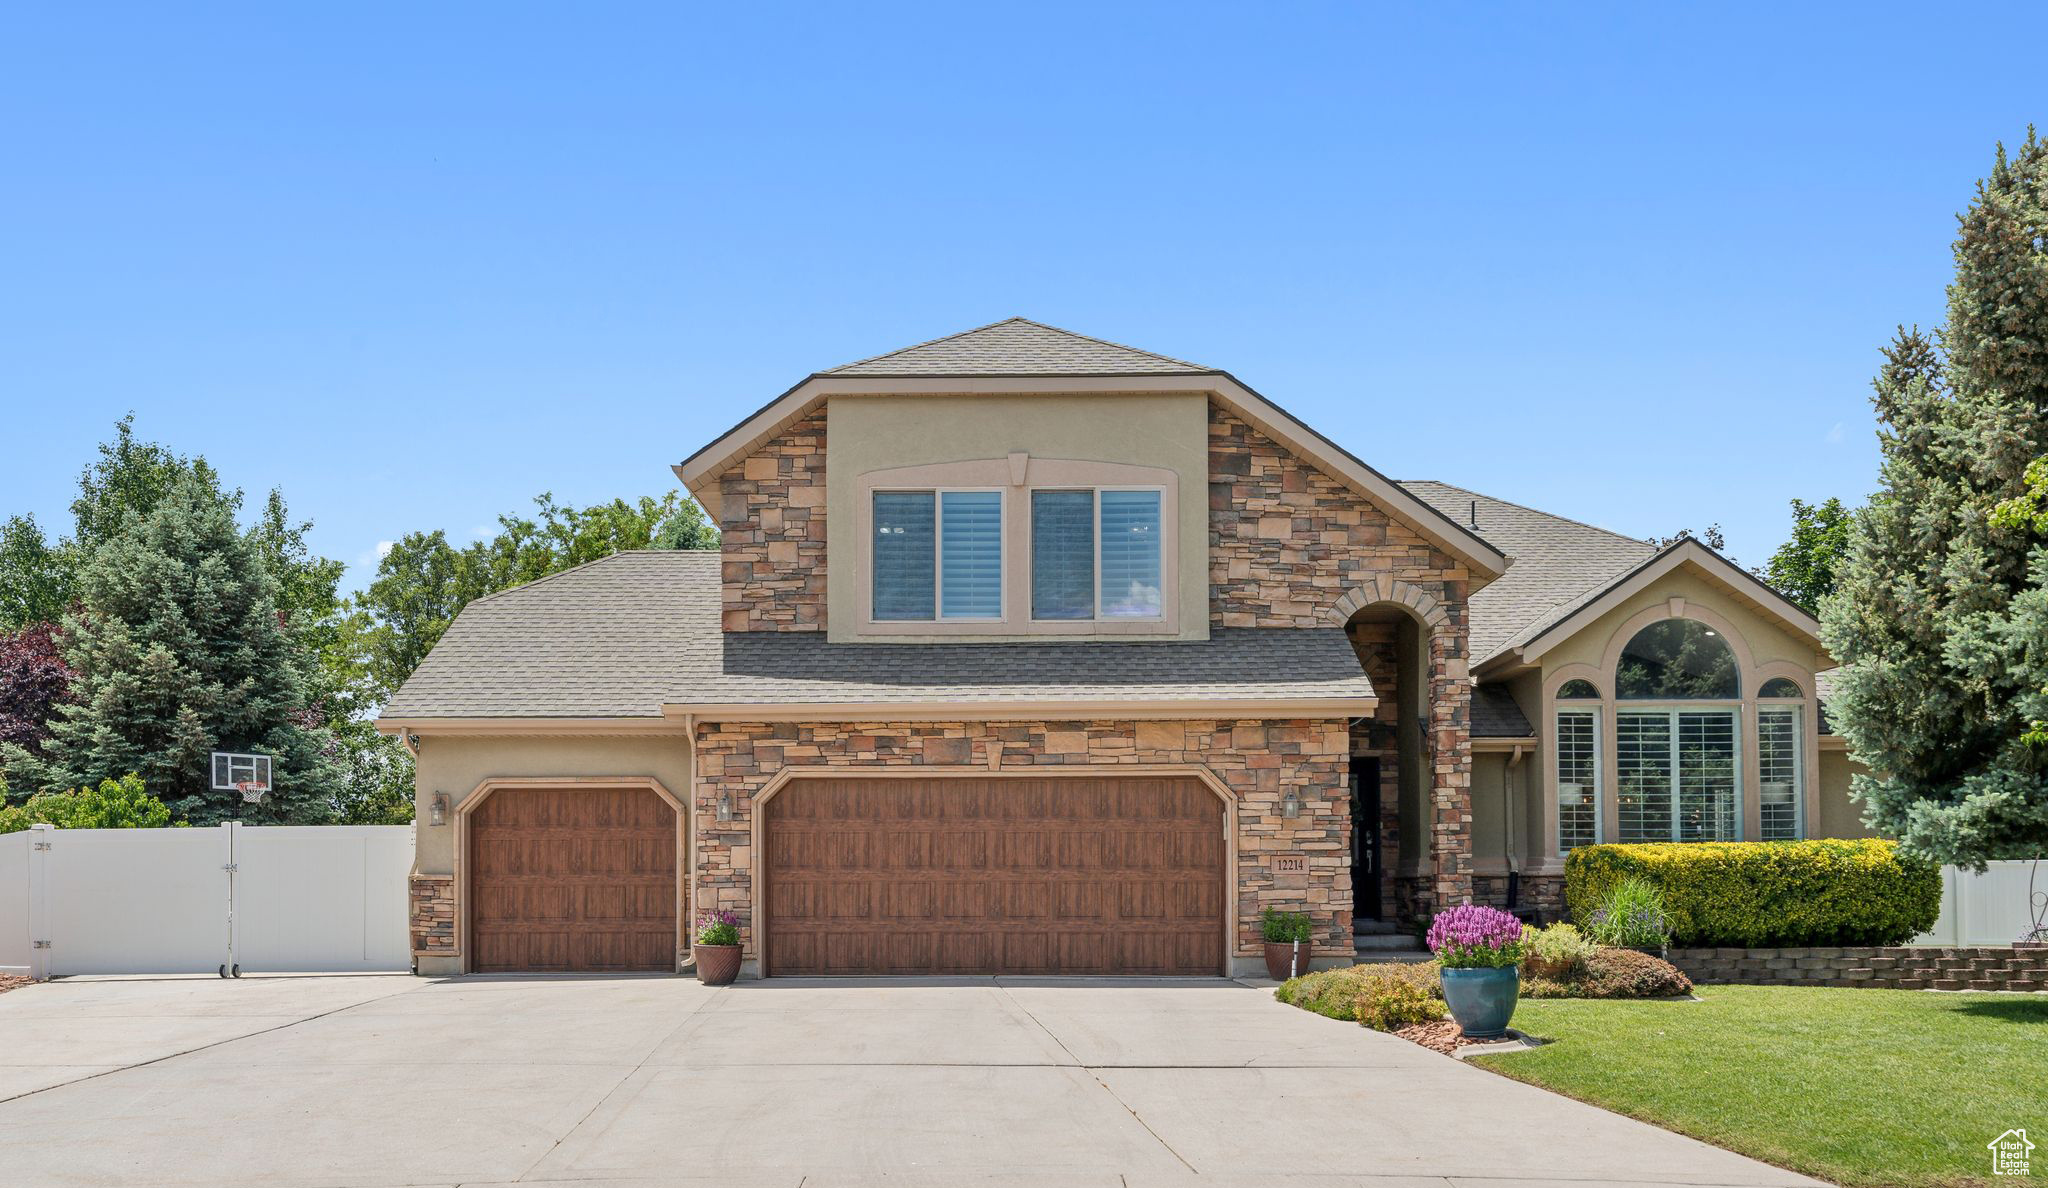
Active
$1,150,000
6
bds
|
4
ba
|
3,620
sqft
|
built
1991
12214 S Hidden Valley Rd, Sandy, UT 84092
$-2,402
Cash flow
-10.9%
Cash-on-Cash Return
3.2%
Cap rate
0.4%
Rent to Value Ratio
Active
$675,000
4
bds
|
3
ba
|
1,754
sqft
|
built
1972
8485 S 1575 E, Sandy, UT 84093
$-1,066
Cash flow
-8.2%
Cash-on-Cash Return
3.8%
Cap rate
0.5%
Rent to Value Ratio
Active
$949,000
6
bds
|
3
ba
|
3,958
sqft
|
built
1986
10273 S Flanders Rd, Sandy, UT 84092
$-2,977
Cash flow
-16.4%
Cash-on-Cash Return
1.9%
Cap rate
0.3%
Rent to Value Ratio
Active
$1,499,900
6
bds
|
4
ba
|
4,875
sqft
|
built
1994
8697 S Willow Green Cir, Sandy, UT 84093
$-4,847
Cash flow
-16.9%
Cash-on-Cash Return
1.8%
Cap rate
0.3%
Rent to Value Ratio
Active
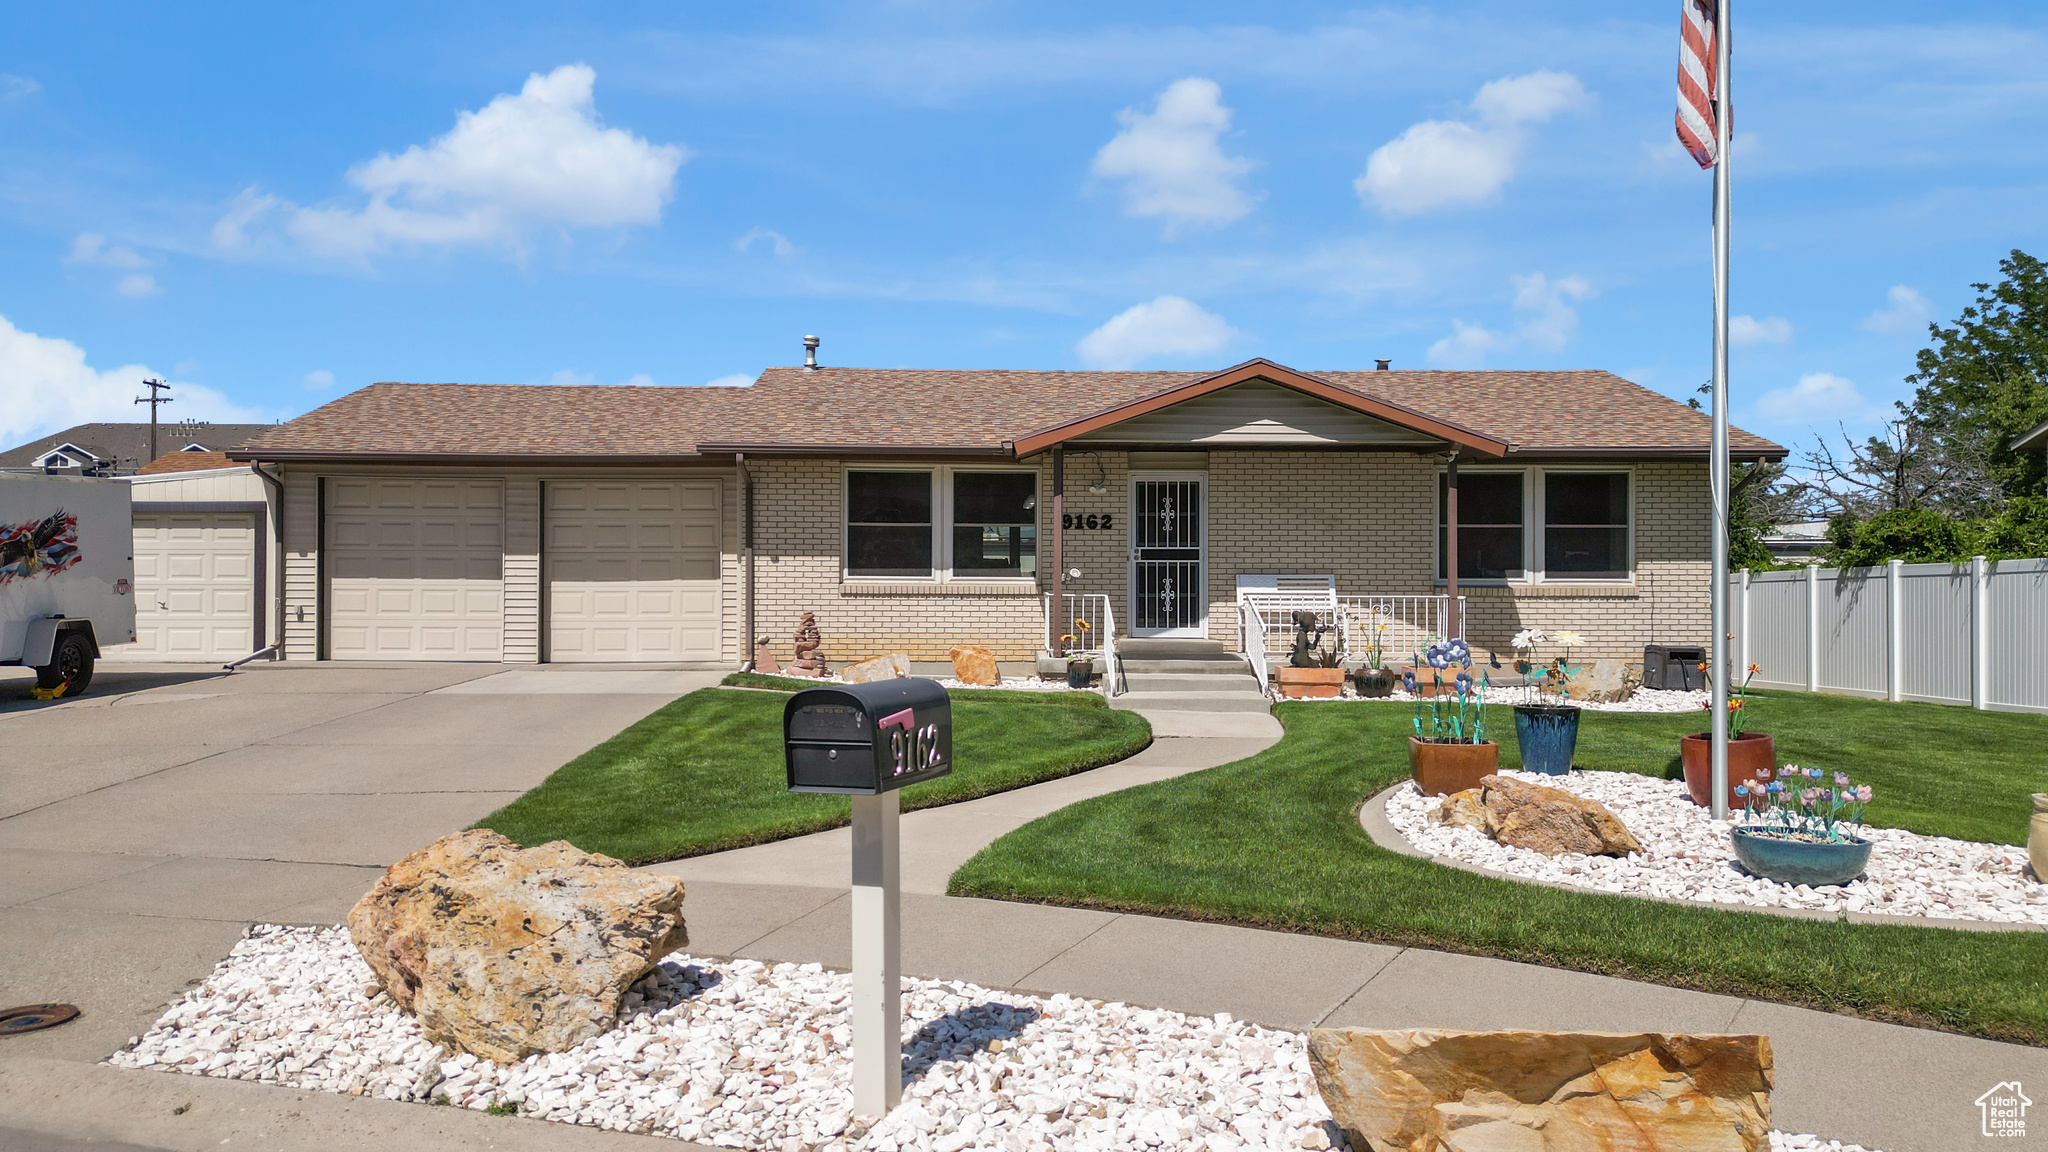
$599,990
3
bds
|
2
ba
|
2,240
sqft
|
built
1976
9162 S Pebble Glen Cir, Sandy, UT 84094
$-1,959
Cash flow
-17.0%
Cash-on-Cash Return
1.8%
Cap rate
0.3%
Rent to Value Ratio
Pending
$2,950,000
5
bds
|
6
ba
|
7,087
sqft
|
built
1976
3 Dawn Hill Dr, Sandy, UT 84092
$-11,365
Cash flow
-20.1%
Cash-on-Cash Return
1.1%
Cap rate
0.2%
Rent to Value Ratio
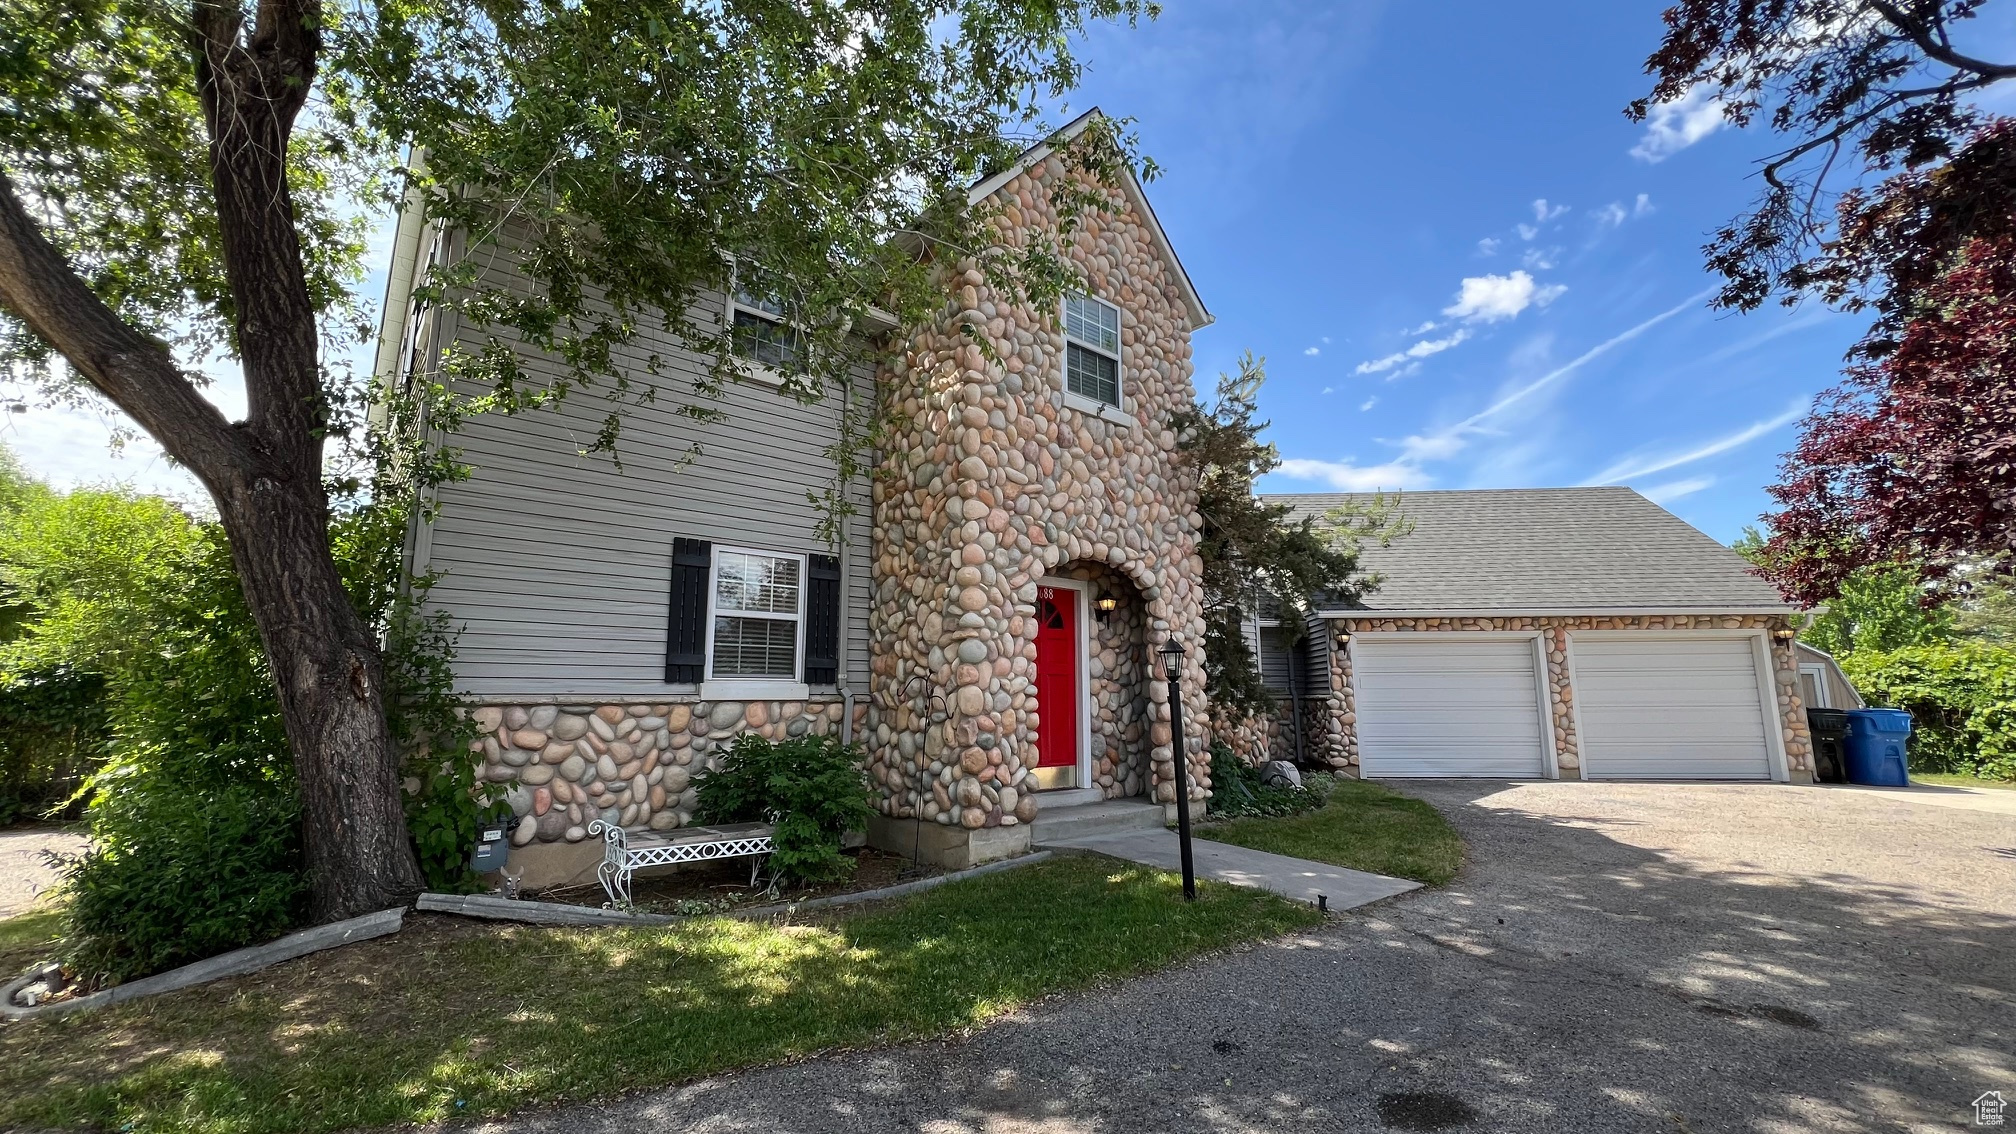
Active
$525,000
3
bds
|
4
ba
|
1,867
sqft
|
built
1998
7825 S Spruce Tree Ln, Sandy, UT 84094
$-1,608
Cash flow
-16.0%
Cash-on-Cash Return
2.0%
Cap rate
0.3%
Rent to Value Ratio