Sandy, UT Investment Properties for Sale
Browse homes for sale and investment properties in Sandy, UT. Refine your search by price, property type, or more.
Best cash flowing properties in Sandy, UT

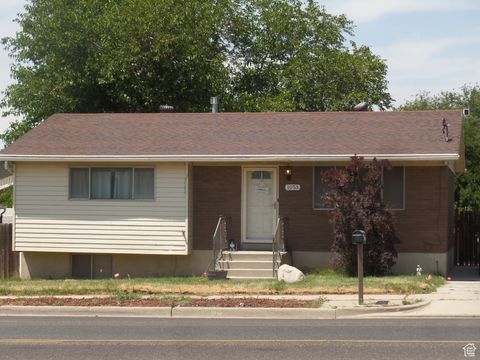
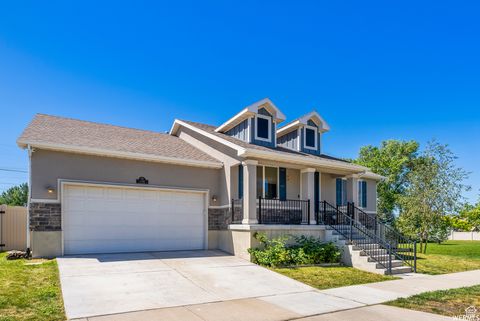
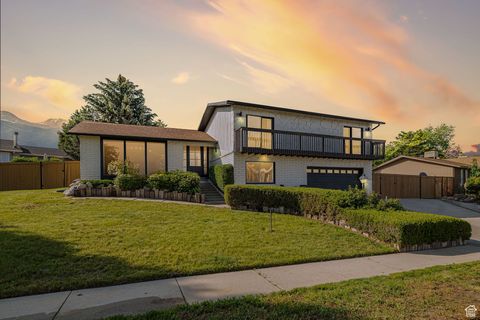
Active
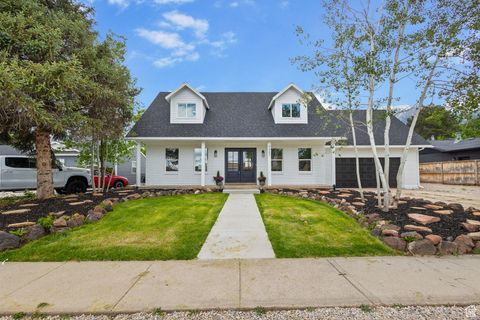
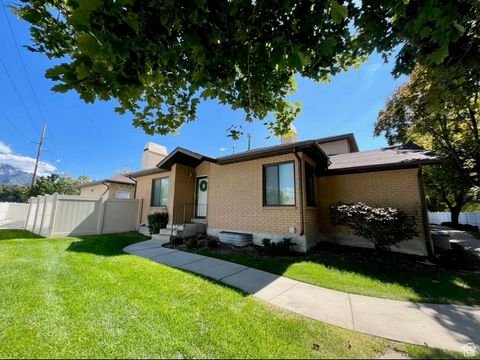
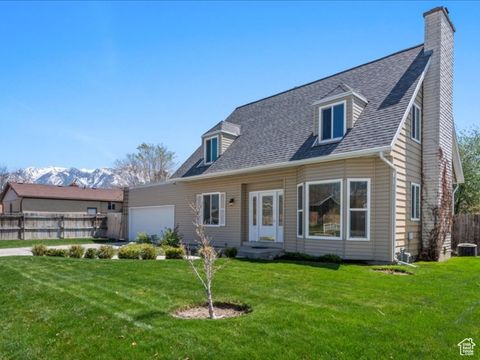
$305,000
2
bds
|
2
ba
|
949
sqft
|
built
1983
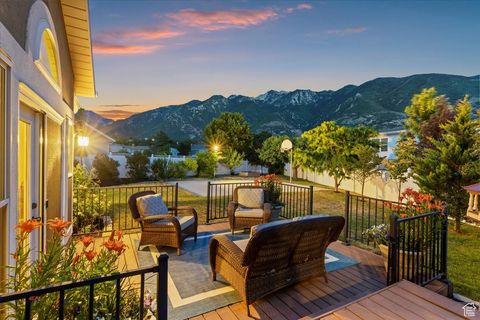
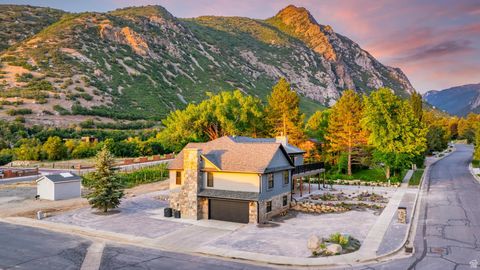
662 W Jefferson Cv, Sandy, UT 84070
$-716
Cash flow
-12.2%
Cash-on-Cash Return
2.9%
Cap rate
0.5%
Rent to Value Ratio
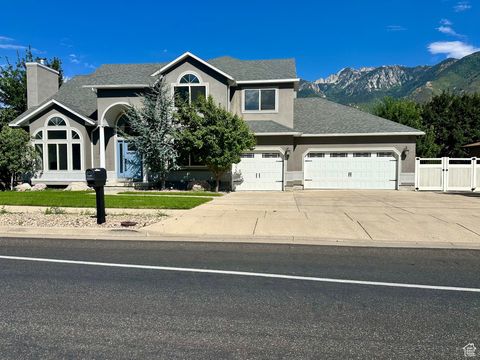
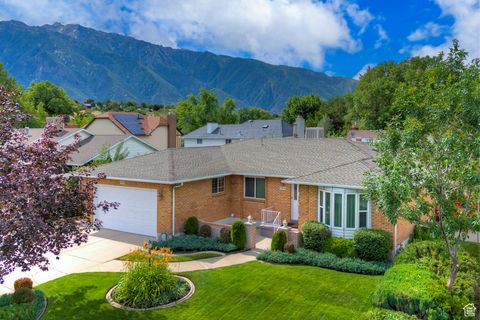
Active
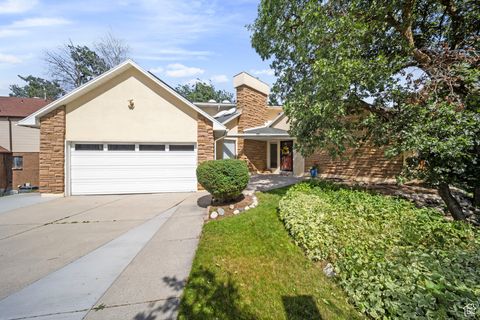
$465,000
3
bds
|
2
ba
|
1,932
sqft
|
built
1972
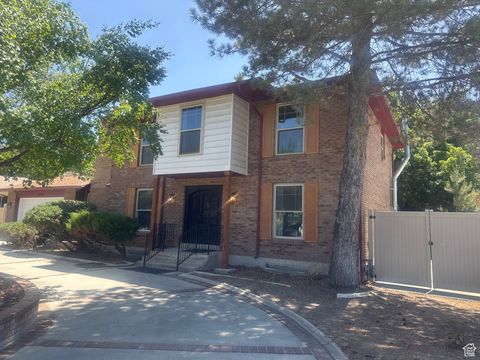
1053 E 10600 S, Sandy, UT 84094
$-850
Cash flow
-9.5%
Cash-on-Cash Return
3.5%
Cap rate
0.5%
Rent to Value Ratio
84 out of 197 properties for sale in Sandy, UT
Limited Results Shown
Create a free account, or log in to reveal all property listings and enjoy the complete experience.
Active
$999,900
8
bds
|
4
ba
|
5,438
sqft
|
built
1994
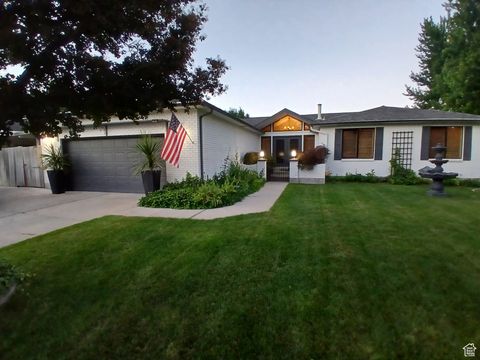
11679 S 1700 E, Sandy, UT 84092
$-1,071
Cash flow
-5.6%
Cash-on-Cash Return
4.4%
Cap rate
0.6%
Rent to Value Ratio
Active
$829,900
5
bds
|
4
ba
|
4,146
sqft
|
built
1983
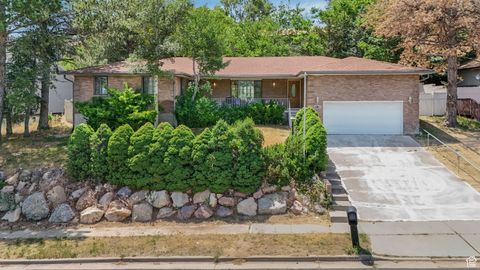
9039 S 1660 E, Sandy, UT 84093
$-2,027
Cash flow
-12.7%
Cash-on-Cash Return
2.7%
Cap rate
0.4%
Rent to Value Ratio
Active
$625,000
4
bds
|
2
ba
|
2,004
sqft
|
built
1973
8731 S Gladiator Way, Sandy, UT 84094
$-2,052
Cash flow
-17.1%
Cash-on-Cash Return
1.7%
Cap rate
0.3%
Rent to Value Ratio
Active
$927,000
5
bds
|
4
ba
|
2,920
sqft
|
built
1977
9957 S 2270 E, Sandy, UT 84092
$-2,845
Cash flow
-16.0%
Cash-on-Cash Return
2.0%
Cap rate
0.3%
Rent to Value Ratio
Active
$415,000
3
bds
|
3
ba
|
1,320
sqft
|
built
2008
93 E Calbourne Ln, Sandy, UT 84070
$-1,006
Cash flow
-12.6%
Cash-on-Cash Return
2.8%
Cap rate
0.5%
Rent to Value Ratio
Active
$1,275,000
3
bds
|
3
ba
|
3,537
sqft
|
built
1979
20 Northridge Way, Sandy, UT 84092
$-4,002
Cash flow
-16.4%
Cash-on-Cash Return
1.9%
Cap rate
0.3%
Rent to Value Ratio
Active
$695,000
5
bds
|
4
ba
|
3,794
sqft
|
built
1974
1735 E Julho St, Sandy, UT 84093
$-1,742
Cash flow
-13.1%
Cash-on-Cash Return
2.7%
Cap rate
0.4%
Rent to Value Ratio
Active
$629,500
4
bds
|
5
ba
|
3,037
sqft
|
built
2012
178 E Flicker Dr, Sandy, UT 84070
$-1,039
Cash flow
-8.6%
Cash-on-Cash Return
3.7%
Cap rate
0.5%
Rent to Value Ratio
Active
$695,000
6
bds
|
3
ba
|
3,480
sqft
|
built
1984
1814 E 9800 S, Sandy, UT 84092
$-1,120
Cash flow
-8.4%
Cash-on-Cash Return
3.7%
Cap rate
0.5%
Rent to Value Ratio
Active
$600,000
4
bds
|
3
ba
|
2,520
sqft
|
built
1997
841 E 8600 S, Sandy, UT 84094
$-1,829
Cash flow
-15.9%
Cash-on-Cash Return
2.0%
Cap rate
0.3%
Rent to Value Ratio
Active
$665,000
3
bds
|
3
ba
|
1,860
sqft
|
built
1983
1718 E Faunsdale Dr, Sandy, UT 84092
$-1,457
Cash flow
-11.4%
Cash-on-Cash Return
3.0%
Cap rate
0.4%
Rent to Value Ratio
Active
$1,100,000
5
bds
|
4
ba
|
3,250
sqft
|
built
1973
2616 E Grandview Dr, Sandy, UT 84092
$-1,658
Cash flow
-7.9%
Cash-on-Cash Return
3.9%
Cap rate
0.5%
Rent to Value Ratio

Active
$599,900
3
bds
|
4
ba
|
2,209
sqft
|
built
2019
10452 S Sage Canal Way, Sandy, UT 84070
$-1,367
Cash flow
-11.9%
Cash-on-Cash Return
2.9%
Cap rate
0.5%
Rent to Value Ratio
Active
$2,150,000
5
bds
|
5
ba
|
7,208
sqft
|
built
1988
2058 E Oak Manor Dr, Sandy, UT 84092
$-8,004
Cash flow
-19.4%
Cash-on-Cash Return
1.2%
Cap rate
0.2%
Rent to Value Ratio
Active
$849,900
3
bds
|
3
ba
|
2,910
sqft
|
built
2014
10912 S Hiddenwood Dr, Sandy, UT 84092
$-2,436
Cash flow
-15.0%
Cash-on-Cash Return
2.2%
Cap rate
0.4%
Rent to Value Ratio
Active
$550,000
5
bds
|
3
ba
|
1,955
sqft
|
built
1992
9891 S Cobalt Ln, Sandy, UT 84094
$-1,673
Cash flow
-15.9%
Cash-on-Cash Return
2.0%
Cap rate
0.3%
Rent to Value Ratio
Active
$489,000
3
bds
|
3
ba
|
2,024
sqft
|
built
1987
775 E Autumn Field Dr, Sandy, UT 84094
$-1,264
Cash flow
-13.5%
Cash-on-Cash Return
2.6%
Cap rate
0.4%
Rent to Value Ratio
Active
$840,000
5
bds
|
5
ba
|
3,952
sqft
|
built
1980
8463 S Jackson Hole Dr, Sandy, UT 84093
$-1,599
Cash flow
-9.9%
Cash-on-Cash Return
3.4%
Cap rate
0.5%
Rent to Value Ratio
Active
$2,000,000
5
bds
|
5
ba
|
4,240
sqft
|
built
1974
3385 E Deer Hollow Cir, Sandy, UT 84092
$-6,031
Cash flow
-15.7%
Cash-on-Cash Return
2.1%
Cap rate
0.3%
Rent to Value Ratio
Active
$630,000
4
bds
|
3
ba
|
2,960
sqft
|
built
1997
798 E Spruce Tree Ln, Sandy, UT 84094
$-1,582
Cash flow
-13.1%
Cash-on-Cash Return
2.7%
Cap rate
0.4%
Rent to Value Ratio
Active
$999,000
4
bds
|
3
ba
|
3,514
sqft
|
built
1994
11571 S Lexington Hills Cir, Sandy, UT 84092
$-2,869
Cash flow
-15.0%
Cash-on-Cash Return
2.2%
Cap rate
0.3%
Rent to Value Ratio
Active
$869,000
4
bds
|
4
ba
|
3,288
sqft
|
built
1976
2650 E Willow Wick Dr, Sandy, UT 84093
$-2,273
Cash flow
-13.6%
Cash-on-Cash Return
2.5%
Cap rate
0.4%
Rent to Value Ratio
Active
$839,900
4
bds
|
3
ba
|
3,664
sqft
|
built
1983
1584 E Petunia Way, Sandy, UT 84092
$-2,496
Cash flow
-15.5%
Cash-on-Cash Return
2.1%
Cap rate
0.3%
Rent to Value Ratio
Active
$700,000
5
bds
|
4
ba
|
4,044
sqft
|
built
1977
11778 S 1700 E, Sandy, UT 84092
$-1,109
Cash flow
-8.3%
Cash-on-Cash Return
3.8%
Cap rate
0.5%
Rent to Value Ratio
Active
$533,000
3
bds
|
2
ba
|
1,284
sqft
|
built
1976
282 E 9545 S, Sandy, UT 84070
$-1,483
Cash flow
-14.5%
Cash-on-Cash Return
2.3%
Cap rate
0.3%
Rent to Value Ratio
Active
$399,900
3
bds
|
3
ba
|
1,680
sqft
|
built
1979
1263 E Cottonwood Hills Dr, Sandy, UT 84094
$-968
Cash flow
-12.6%
Cash-on-Cash Return
2.8%
Cap rate
0.5%
Rent to Value Ratio
Active
$965,000
4
bds
|
3
ba
|
4,072
sqft
|
built
1979
2345 E High Mountain Dr, Sandy, UT 84092
$-1,903
Cash flow
-10.3%
Cash-on-Cash Return
3.3%
Cap rate
0.5%
Rent to Value Ratio
Active
$848,000
4
bds
|
3
ba
|
4,004
sqft
|
built
1993
1222 E Big Pine Cir, Sandy, UT 84094
$-2,178
Cash flow
-13.4%
Cash-on-Cash Return
2.6%
Cap rate
0.4%
Rent to Value Ratio

Active
$429,900
3
bds
|
3
ba
|
1,704
sqft
|
built
2003
9656 S Villa Springs Cv, Sandy, UT 84070
$-1,532
Cash flow
-18.6%
Cash-on-Cash Return
1.4%
Cap rate
0.3%
Rent to Value Ratio

Active
$2,999,000
6
bds
|
6
ba
|
8,164
sqft
|
built
2013
10280 S Dimple Dell Rd, Sandy, UT 84092
$-12,093
Cash flow
-21.0%
Cash-on-Cash Return
0.8%
Cap rate
0.1%
Rent to Value Ratio

Active
$1,575,000
5
bds
|
6
ba
|
6,569
sqft
|
built
1980
12144 S Mountain Shadow Rd, Sandy, UT 84092
$-4,858
Cash flow
-16.1%
Cash-on-Cash Return
2.0%
Cap rate
0.3%
Rent to Value Ratio

Active
$550,000
4
bds
|
2
ba
|
2,268
sqft
|
built
1964
628 E Wyandotte Ave, Sandy, UT 84070
$-999
Cash flow
-9.5%
Cash-on-Cash Return
3.5%
Cap rate
0.5%
Rent to Value Ratio

Active
$865,000
5
bds
|
4
ba
|
3,512
sqft
|
built
1989
10128 S 2460 E, Sandy, UT 84092
$-1,733
Cash flow
-10.5%
Cash-on-Cash Return
3.3%
Cap rate
0.5%
Rent to Value Ratio
Active
$2,000,000
5
bds
|
5
ba
|
4,299
sqft
|
built
1983
3787 E Little Cottonwood Ln, Sandy, UT 84092
$-7,549
Cash flow
-19.7%
Cash-on-Cash Return
1.1%
Cap rate
0.2%
Rent to Value Ratio

Active
$1,595,000
6
bds
|
5
ba
|
6,435
sqft
|
built
1993
11939 S Hidden Canyon Ln, Sandy, UT 84092
$-5,126
Cash flow
-16.8%
Cash-on-Cash Return
1.8%
Cap rate
0.3%
Rent to Value Ratio

Active
$654,600
4
bds
|
3
ba
|
1,754
sqft
|
built
1972
8485 S 1575 E, Sandy, UT 84093
$-970
Cash flow
-7.7%
Cash-on-Cash Return
3.9%
Cap rate
0.5%
Rent to Value Ratio

Active
$949,000
6
bds
|
3
ba
|
3,958
sqft
|
built
1986
10273 S Flanders Rd, Sandy, UT 84092
$-2,977
Cash flow
-16.4%
Cash-on-Cash Return
1.9%
Cap rate
0.3%
Rent to Value Ratio
Active
$2,300,000
4
bds
|
5
ba
|
6,075
sqft
|
built
2005
3327 E Wasatch Pines Ln, Sandy, UT 84092
$-8,320
Cash flow
-18.9%
Cash-on-Cash Return
1.3%
Cap rate
0.2%
Rent to Value Ratio