Sanford, NC Investment Properties for Sale
Browse homes for sale and investment properties in Sanford, NC. Refine your search by price, property type, or more.
Best cash flowing properties in Sanford, NC

Active
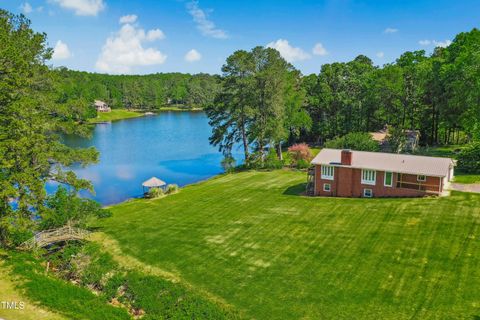
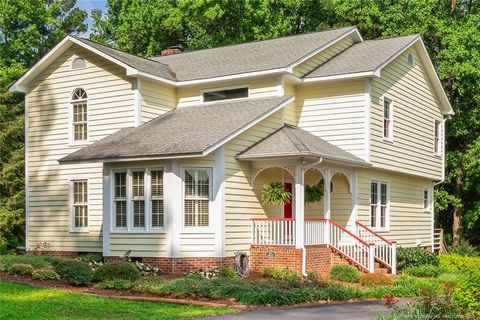
$300,000
3
bds
|
2
ba
|
2,712
sqft
|
built
1971
1104 Oldham Lake Rd, Sanford, NC 27330
$92
Cash flow
1.6%
Cash-on-Cash Return
6.0%
Cap rate
0.7%
Rent to Value Ratio

Active
$194,900
3
bds
|
1
ba
|
1,112
sqft
|
built
1948
2327 Dewitt St, Sanford, NC 27330
$44
Cash flow
1.2%
Cash-on-Cash Return
5.9%
Cap rate
0.7%
Rent to Value Ratio
35 out of 151 properties for sale in Sanford, NC
Limited Results Shown
Create a free account, or log in to reveal all property listings and enjoy the complete experience.
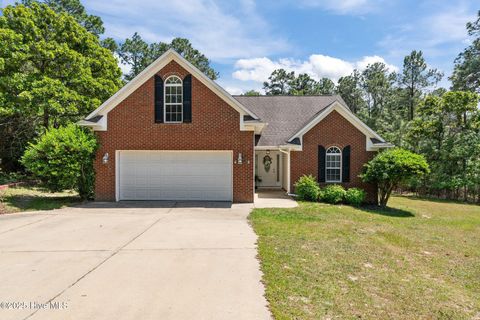
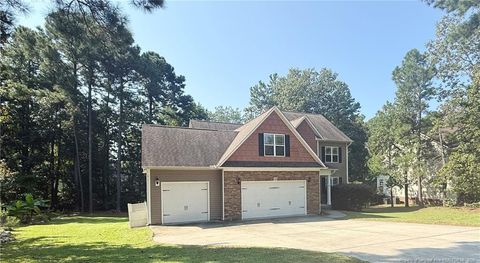
Active
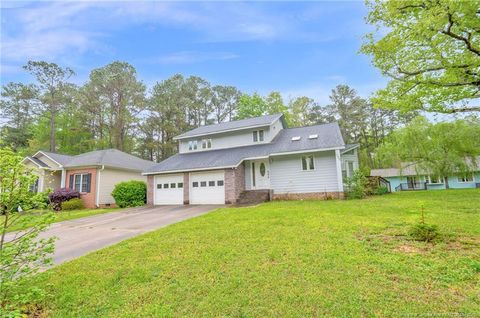
$315,000
3
bds
|
2
ba
|
1,861
sqft
|
built
2005
481 Clearwater Hbr, Sanford, NC 27332
$-481
Cash flow
-8.0%
Cash-on-Cash Return
3.8%
Cap rate
0.6%
Rent to Value Ratio
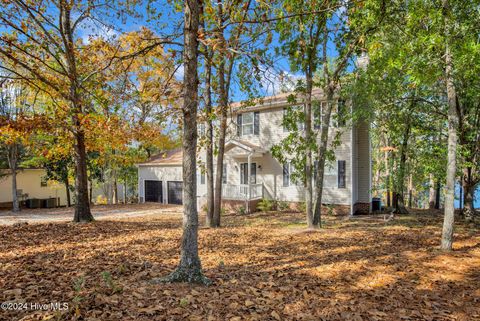
Active
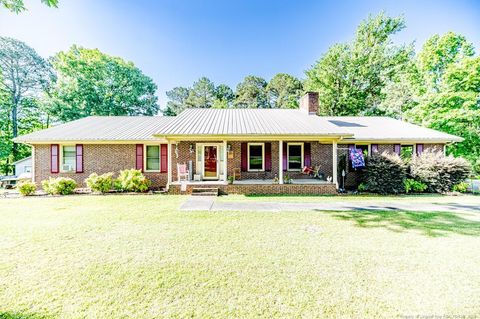
$400,000
4
bds
|
3
ba
|
2,230
sqft
|
built
1995
85 Pinewinds Dr, Sanford, NC 27332
$-422
Cash flow
-5.5%
Cash-on-Cash Return
4.4%
Cap rate
0.6%
Rent to Value Ratio
Active
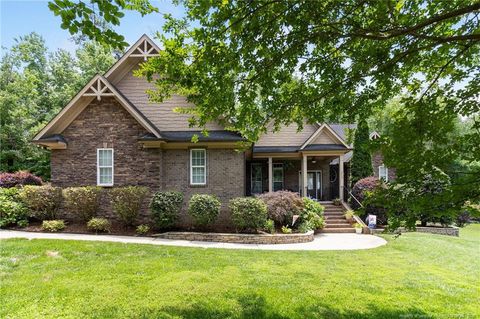
$374,000
3
bds
|
3
ba
|
2,465
sqft
|
built
2006
3270 Carolina Way, Sanford, NC 27332
$-465
Cash flow
-6.5%
Cash-on-Cash Return
4.2%
Cap rate
0.5%
Rent to Value Ratio

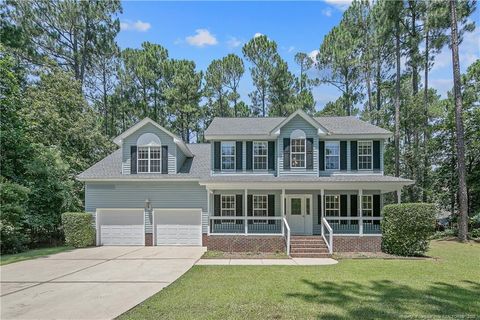
Active
$336,500
4
bds
|
3
ba
|
2,048
sqft
|
built
1995
509 Olde Towne Dr, Sanford, NC 27330
$-245
Cash flow
-3.8%
Cash-on-Cash Return
4.8%
Cap rate
0.6%
Rent to Value Ratio

Active
$449,000
5
bds
|
3
ba
|
2,964
sqft
|
built
2024
110 Hickory Grove Dr, Sanford, NC 27330
$-953
Cash flow
-11.1%
Cash-on-Cash Return
3.1%
Cap rate
0.4%
Rent to Value Ratio
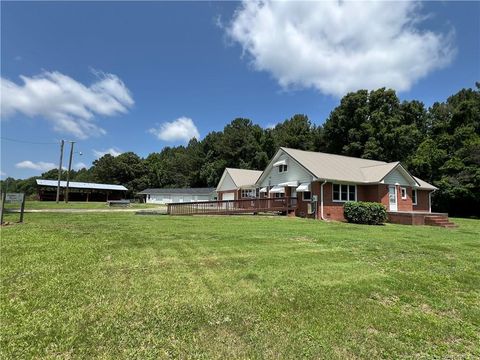
Active
$510,000
3
bds
|
3
ba
|
2,840
sqft
|
built
1957
472 Walter Bright Rd, Sanford, NC 27330
$-481
Cash flow
-4.9%
Cash-on-Cash Return
4.5%
Cap rate
0.5%
Rent to Value Ratio
Active
$589,000
4
bds
|
4
ba
|
3,225
sqft
|
built
2015
56 Indian Trl, Sanford, NC 27332
$-919
Cash flow
-8.1%
Cash-on-Cash Return
3.8%
Cap rate
0.5%
Rent to Value Ratio
Active
$450,000
3
bds
|
3
ba
|
1,989
sqft
|
built
1975
1415 Clearwater Dr, Sanford, NC 27330
$-762
Cash flow
-8.8%
Cash-on-Cash Return
3.6%
Cap rate
0.5%
Rent to Value Ratio

Active
$284,900
3
bds
|
2
ba
|
1,452
sqft
|
built
1997
2142 Philadelphia St, Sanford, NC 27332
$-165
Cash flow
-3.0%
Cash-on-Cash Return
5.0%
Cap rate
0.6%
Rent to Value Ratio
Active
$325,000
3
bds
|
3
ba
|
2,374
sqft
|
built
2011
3245 Bristol St, Sanford, NC 27332
$-9
Cash flow
-0.1%
Cash-on-Cash Return
5.6%
Cap rate
0.7%
Rent to Value Ratio
Active
$855,000
5
bds
|
4
ba
|
4,010
sqft
|
built
1980
3113 Chipping Wedge, Sanford, NC 27332
$-1,935
Cash flow
-11.8%
Cash-on-Cash Return
3.0%
Cap rate
0.4%
Rent to Value Ratio
Active
$475,000
4
bds
|
3
ba
|
2,500
sqft
|
built
1987
1718 Carthage St, Sanford, NC 27330
$-868
Cash flow
-9.5%
Cash-on-Cash Return
3.5%
Cap rate
0.4%
Rent to Value Ratio

Active
$357,000
3
bds
|
2
ba
|
2,499
sqft
|
built
1939
210 Monroe Ave, Sanford, NC 27330
$-516
Cash flow
-7.5%
Cash-on-Cash Return
3.9%
Cap rate
0.5%
Rent to Value Ratio

Active
$489,900
4
bds
|
3
ba
|
2,243
sqft
|
built
1979
1381 Illinois Ave, Sanford, NC 27332
$-794
Cash flow
-8.5%
Cash-on-Cash Return
3.7%
Cap rate
0.5%
Rent to Value Ratio
Active
$320,000
4
bds
|
3
ba
|
1,991
sqft
|
built
1993
1068 Windrace Trl, Sanford, NC 27332
$-230
Cash flow
-3.8%
Cash-on-Cash Return
4.8%
Cap rate
0.6%
Rent to Value Ratio
Active
$364,900
3
bds
|
2
ba
|
2,025
sqft
|
built
1983
3897 Olivia Rd, Sanford, NC 27332
$-347
Cash flow
-5.0%
Cash-on-Cash Return
4.5%
Cap rate
0.5%
Rent to Value Ratio
Active
$639,900
4
bds
|
4
ba
|
3,329
sqft
|
built
2007
3027 Carrington Ln, Sanford, NC 27330
$-857
Cash flow
-7.0%
Cash-on-Cash Return
4.1%
Cap rate
0.5%
Rent to Value Ratio
Active
$462,000
4
bds
|
3
ba
|
2,885
sqft
|
built
2013
133 Lotus Ln, Sanford, NC 27332
$-674
Cash flow
-7.6%
Cash-on-Cash Return
3.9%
Cap rate
0.5%
Rent to Value Ratio

Active
$319,900
3
bds
|
2
ba
|
1,300
sqft
|
built
1990
5178 Goldfinch Turn, Sanford, NC 27332
$-478
Cash flow
-7.8%
Cash-on-Cash Return
3.9%
Cap rate
0.5%
Rent to Value Ratio

Active
$1,100,000
3
bds
|
4
ba
|
3,063
sqft
|
built
1998
5405 Carbonton Rd, Sanford, NC 27330
$-3,781
Cash flow
-17.9%
Cash-on-Cash Return
1.6%
Cap rate
0.2%
Rent to Value Ratio

Active
$310,000
3
bds
|
3
ba
|
2,144
sqft
|
built
1999
144 Vail Ct, Sanford, NC 27332
$-87
Cash flow
-1.5%
Cash-on-Cash Return
5.3%
Cap rate
0.6%
Rent to Value Ratio

Active
$280,000
3
bds
|
2
ba
|
1,884
sqft
|
built
1970
2400 Carbonton Rd, Sanford, NC 27330
$-268
Cash flow
-5.0%
Cash-on-Cash Return
4.5%
Cap rate
0.6%
Rent to Value Ratio
Active
$380,000
4
bds
|
3
ba
|
2,525
sqft
|
built
2007
45 Cutter Cir, Sanford, NC 27332
$-355
Cash flow
-4.9%
Cash-on-Cash Return
4.6%
Cap rate
0.6%
Rent to Value Ratio

Active
$399,000
3
bds
|
3
ba
|
2,832
sqft
|
built
1986
48 Indian Trl, Sanford, NC 27332
$-296
Cash flow
-3.9%
Cash-on-Cash Return
4.8%
Cap rate
0.6%
Rent to Value Ratio

Active
$280,000
3
bds
|
2
ba
|
1,217
sqft
|
built
1995
308 Brookfield Cir, Sanford, NC 27330
$-221
Cash flow
-4.1%
Cash-on-Cash Return
4.7%
Cap rate
0.6%
Rent to Value Ratio

Active
$439,000
3
bds
|
3
ba
|
2,033
sqft
|
built
1981
3120 Sandwedge, Sanford, NC 27332
$-793
Cash flow
-9.4%
Cash-on-Cash Return
3.5%
Cap rate
0.5%
Rent to Value Ratio
Active
$375,000
3
bds
|
2
ba
|
2,092
sqft
|
built
2009
1536 Louisiana Ln, Sanford, NC 27332
$-458
Cash flow
-6.4%
Cash-on-Cash Return
4.2%
Cap rate
0.5%
Rent to Value Ratio

Active
$475,000
3
bds
|
3
ba
|
2,323
sqft
|
built
1975
1116 Falling Strm, Sanford, NC 27332
$-389
Cash flow
-4.3%
Cash-on-Cash Return
4.7%
Cap rate
0.6%
Rent to Value Ratio
Active
$359,900
4
bds
|
2
ba
|
2,335
sqft
|
built
1973
220 Topside, Sanford, NC 27332
$-111
Cash flow
-1.6%
Cash-on-Cash Return
5.3%
Cap rate
0.7%
Rent to Value Ratio

Active
$287,500
3
bds
|
2
ba
|
1,749
sqft
|
built
2001
119 Pinevalley Ln, Sanford, NC 27332
$-119
Cash flow
-2.2%
Cash-on-Cash Return
5.2%
Cap rate
0.6%
Rent to Value Ratio
Active
$380,000
3
bds
|
3
ba
|
1,942
sqft
|
built
2005
1397 Colorado Trl, Sanford, NC 27332
$-274
Cash flow
-3.8%
Cash-on-Cash Return
4.8%
Cap rate
0.6%
Rent to Value Ratio
Active
$285,000
3
bds
|
3
ba
|
1,423
sqft
|
built
1999
126 Ribbon Oak Ct, Sanford, NC 27332
$-107
Cash flow
-2.0%
Cash-on-Cash Return
5.2%
Cap rate
0.6%
Rent to Value Ratio
Active
$355,000
3
bds
|
2
ba
|
1,888
sqft
|
built
2005
794 Cashmere Ct, Sanford, NC 27332
$-244
Cash flow
-3.6%
Cash-on-Cash Return
4.9%
Cap rate
0.6%
Rent to Value Ratio