Stacy, MN Investment Properties for Sale
Browse homes for sale and investment properties in Stacy, MN. Refine your search by price, property type, or more.
Best cash flowing properties in Stacy, MN
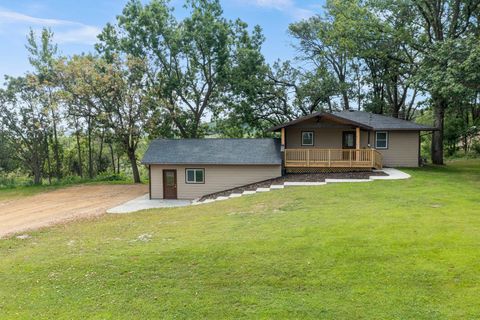
Active
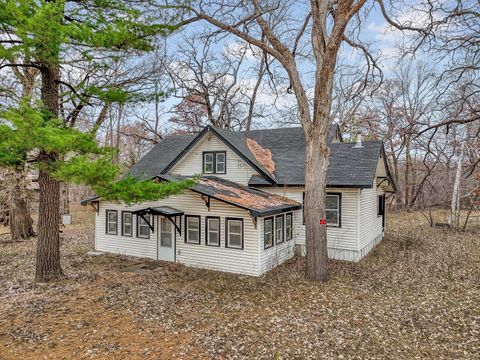
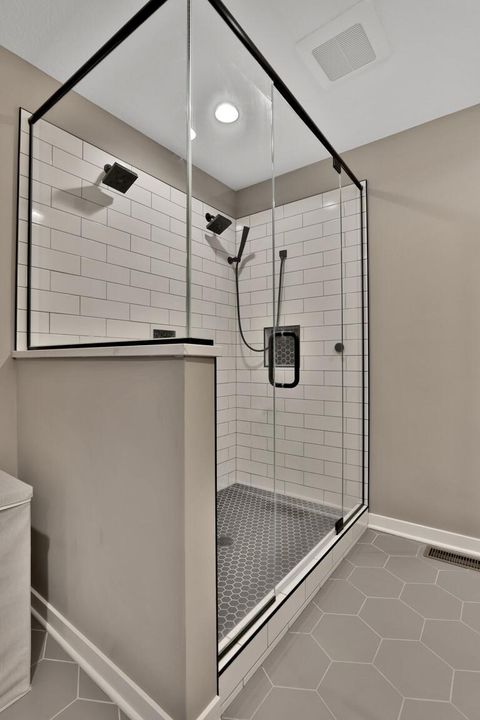
$185,000
2
bds
|
1
ba
|
1,080
sqft
|
built
1920
30780 Forest Blvd, Stacy, MN 55079
$461
Cash flow
13.0%
Cash-on-Cash Return
8.7%
Cap rate
1.2%
Rent to Value Ratio
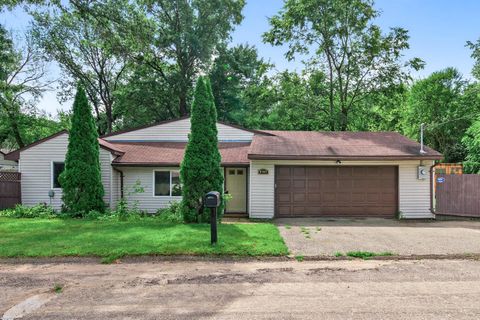
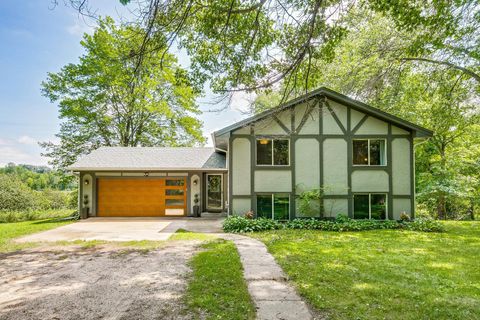
Active
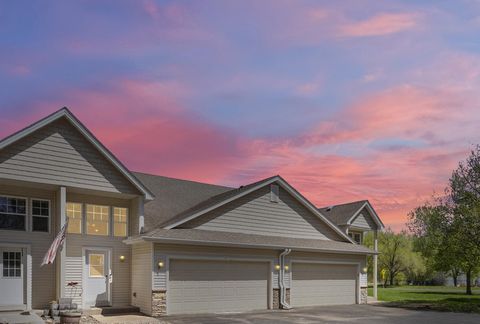
$249,900
2
bds
|
1
ba
|
768
sqft
|
built
1950
6964 230th Ave NE, Stacy, MN 55079
$-89
Cash flow
-1.9%
Cash-on-Cash Return
5.3%
Cap rate
0.7%
Rent to Value Ratio
16 out of 17 properties for sale in Stacy, MN
Limited Results Shown
Create a free account, or log in to reveal all property listings and enjoy the complete experience.
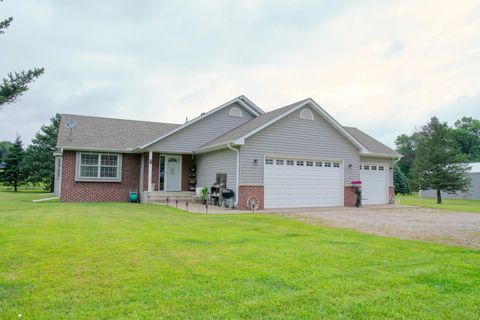
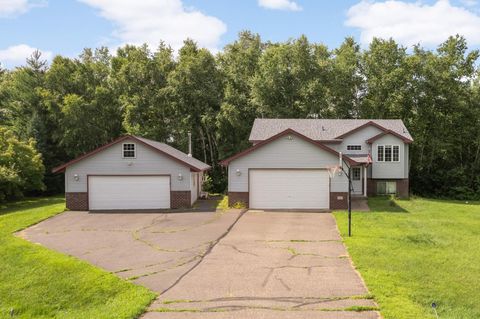
Active
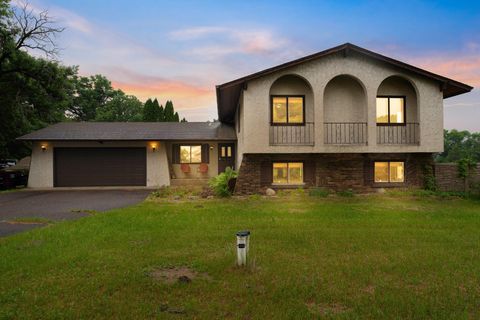
$449,900
4
bds
|
2
ba
|
1,977
sqft
|
built
2004
8109 217th Ave NE, Stacy, MN 55079
$-515
Cash flow
-6.0%
Cash-on-Cash Return
4.3%
Cap rate
0.6%
Rent to Value Ratio
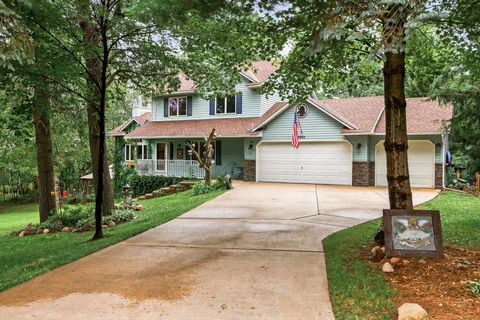
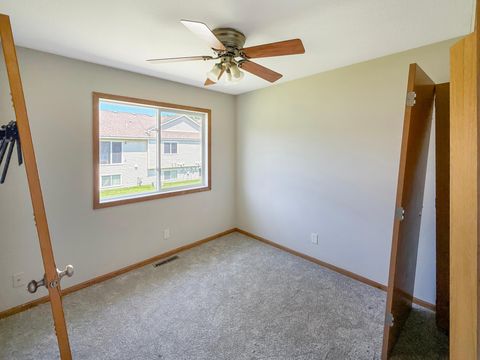
Active
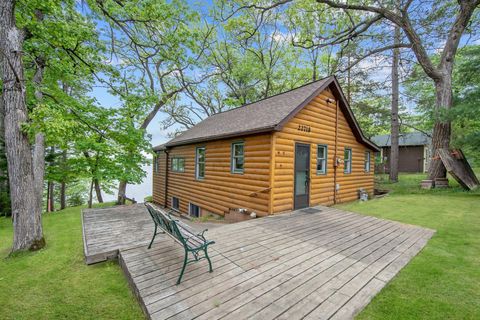
$500,000
4
bds
|
4
ba
|
2,686
sqft
|
built
1995
6901 232nd Ave NE, Stacy, MN 55079
$-697
Cash flow
-7.3%
Cash-on-Cash Return
4.0%
Cap rate
0.6%
Rent to Value Ratio
Active
$399,000
3
bds
|
2
ba
|
1,443
sqft
|
built
1961
6205 Stacy Trl, Stacy, MN 55079
$-693
Cash flow
-9.1%
Cash-on-Cash Return
3.6%
Cap rate
0.5%
Rent to Value Ratio
Active
$410,000
3
bds
|
2
ba
|
1,916
sqft
|
built
1978
32405 Elk Ct, Stacy, MN 55079
$-494
Cash flow
-6.3%
Cash-on-Cash Return
4.2%
Cap rate
0.6%
Rent to Value Ratio
Active
$418,900
4
bds
|
2
ba
|
1,784
sqft
|
built
1999
4985 Enchantment Ln, Stacy, MN 55079
$-378
Cash flow
-4.7%
Cash-on-Cash Return
4.6%
Cap rate
0.7%
Rent to Value Ratio
Active
$260,000
3
bds
|
2
ba
|
1,805
sqft
|
built
2004
5674 Sherman Oaks Rd, Stacy, MN 55079
$-321
Cash flow
-6.4%
Cash-on-Cash Return
4.2%
Cap rate
0.8%
Rent to Value Ratio
Active
$599,900
3
bds
|
2
ba
|
1,656
sqft
|
built
2023
23900 Taurus St, Stacy, MN 55079
$-1,071
Cash flow
-9.3%
Cash-on-Cash Return
3.5%
Cap rate
0.5%
Rent to Value Ratio
Active
$299,900
3
bds
|
2
ba
|
1,805
sqft
|
built
2004
5678 Sherman Oaks Rd, Stacy, MN 55079
$-650
Cash flow
-11.3%
Cash-on-Cash Return
3.1%
Cap rate
0.6%
Rent to Value Ratio
Active
$489,000
4
bds
|
2
ba
|
2,170
sqft
|
built
1977
7567 Lent Trl, Stacy, MN 55079
$-557
Cash flow
-5.9%
Cash-on-Cash Return
4.3%
Cap rate
0.6%
Rent to Value Ratio

Active
$944,750
5
bds
|
6
ba
|
7,716
sqft
|
built
1996
7884 341st St, Stacy, MN 55079
$-2,466
Cash flow
-13.6%
Cash-on-Cash Return
2.5%
Cap rate
0.4%
Rent to Value Ratio
Active
$390,000
2
bds
|
2
ba
|
1,122
sqft
|
built
1963
22718 E Martin Lake Dr NE, Stacy, MN 55079
$-421
Cash flow
-5.6%
Cash-on-Cash Return
4.4%
Cap rate
0.6%
Rent to Value Ratio

Active
$335,000
3
bds
|
1
ba
|
1,345
sqft
|
built
1925
5159 Fawn Lake Dr NE, Stacy, MN 55079
$-383
Cash flow
-6.0%
Cash-on-Cash Return
4.3%
Cap rate
0.6%
Rent to Value Ratio
Active
$450,000
4
bds
|
2
ba
|
2,638
sqft
|
built
1974
30145 Fir Trl, Stacy, MN 55079
$-265
Cash flow
-3.1%
Cash-on-Cash Return
5.0%
Cap rate
0.6%
Rent to Value Ratio
Active
$1,250,000
6
bds
|
5
ba
|
4,238
sqft
|
built
2005
24439 Typo Creek Dr NE, Stacy, MN 55079
$-1,983
Cash flow
-8.3%
Cash-on-Cash Return
3.8%
Cap rate
0.5%
Rent to Value Ratio