Sugar Land, TX Investment Properties for Sale
Browse homes for sale and investment properties in Sugar Land, TX. Refine your search by price, property type, or more.
Best cash flowing properties in Sugar Land, TX

Active
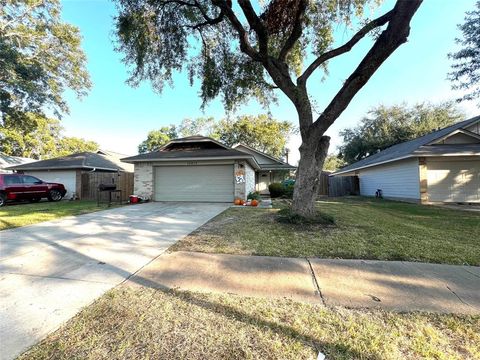
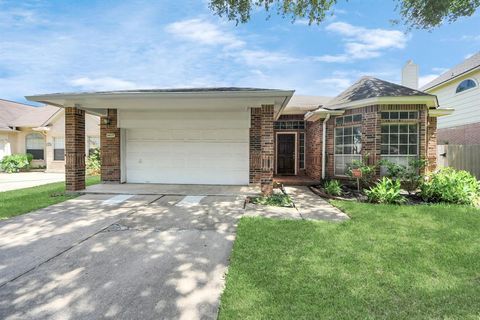
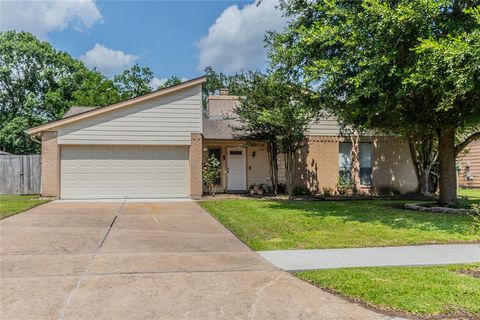
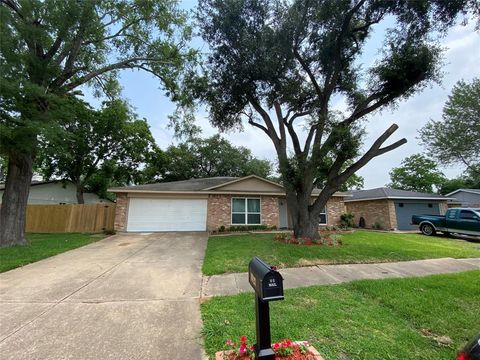
$377,900
4
bds
|
0
ba
|
2,556
sqft
|
built
1997
1030 Evandale Ln, Sugar Land, TX 77479
$-343
Cash flow
-4.7%
Cash-on-Cash Return
5.2%
Cap rate
0.7%
Rent to Value Ratio
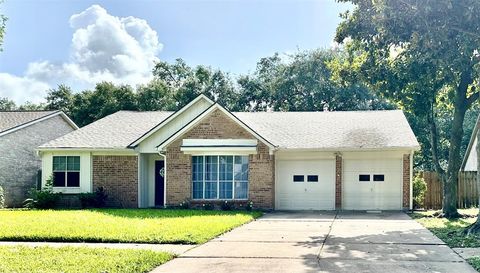
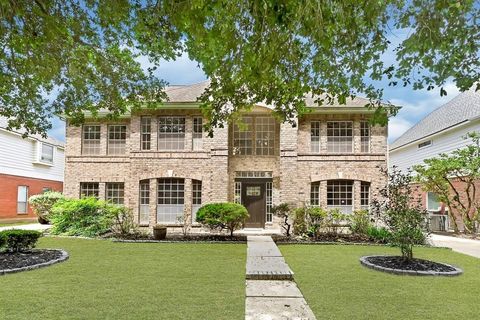
Active
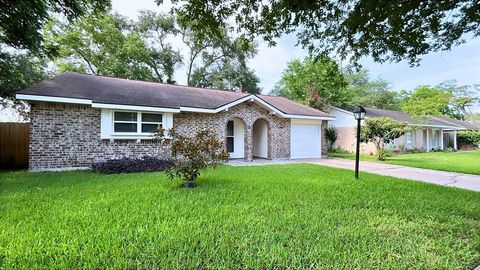
$255,000
3
bds
|
0
ba
|
1,274
sqft
|
built
1982
14014 Clear Forest Dr, Sugar Land, TX 77498
$-490
Cash flow
-10.0%
Cash-on-Cash Return
4.0%
Cap rate
0.7%
Rent to Value Ratio
507 out of 514 properties for sale in Sugar Land, TX
Limited Results Shown
Create a free account, or log in to reveal all property listings and enjoy the complete experience.

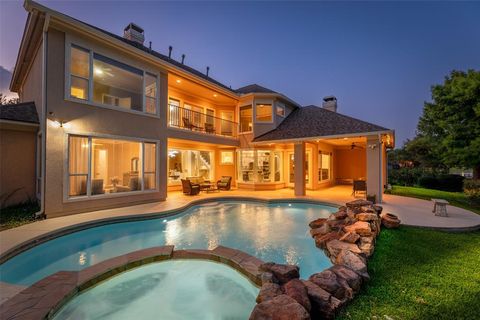
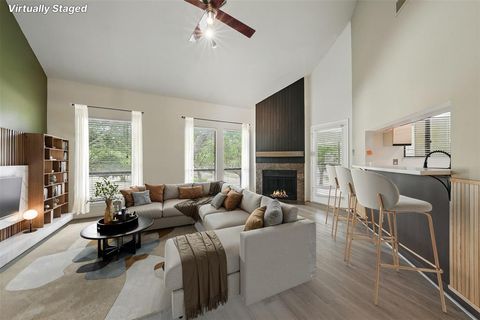
Active
$278,800
1
bds
|
0
ba
|
835
sqft
|
built
2004
2299 Lone Star Dr, Sugar Land, TX 77479
$-1,007
Cash flow
-18.8%
Cash-on-Cash Return
1.9%
Cap rate
0.7%
Rent to Value Ratio
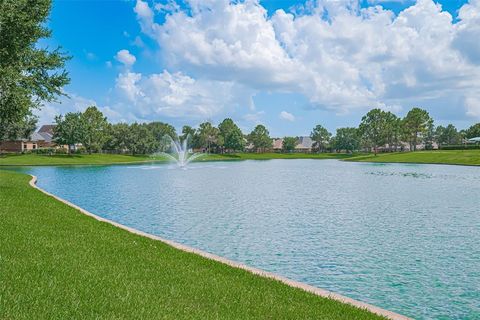
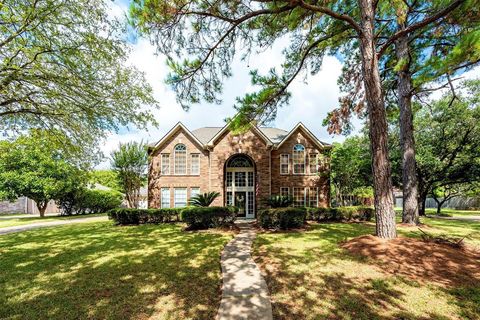
Active
$285,000
3
bds
|
0
ba
|
1,414
sqft
|
built
1970
13419 Greenway Dr, Sugar Land, TX 77498
$-615
Cash flow
-11.3%
Cash-on-Cash Return
3.7%
Cap rate
0.6%
Rent to Value Ratio

Active
$939,000
4
bds
|
0
ba
|
4,259
sqft
|
built
1993
3807 Snead Ct, Sugar Land, TX 77479
$-3,539
Cash flow
-19.7%
Cash-on-Cash Return
1.7%
Cap rate
0.4%
Rent to Value Ratio
Active
$780,000
5
bds
|
0
ba
|
3,961
sqft
|
built
2006
1811 Cambria Ln, Sugar Land, TX 77479
$-2,948
Cash flow
-19.7%
Cash-on-Cash Return
1.7%
Cap rate
0.5%
Rent to Value Ratio

Active
$490,000
3
bds
|
0
ba
|
2,354
sqft
|
built
1983
827 Millpond Dr, Sugar Land, TX 77498
$-1,299
Cash flow
-13.8%
Cash-on-Cash Return
3.1%
Cap rate
0.6%
Rent to Value Ratio
Active
$449,999
5
bds
|
0
ba
|
3,209
sqft
|
built
2002
4802 Zachary Ln, Sugar Land, TX 77479
$-1,275
Cash flow
-14.8%
Cash-on-Cash Return
2.9%
Cap rate
0.6%
Rent to Value Ratio
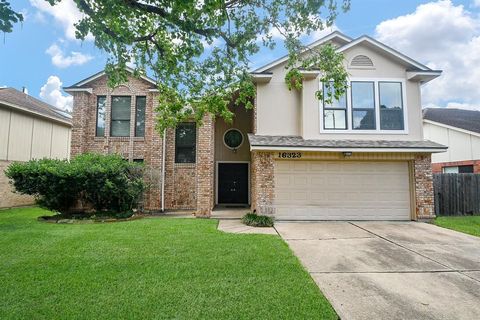
Active
$320,000
3
bds
|
0
ba
|
2,196
sqft
|
built
1986
16323 Elmwood Point Ln, Sugar Land, TX 77498
$-532
Cash flow
-8.7%
Cash-on-Cash Return
4.3%
Cap rate
0.8%
Rent to Value Ratio
Active
$377,900
4
bds
|
0
ba
|
2,556
sqft
|
built
1997
1030 Evandale Ln, Sugar Land, TX 77479
$-343
Cash flow
-4.7%
Cash-on-Cash Return
5.2%
Cap rate
0.7%
Rent to Value Ratio
Active
$299,500
3
bds
|
0
ba
|
1,795
sqft
|
built
1976
13506 Sherwood St, Sugar Land, TX 77498
$-566
Cash flow
-9.9%
Cash-on-Cash Return
4.0%
Cap rate
0.7%
Rent to Value Ratio
Active
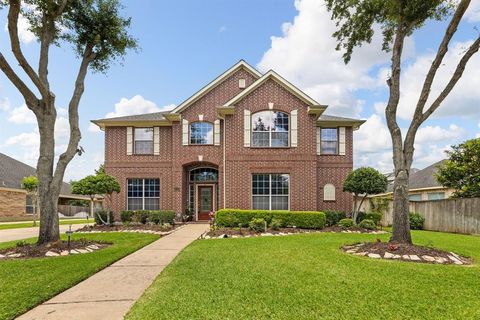
$565,000
4
bds
|
0
ba
|
3,304
sqft
|
built
2014
4511 Hickory Branch Ln, Sugar Land, TX 77479
$-1,587
Cash flow
-14.7%
Cash-on-Cash Return
2.9%
Cap rate
0.6%
Rent to Value Ratio
Active
$1,698,888
5
bds
|
0
ba
|
5,518
sqft
|
built
2013
5618 Camden Springs Ln, Sugar Land, TX 77479
$-5,111
Cash flow
-15.7%
Cash-on-Cash Return
2.7%
Cap rate
0.3%
Rent to Value Ratio
Active
$350,000
3
bds
|
0
ba
|
2,315
sqft
|
built
1994
4615 Jaymar Dr, Sugar Land, TX 77479
$-788
Cash flow
-11.7%
Cash-on-Cash Return
3.0%
Cap rate
0.7%
Rent to Value Ratio
Active
$345,000
3
bds
|
0
ba
|
1,697
sqft
|
built
1979
2103 Steamboat Run, Sugar Land, TX 77478
$-792
Cash flow
-12.0%
Cash-on-Cash Return
2.9%
Cap rate
0.6%
Rent to Value Ratio

Active
$395,000
3
bds
|
0
ba
|
2,288
sqft
|
built
1982
3207 Kempwood Dr, Sugar Land, TX 77479
$-606
Cash flow
-8.0%
Cash-on-Cash Return
3.8%
Cap rate
0.7%
Rent to Value Ratio
Active
$1,050,000
5
bds
|
0
ba
|
5,079
sqft
|
built
1996
42 Lake Mist Dr, Sugar Land, TX 77479
$-3,901
Cash flow
-19.4%
Cash-on-Cash Return
1.2%
Cap rate
0.4%
Rent to Value Ratio
Active
$619,000
4
bds
|
0
ba
|
4,119
sqft
|
built
2002
11018 Hundred Bridge Ln, Sugar Land, TX 77498
$-1,567
Cash flow
-13.2%
Cash-on-Cash Return
2.6%
Cap rate
0.5%
Rent to Value Ratio
Active
$1,799,000
6
bds
|
0
ba
|
5,510
sqft
|
built
2016
5811 Yango Terrace Ln, Sugar Land, TX 77479
$-7,250
Cash flow
-21.0%
Cash-on-Cash Return
0.8%
Cap rate
0.2%
Rent to Value Ratio
Active
$695,000
3
bds
|
0
ba
|
2,714
sqft
|
built
2019
5803 Manning Hollow Ln, Sugar Land, TX 77479
$-2,103
Cash flow
-15.8%
Cash-on-Cash Return
2.0%
Cap rate
0.5%
Rent to Value Ratio
Active
$369,000
3
bds
|
0
ba
|
1,710
sqft
|
built
1978
2730 Mesquite Dr, Sugar Land, TX 77479
$-865
Cash flow
-12.2%
Cash-on-Cash Return
2.9%
Cap rate
0.5%
Rent to Value Ratio
Active
$1,099,000
5
bds
|
0
ba
|
4,592
sqft
|
built
2002
5215 Eagle Pointe Ct, Sugar Land, TX 77479
$-4,243
Cash flow
-20.1%
Cash-on-Cash Return
1.6%
Cap rate
0.4%
Rent to Value Ratio
Active
$1,250,000
5
bds
|
0
ba
|
5,130
sqft
|
built
2013
5719 Avon Landing Ln, Sugar Land, TX 77479
$-4,997
Cash flow
-20.9%
Cash-on-Cash Return
1.5%
Cap rate
0.4%
Rent to Value Ratio
Active
$1,288,000
3
bds
|
0
ba
|
4,318
sqft
|
built
2007
1332 Lake Pointe Pkwy, Sugar Land, TX 77478
$-5,930
Cash flow
-24.0%
Cash-on-Cash Return
0.7%
Cap rate
0.3%
Rent to Value Ratio
Active
$435,000
3
bds
|
0
ba
|
2,458
sqft
|
built
1993
7319 Emerald Glen Dr, Sugar Land, TX 77479
$-1,123
Cash flow
-13.5%
Cash-on-Cash Return
3.2%
Cap rate
0.6%
Rent to Value Ratio
Active
$464,999
4
bds
|
0
ba
|
2,461
sqft
|
built
1989
2019 Teakwood Pl, Sugar Land, TX 77478
$-1,422
Cash flow
-16.0%
Cash-on-Cash Return
2.6%
Cap rate
0.5%
Rent to Value Ratio
Active
$285,000
3
bds
|
0
ba
|
1,618
sqft
|
built
1980
16841 Aprilmont Dr, Sugar Land, TX 77498
$-617
Cash flow
-11.3%
Cash-on-Cash Return
3.7%
Cap rate
0.7%
Rent to Value Ratio
Active
$550,000
5
bds
|
0
ba
|
3,411
sqft
|
built
1989
1826 Cheyenne River Cir, Sugar Land, TX 77478
$-1,675
Cash flow
-15.9%
Cash-on-Cash Return
2.6%
Cap rate
0.5%
Rent to Value Ratio
Active
$215,000
1
bds
|
0
ba
|
1,118
sqft
|
built
1984
4144 Greystone Way, Sugar Land, TX 77479
$-693
Cash flow
-16.8%
Cash-on-Cash Return
2.4%
Cap rate
0.9%
Rent to Value Ratio
Active
$255,000
3
bds
|
0
ba
|
1,274
sqft
|
built
1982
14014 Clear Forest Dr, Sugar Land, TX 77498
$-490
Cash flow
-10.0%
Cash-on-Cash Return
4.0%
Cap rate
0.7%
Rent to Value Ratio
Active
$520,000
5
bds
|
0
ba
|
3,305
sqft
|
built
1988
4331 Three Rivers Dr, Sugar Land, TX 77478
$-1,181
Cash flow
-11.8%
Cash-on-Cash Return
3.5%
Cap rate
0.6%
Rent to Value Ratio

Active
$475,000
4
bds
|
0
ba
|
3,104
sqft
|
built
1994
1907 Hickory Hill Ct, Sugar Land, TX 77478
$-1,311
Cash flow
-14.4%
Cash-on-Cash Return
3.0%
Cap rate
0.6%
Rent to Value Ratio

Active
$489,900
4
bds
|
0
ba
|
3,182
sqft
|
built
1988
1017 Oak Knoll Ct, Sugar Land, TX 77498
$-1,191
Cash flow
-12.7%
Cash-on-Cash Return
3.3%
Cap rate
0.6%
Rent to Value Ratio
Active
$274,900
3
bds
|
0
ba
|
1,584
sqft
|
built
1976
10123 Kent Towne Ln, Sugar Land, TX 77498
$-649
Cash flow
-12.3%
Cash-on-Cash Return
3.4%
Cap rate
0.7%
Rent to Value Ratio

Active
$333,300
3
bds
|
0
ba
|
1,900
sqft
|
built
2006
16626 Pademelon Dr, Sugar Land, TX 77498
$-906
Cash flow
-14.2%
Cash-on-Cash Return
3.0%
Cap rate
0.6%
Rent to Value Ratio
Active
$665,000
5
bds
|
0
ba
|
3,120
sqft
|
built
2005
3719 Arundel Gardens Ln, Sugar Land, TX 77498
$-2,155
Cash flow
-16.9%
Cash-on-Cash Return
2.4%
Cap rate
0.4%
Rent to Value Ratio
Active
$550,000
4
bds
|
0
ba
|
3,686
sqft
|
built
2005
13202 Brushy Knoll Ln, Sugar Land, TX 77498
$-1,654
Cash flow
-15.7%
Cash-on-Cash Return
2.7%
Cap rate
0.6%
Rent to Value Ratio

Active
$384,210
4
bds
|
0
ba
|
2,518
sqft
|
built
1989
210 Needleleaf Ln, Sugar Land, TX 77479
$-993
Cash flow
-13.5%
Cash-on-Cash Return
3.2%
Cap rate
0.7%
Rent to Value Ratio
Active
$557,500
4
bds
|
0
ba
|
2,861
sqft
|
built
1987
4403 Jamaica Dr, Sugar Land, TX 77479
$-1,763
Cash flow
-16.5%
Cash-on-Cash Return
2.5%
Cap rate
0.5%
Rent to Value Ratio
Active
$1,180,000
5
bds
|
0
ba
|
4,359
sqft
|
built
2002
5318 Turning Leaf Ln, Sugar Land, TX 77479
$-4,654
Cash flow
-20.6%
Cash-on-Cash Return
1.5%
Cap rate
0.4%
Rent to Value Ratio

Active
$535,000
4
bds
|
0
ba
|
3,179
sqft
|
built
2003
14339 Tasmania Ct, Sugar Land, TX 77498
$-1,610
Cash flow
-15.7%
Cash-on-Cash Return
2.7%
Cap rate
0.5%
Rent to Value Ratio
Active
$599,995
5
bds
|
0
ba
|
3,856
sqft
|
built
1992
6506 Taimer Ct, Sugar Land, TX 77479
$-1,652
Cash flow
-14.4%
Cash-on-Cash Return
3.0%
Cap rate
0.6%
Rent to Value Ratio