Sugar Land, TX Investment Properties for Sale
Browse homes for sale and investment properties in Sugar Land, TX. Refine your search by price, property type, or more.
Best cash flowing properties in Sugar Land, TX

Active
$225,000
3
bds
|
0
ba
|
1,047
sqft
|
built
1971
13439 Greenbriar Dr, Sugar Land, TX 77498
$-298
Cash flow
-6.9%
Cash-on-Cash Return
4.7%
Cap rate
0.8%
Rent to Value Ratio

Active
$215,000
2
bds
|
0
ba
|
1,110
sqft
|
built
1985
2808 Grants Lake Blvd, Sugar Land, TX 77479
$-368
Cash flow
-8.9%
Cash-on-Cash Return
4.2%
Cap rate
0.7%
Rent to Value Ratio
432 out of 523 properties for sale in Sugar Land, TX
Limited Results Shown
Create a free account, or log in to reveal all property listings and enjoy the complete experience.
Active
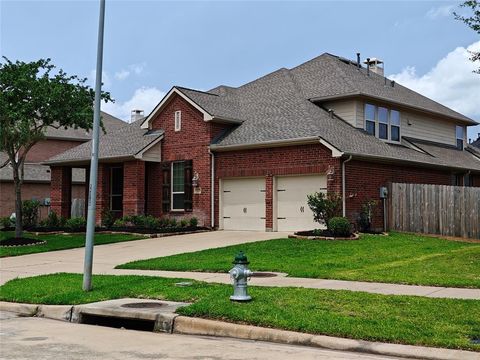
$589,990
5
bds
|
0
ba
|
3,060
sqft
|
built
2011
5551 Twin Rivers Ln, Sugar Land, TX 77479
$-1,861
Cash flow
-16.5%
Cash-on-Cash Return
2.5%
Cap rate
0.5%
Rent to Value Ratio

Active
$399,900
4
bds
|
0
ba
|
2,162
sqft
|
built
1993
815 Spring Valley Ct, Sugar Land, TX 77479
$-1,189
Cash flow
-15.5%
Cash-on-Cash Return
2.7%
Cap rate
0.6%
Rent to Value Ratio
Active
$389,000
4
bds
|
0
ba
|
2,451
sqft
|
built
1998
7402 Broken Oak Ln, Sugar Land, TX 77479
$-902
Cash flow
-12.1%
Cash-on-Cash Return
3.5%
Cap rate
0.7%
Rent to Value Ratio
Active
$320,000
3
bds
|
0
ba
|
1,696
sqft
|
built
1983
3915 Flintrock Ln, Sugar Land, TX 77479
$-679
Cash flow
-11.1%
Cash-on-Cash Return
3.7%
Cap rate
0.7%
Rent to Value Ratio
Active
$2,180,000
6
bds
|
0
ba
|
8,472
sqft
|
built
1986
35 The Oval St, Sugar Land, TX 77479
$-10,839
Cash flow
-25.9%
Cash-on-Cash Return
0.3%
Cap rate
0.2%
Rent to Value Ratio

Active
$705,000
4
bds
|
0
ba
|
3,894
sqft
|
built
2009
5422 Dalton Ranch Ln, Sugar Land, TX 77479
$-2,375
Cash flow
-17.6%
Cash-on-Cash Return
2.2%
Cap rate
0.5%
Rent to Value Ratio
Active
$490,000
4
bds
|
0
ba
|
3,343
sqft
|
built
1991
6130 Walkers Park Dr, Sugar Land, TX 77479
$-1,408
Cash flow
-15.0%
Cash-on-Cash Return
2.8%
Cap rate
0.6%
Rent to Value Ratio
Active
$450,000
3
bds
|
0
ba
|
2,654
sqft
|
built
2001
2207 Desert Vine Ct, Sugar Land, TX 77498
$-1,276
Cash flow
-14.8%
Cash-on-Cash Return
2.9%
Cap rate
0.6%
Rent to Value Ratio

Active
$290,890
3
bds
|
0
ba
|
1,446
sqft
|
built
1963
526 Guyer St, Sugar Land, TX 77498
$-640
Cash flow
-11.5%
Cash-on-Cash Return
3.6%
Cap rate
0.6%
Rent to Value Ratio

Active
$729,900
4
bds
|
0
ba
|
3,636
sqft
|
built
2018
4423 Sterling Heights Ln, Sugar Land, TX 77479
$-1,782
Cash flow
-12.7%
Cash-on-Cash Return
3.3%
Cap rate
0.6%
Rent to Value Ratio

Active
$840,000
5
bds
|
0
ba
|
4,488
sqft
|
built
2013
4215 Orchard Arbor Ln, Sugar Land, TX 77479
$-3,301
Cash flow
-20.5%
Cash-on-Cash Return
1.5%
Cap rate
0.4%
Rent to Value Ratio

Active
$1,650,000
3
bds
|
0
ba
|
4,077
sqft
|
built
2012
1103 Vista Creek Dr, Sugar Land, TX 77478
$-7,565
Cash flow
-23.9%
Cash-on-Cash Return
0.8%
Cap rate
0.2%
Rent to Value Ratio

Active
$429,000
4
bds
|
0
ba
|
2,237
sqft
|
built
1979
2706 Williams Grant St, Sugar Land, TX 77479
$-1,291
Cash flow
-15.7%
Cash-on-Cash Return
2.7%
Cap rate
0.5%
Rent to Value Ratio
Active
$549,000
4
bds
|
0
ba
|
3,087
sqft
|
built
2008
5619 Honey Brook Ct, Sugar Land, TX 77479
$-1,541
Cash flow
-14.6%
Cash-on-Cash Return
2.9%
Cap rate
0.6%
Rent to Value Ratio
Active
$575,000
3
bds
|
0
ba
|
2,998
sqft
|
built
1997
7402 Stone Arbor Dr, Sugar Land, TX 77479
$-661
Cash flow
-6.0%
Cash-on-Cash Return
4.9%
Cap rate
0.6%
Rent to Value Ratio
Active
$339,900
4
bds
|
0
ba
|
1,905
sqft
|
built
1981
2223 Sentinal Oaks St, Sugar Land, TX 77478
$-446
Cash flow
-6.8%
Cash-on-Cash Return
4.7%
Cap rate
0.6%
Rent to Value Ratio

Active
$968,800
5
bds
|
0
ba
|
4,124
sqft
|
built
2015
5506 Lockwood Bend Ln, Sugar Land, TX 77479
$-2,131
Cash flow
-11.5%
Cash-on-Cash Return
3.6%
Cap rate
0.5%
Rent to Value Ratio
Active
$519,900
4
bds
|
0
ba
|
3,200
sqft
|
built
2000
2914 Renoir, Sugar Land, TX 77479
$-1,292
Cash flow
-13.0%
Cash-on-Cash Return
3.3%
Cap rate
0.6%
Rent to Value Ratio

Active
$519,000
4
bds
|
0
ba
|
2,867
sqft
|
built
1992
426 Lakeside Blvd, Sugar Land, TX 77478
$-1,290
Cash flow
-13.0%
Cash-on-Cash Return
3.3%
Cap rate
0.6%
Rent to Value Ratio

Active
$1,285,000
5
bds
|
0
ba
|
5,268
sqft
|
built
1991
14 Tredington St, Sugar Land, TX 77479
$-5,418
Cash flow
-22.0%
Cash-on-Cash Return
1.2%
Cap rate
0.4%
Rent to Value Ratio
Active
$695,000
4
bds
|
0
ba
|
3,472
sqft
|
built
1989
4022 Bountiful Crest Ln, Sugar Land, TX 77479
$-2,221
Cash flow
-16.7%
Cash-on-Cash Return
2.4%
Cap rate
0.5%
Rent to Value Ratio

Active
$1,680,000
4
bds
|
0
ba
|
5,661
sqft
|
built
2002
22 Berenger Pl, Sugar Land, TX 77479
$-6,015
Cash flow
-18.7%
Cash-on-Cash Return
2.0%
Cap rate
0.4%
Rent to Value Ratio

Active
$849,000
3
bds
|
0
ba
|
3,222
sqft
|
built
1997
203 Bay Bridge Dr, Sugar Land, TX 77478
$-2,343
Cash flow
-14.4%
Cash-on-Cash Return
3.0%
Cap rate
0.5%
Rent to Value Ratio

Active
$399,000
4
bds
|
0
ba
|
2,621
sqft
|
built
1991
211 Rolling Plains Dr, Sugar Land, TX 77479
$-966
Cash flow
-12.6%
Cash-on-Cash Return
3.4%
Cap rate
0.7%
Rent to Value Ratio
Active
$610,000
4
bds
|
0
ba
|
2,909
sqft
|
built
1995
7103 Adobe Meadows Ct, Sugar Land, TX 77479
$-718
Cash flow
-6.1%
Cash-on-Cash Return
4.9%
Cap rate
0.8%
Rent to Value Ratio
Active
$660,000
4
bds
|
0
ba
|
3,510
sqft
|
built
2022
1511 Forest Brk, Sugar Land, TX 77479
$-2,587
Cash flow
-20.5%
Cash-on-Cash Return
1.6%
Cap rate
0.5%
Rent to Value Ratio

Active
$689,000
4
bds
|
0
ba
|
3,375
sqft
|
built
2001
5439 Emerald Pointe Ln, Sugar Land, TX 77479
$-1,306
Cash flow
-9.9%
Cash-on-Cash Return
4.0%
Cap rate
0.5%
Rent to Value Ratio

Active
$549,000
4
bds
|
0
ba
|
3,915
sqft
|
built
1999
7503 Northwoods Dr, Sugar Land, TX 77479
$-1,706
Cash flow
-16.2%
Cash-on-Cash Return
2.5%
Cap rate
0.7%
Rent to Value Ratio
Active
$225,000
3
bds
|
0
ba
|
1,047
sqft
|
built
1971
13439 Greenbriar Dr, Sugar Land, TX 77498
$-298
Cash flow
-6.9%
Cash-on-Cash Return
4.7%
Cap rate
0.8%
Rent to Value Ratio

Active
$925,000
4
bds
|
0
ba
|
5,373
sqft
|
built
1991
1734 Forestlake Dr, Sugar Land, TX 77479
$-3,598
Cash flow
-20.3%
Cash-on-Cash Return
1.6%
Cap rate
0.4%
Rent to Value Ratio

Active
$250,000
1
bds
|
0
ba
|
1,118
sqft
|
built
1984
4144 Greystone Way, Sugar Land, TX 77479
$-639
Cash flow
-13.3%
Cash-on-Cash Return
3.2%
Cap rate
0.7%
Rent to Value Ratio
Active
$1,950,000
4
bds
|
0
ba
|
5,800
sqft
|
built
1998
6111 Creekview Dr, Sugar Land, TX 77479
$-6,800
Cash flow
-18.2%
Cash-on-Cash Return
2.1%
Cap rate
0.4%
Rent to Value Ratio

Active
$350,000
3
bds
|
0
ba
|
2,274
sqft
|
built
1997
915 Featherbrook Ct, Sugar Land, TX 77479
$-1,042
Cash flow
-15.5%
Cash-on-Cash Return
2.7%
Cap rate
0.6%
Rent to Value Ratio
Active
$523,000
4
bds
|
0
ba
|
3,010
sqft
|
built
1990
16622 Colony Terrace Dr, Sugar Land, TX 77479
$-1,557
Cash flow
-15.5%
Cash-on-Cash Return
2.7%
Cap rate
0.6%
Rent to Value Ratio

Active
$388,000
4
bds
|
0
ba
|
2,309
sqft
|
built
1978
2707 Williams Grant St, Sugar Land, TX 77479
$-947
Cash flow
-12.7%
Cash-on-Cash Return
3.3%
Cap rate
0.6%
Rent to Value Ratio

Active
$466,200
5
bds
|
0
ba
|
2,829
sqft
|
built
2000
1314 Cross Valley Dr, Sugar Land, TX 77479
$-1,285
Cash flow
-14.4%
Cash-on-Cash Return
3.0%
Cap rate
0.6%
Rent to Value Ratio

Active
$1,499,900
5
bds
|
0
ba
|
4,603
sqft
|
built
2015
6111 Abercombie Ln, Sugar Land, TX 77479
$-5,388
Cash flow
-18.7%
Cash-on-Cash Return
2.0%
Cap rate
0.4%
Rent to Value Ratio
Active
$326,889
3
bds
|
0
ba
|
2,052
sqft
|
built
2000
7203 Welshwood Ln, Sugar Land, TX 77479
$-753
Cash flow
-12.0%
Cash-on-Cash Return
3.5%
Cap rate
0.9%
Rent to Value Ratio
Active
$215,000
2
bds
|
0
ba
|
1,110
sqft
|
built
1985
2808 Grants Lake Blvd, Sugar Land, TX 77479
$-368
Cash flow
-8.9%
Cash-on-Cash Return
4.2%
Cap rate
0.7%
Rent to Value Ratio
Active
$2,195,000
3
bds
|
0
ba
|
3,045
sqft
|
built
2000
802 San Marino St, Sugar Land, TX 77478
$-8,953
Cash flow
-21.3%
Cash-on-Cash Return
1.4%
Cap rate
0.3%
Rent to Value Ratio