Sugar Land, TX Investment Properties for Sale
Browse homes for sale and investment properties in Sugar Land, TX. Refine your search by price, property type, or more.
Best cash flowing properties in Sugar Land, TX

Active
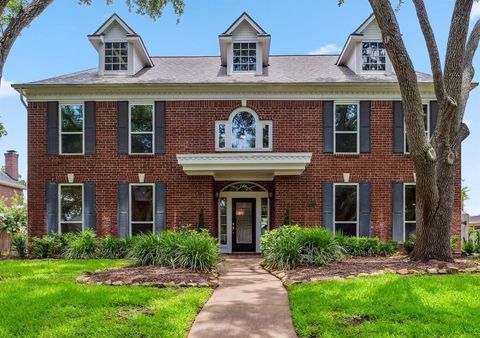
$377,900
4
bds
|
0
ba
|
2,556
sqft
|
built
1997
1030 Evandale Ln, Sugar Land, TX 77479
$-158
Cash flow
-2.2%
Cash-on-Cash Return
5.2%
Cap rate
0.7%
Rent to Value Ratio

Active
$215,000
2
bds
|
0
ba
|
1,110
sqft
|
built
1985
2808 Grants Lake Blvd, Sugar Land, TX 77479
$-263
Cash flow
-6.4%
Cash-on-Cash Return
4.2%
Cap rate
0.7%
Rent to Value Ratio
435 out of 526 properties for sale in Sugar Land, TX
Limited Results Shown
Create a free account, or log in to reveal all property listings and enjoy the complete experience.

Active
$549,000
4
bds
|
0
ba
|
3,915
sqft
|
built
1999
7503 Northwoods Dr, Sugar Land, TX 77479
$-1,438
Cash flow
-13.7%
Cash-on-Cash Return
2.5%
Cap rate
0.7%
Rent to Value Ratio

Active
$925,000
4
bds
|
0
ba
|
5,373
sqft
|
built
1991
1734 Forestlake Dr, Sugar Land, TX 77479
$-3,146
Cash flow
-17.7%
Cash-on-Cash Return
1.6%
Cap rate
0.4%
Rent to Value Ratio

Active
$519,000
4
bds
|
0
ba
|
2,867
sqft
|
built
1992
426 Lakeside Blvd, Sugar Land, TX 77478
$-1,036
Cash flow
-10.4%
Cash-on-Cash Return
3.3%
Cap rate
0.6%
Rent to Value Ratio
Active
$695,000
4
bds
|
0
ba
|
3,472
sqft
|
built
1989
4022 Bountiful Crest Ln, Sugar Land, TX 77479
$-1,882
Cash flow
-14.1%
Cash-on-Cash Return
2.4%
Cap rate
0.5%
Rent to Value Ratio
Active
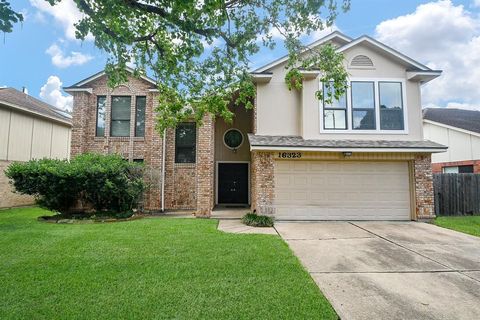
$320,000
3
bds
|
0
ba
|
2,196
sqft
|
built
1986
16323 Elmwood Point Ln, Sugar Land, TX 77498
$-375
Cash flow
-6.1%
Cash-on-Cash Return
4.3%
Cap rate
0.8%
Rent to Value Ratio

Active
$1,799,000
5
bds
|
0
ba
|
5,518
sqft
|
built
2013
5618 Camden Springs Ln, Sugar Land, TX 77479
$-4,755
Cash flow
-13.8%
Cash-on-Cash Return
2.5%
Cap rate
0.3%
Rent to Value Ratio
Active
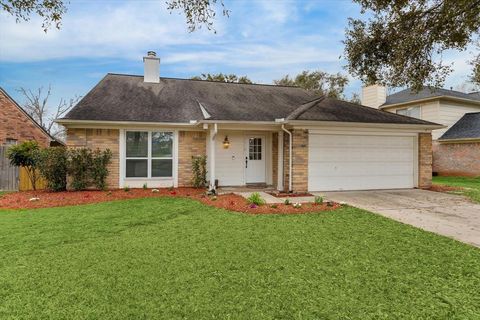
$320,000
3
bds
|
0
ba
|
1,696
sqft
|
built
1983
3915 Flintrock Ln, Sugar Land, TX 77479
$-522
Cash flow
-8.5%
Cash-on-Cash Return
3.7%
Cap rate
0.7%
Rent to Value Ratio

Active
$840,000
5
bds
|
0
ba
|
4,488
sqft
|
built
2013
4215 Orchard Arbor Ln, Sugar Land, TX 77479
$-2,891
Cash flow
-18.0%
Cash-on-Cash Return
1.5%
Cap rate
0.4%
Rent to Value Ratio

Active
$1,650,000
3
bds
|
0
ba
|
4,077
sqft
|
built
2012
1103 Vista Creek Dr, Sugar Land, TX 77478
$-6,759
Cash flow
-21.4%
Cash-on-Cash Return
0.8%
Cap rate
0.2%
Rent to Value Ratio

Active
$429,000
4
bds
|
0
ba
|
2,237
sqft
|
built
1979
2706 Williams Grant St, Sugar Land, TX 77479
$-1,081
Cash flow
-13.1%
Cash-on-Cash Return
2.7%
Cap rate
0.5%
Rent to Value Ratio
Active
$549,000
4
bds
|
0
ba
|
3,087
sqft
|
built
2008
5619 Honey Brook Ct, Sugar Land, TX 77479
$-1,273
Cash flow
-12.1%
Cash-on-Cash Return
2.9%
Cap rate
0.6%
Rent to Value Ratio
Active
$339,900
4
bds
|
0
ba
|
1,905
sqft
|
built
1981
2223 Sentinal Oaks St, Sugar Land, TX 77478
$-280
Cash flow
-4.3%
Cash-on-Cash Return
4.7%
Cap rate
0.6%
Rent to Value Ratio
Active
$1,950,000
4
bds
|
0
ba
|
5,800
sqft
|
built
1998
6111 Creekview Dr, Sugar Land, TX 77479
$-5,848
Cash flow
-15.6%
Cash-on-Cash Return
2.1%
Cap rate
0.4%
Rent to Value Ratio
Active
$215,000
2
bds
|
0
ba
|
1,110
sqft
|
built
1985
2808 Grants Lake Blvd, Sugar Land, TX 77479
$-263
Cash flow
-6.4%
Cash-on-Cash Return
4.2%
Cap rate
0.7%
Rent to Value Ratio
Active
$2,195,000
3
bds
|
0
ba
|
3,045
sqft
|
built
2000
802 San Marino St, Sugar Land, TX 77478
$-7,880
Cash flow
-18.7%
Cash-on-Cash Return
1.4%
Cap rate
0.3%
Rent to Value Ratio

Active
$849,000
3
bds
|
0
ba
|
3,222
sqft
|
built
1997
203 Bay Bridge Dr, Sugar Land, TX 77478
$-1,929
Cash flow
-11.9%
Cash-on-Cash Return
3.0%
Cap rate
0.5%
Rent to Value Ratio

Active
$399,000
4
bds
|
0
ba
|
2,621
sqft
|
built
1991
211 Rolling Plains Dr, Sugar Land, TX 77479
$-771
Cash flow
-10.1%
Cash-on-Cash Return
3.4%
Cap rate
0.7%
Rent to Value Ratio

Active
$689,000
4
bds
|
0
ba
|
3,375
sqft
|
built
2001
5439 Emerald Pointe Ln, Sugar Land, TX 77479
$-970
Cash flow
-7.3%
Cash-on-Cash Return
4.0%
Cap rate
0.5%
Rent to Value Ratio
Active
$326,889
3
bds
|
0
ba
|
2,052
sqft
|
built
2000
7203 Welshwood Ln, Sugar Land, TX 77479
$-593
Cash flow
-9.5%
Cash-on-Cash Return
3.5%
Cap rate
0.9%
Rent to Value Ratio

Active
$968,800
5
bds
|
0
ba
|
4,124
sqft
|
built
2015
5506 Lockwood Bend Ln, Sugar Land, TX 77479
$-1,658
Cash flow
-8.9%
Cash-on-Cash Return
3.6%
Cap rate
0.5%
Rent to Value Ratio

Active
$1,499,900
5
bds
|
0
ba
|
4,603
sqft
|
built
2015
6111 Abercombie Ln, Sugar Land, TX 77479
$-4,655
Cash flow
-16.2%
Cash-on-Cash Return
2.0%
Cap rate
0.4%
Rent to Value Ratio
Active
$299,500
3
bds
|
0
ba
|
1,795
sqft
|
built
1976
13506 Sherwood St, Sugar Land, TX 77498
$-419
Cash flow
-7.3%
Cash-on-Cash Return
4.0%
Cap rate
0.7%
Rent to Value Ratio
Active
$377,900
4
bds
|
0
ba
|
2,556
sqft
|
built
1997
1030 Evandale Ln, Sugar Land, TX 77479
$-158
Cash flow
-2.2%
Cash-on-Cash Return
5.2%
Cap rate
0.7%
Rent to Value Ratio

Active
$1,285,000
5
bds
|
0
ba
|
5,268
sqft
|
built
1991
14 Tredington St, Sugar Land, TX 77479
$-4,790
Cash flow
-19.4%
Cash-on-Cash Return
1.2%
Cap rate
0.4%
Rent to Value Ratio
Active
$519,900
4
bds
|
0
ba
|
3,200
sqft
|
built
2000
2914 Renoir, Sugar Land, TX 77479
$-1,038
Cash flow
-10.4%
Cash-on-Cash Return
3.3%
Cap rate
0.6%
Rent to Value Ratio

Active
$278,800
1
bds
|
0
ba
|
835
sqft
|
built
2004
2299 Lone Star Dr, Sugar Land, TX 77479
$-870
Cash flow
-16.3%
Cash-on-Cash Return
1.9%
Cap rate
0.7%
Rent to Value Ratio

Active
$939,000
4
bds
|
0
ba
|
4,259
sqft
|
built
1993
3807 Snead Ct, Sugar Land, TX 77479
$-3,081
Cash flow
-17.1%
Cash-on-Cash Return
1.7%
Cap rate
0.4%
Rent to Value Ratio

Active
$250,000
1
bds
|
0
ba
|
1,118
sqft
|
built
1984
4144 Greystone Way, Sugar Land, TX 77479
$-517
Cash flow
-10.8%
Cash-on-Cash Return
3.2%
Cap rate
0.7%
Rent to Value Ratio
Active
$285,000
3
bds
|
0
ba
|
1,414
sqft
|
built
1970
13419 Greenway Dr, Sugar Land, TX 77498
$-476
Cash flow
-8.7%
Cash-on-Cash Return
3.7%
Cap rate
0.6%
Rent to Value Ratio
Active
$780,000
5
bds
|
0
ba
|
3,961
sqft
|
built
2006
1811 Cambria Ln, Sugar Land, TX 77479
$-2,567
Cash flow
-17.2%
Cash-on-Cash Return
1.7%
Cap rate
0.5%
Rent to Value Ratio

Active
$1,680,000
4
bds
|
0
ba
|
5,661
sqft
|
built
2002
22 Berenger Pl, Sugar Land, TX 77479
$-5,194
Cash flow
-16.1%
Cash-on-Cash Return
2.0%
Cap rate
0.4%
Rent to Value Ratio
Active
$610,000
4
bds
|
0
ba
|
2,909
sqft
|
built
1995
7103 Adobe Meadows Ct, Sugar Land, TX 77479
$-420
Cash flow
-3.6%
Cash-on-Cash Return
4.9%
Cap rate
0.8%
Rent to Value Ratio
Active
$660,000
4
bds
|
0
ba
|
3,510
sqft
|
built
2022
1511 Forest Brk, Sugar Land, TX 77479
$-2,264
Cash flow
-17.9%
Cash-on-Cash Return
1.6%
Cap rate
0.5%
Rent to Value Ratio

Active
$290,890
3
bds
|
0
ba
|
1,446
sqft
|
built
1963
526 Guyer St, Sugar Land, TX 77498
$-498
Cash flow
-8.9%
Cash-on-Cash Return
3.6%
Cap rate
0.6%
Rent to Value Ratio

Active
$729,900
4
bds
|
0
ba
|
3,636
sqft
|
built
2018
4423 Sterling Heights Ln, Sugar Land, TX 77479
$-1,425
Cash flow
-10.2%
Cash-on-Cash Return
3.3%
Cap rate
0.6%
Rent to Value Ratio
Active
$389,000
4
bds
|
0
ba
|
2,451
sqft
|
built
1998
7402 Broken Oak Ln, Sugar Land, TX 77479
$-712
Cash flow
-9.5%
Cash-on-Cash Return
3.5%
Cap rate
0.7%
Rent to Value Ratio

Active
$350,000
3
bds
|
0
ba
|
2,274
sqft
|
built
1997
915 Featherbrook Ct, Sugar Land, TX 77479
$-871
Cash flow
-13.0%
Cash-on-Cash Return
2.7%
Cap rate
0.6%
Rent to Value Ratio
Active
$565,000
4
bds
|
0
ba
|
3,304
sqft
|
built
2014
4511 Hickory Branch Ln, Sugar Land, TX 77479
$-1,311
Cash flow
-12.1%
Cash-on-Cash Return
2.9%
Cap rate
0.6%
Rent to Value Ratio

Active
$388,000
4
bds
|
0
ba
|
2,309
sqft
|
built
1978
2707 Williams Grant St, Sugar Land, TX 77479
$-757
Cash flow
-10.2%
Cash-on-Cash Return
3.3%
Cap rate
0.6%
Rent to Value Ratio
Active
$575,000
3
bds
|
0
ba
|
2,998
sqft
|
built
1997
7402 Stone Arbor Dr, Sugar Land, TX 77479
$-380
Cash flow
-3.4%
Cash-on-Cash Return
4.9%
Cap rate
0.6%
Rent to Value Ratio