Sugar Land, TX Investment Properties for Sale
Browse homes for sale and investment properties in Sugar Land, TX. Refine your search by price, property type, or more.
Best cash flowing properties in Sugar Land, TX

Active
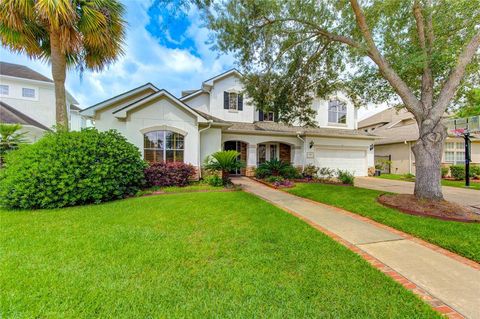
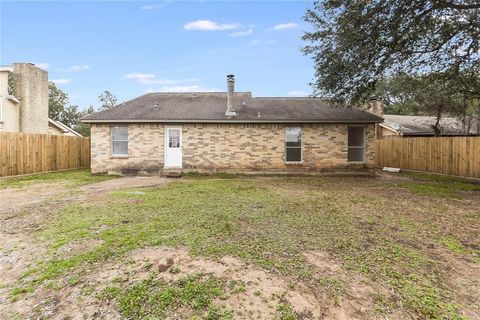
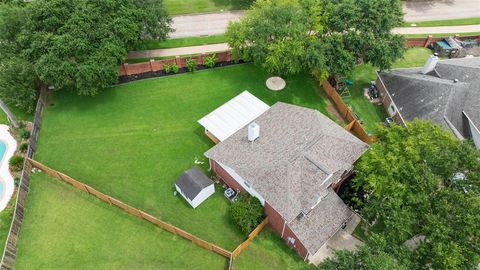
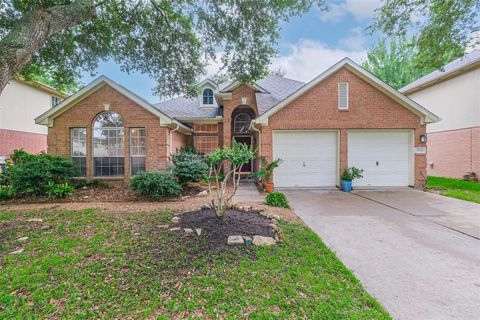
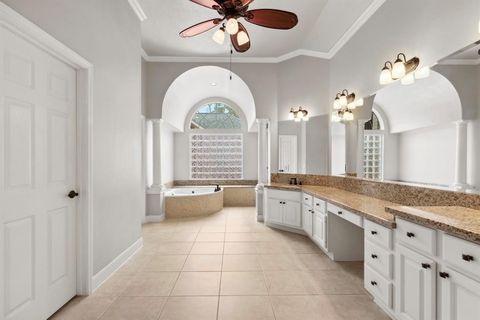
$325,000
3
bds
|
0
ba
|
2,439
sqft
|
built
2002
16306 Soaring Eagle Dr, Sugar Land, TX 77498
$-215
Cash flow
-3.5%
Cash-on-Cash Return
5.5%
Cap rate
0.7%
Rent to Value Ratio
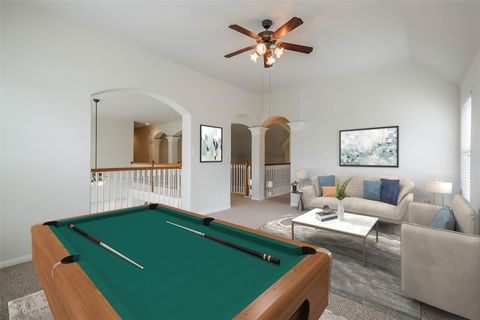
Active
$235,000
2
bds
|
0
ba
|
1,226
sqft
|
built
1982
2922 Whetrock Ln, Sugar Land, TX 77479
$-555
Cash flow
-12.3%
Cash-on-Cash Return
2.8%
Cap rate
0.6%
Rent to Value Ratio
507 out of 514 properties for sale in Sugar Land, TX
Limited Results Shown
Create a free account, or log in to reveal all property listings and enjoy the complete experience.

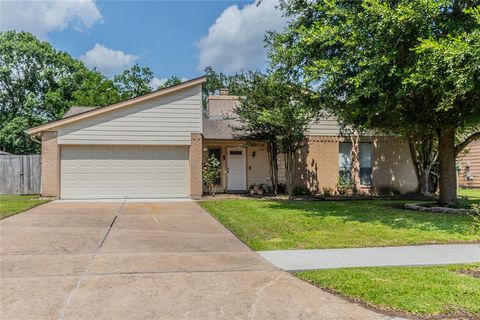
Active
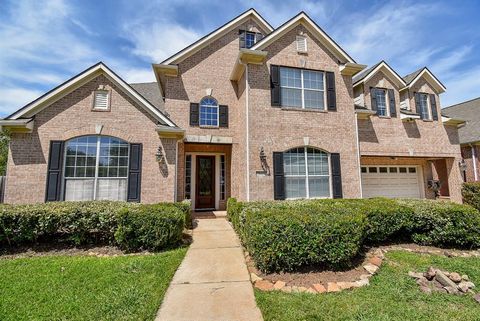
$489,900
4
bds
|
0
ba
|
3,182
sqft
|
built
1988
1017 Oak Knoll Ct, Sugar Land, TX 77498
$-1,191
Cash flow
-12.7%
Cash-on-Cash Return
3.3%
Cap rate
0.6%
Rent to Value Ratio
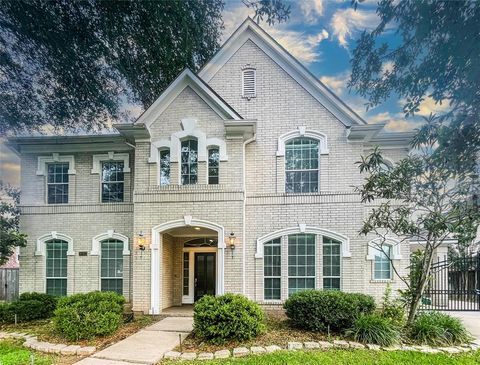
Active
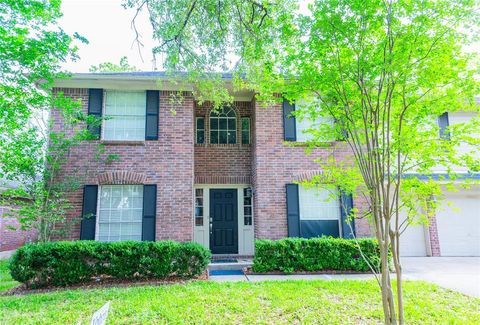
$274,900
3
bds
|
0
ba
|
1,584
sqft
|
built
1976
10123 Kent Towne Ln, Sugar Land, TX 77498
$-649
Cash flow
-12.3%
Cash-on-Cash Return
3.4%
Cap rate
0.7%
Rent to Value Ratio
Active
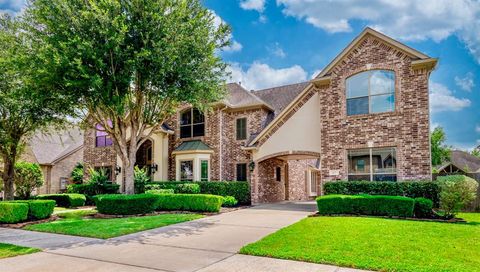
$550,000
4
bds
|
0
ba
|
3,686
sqft
|
built
2005
13202 Brushy Knoll Ln, Sugar Land, TX 77498
$-1,654
Cash flow
-15.7%
Cash-on-Cash Return
2.7%
Cap rate
0.6%
Rent to Value Ratio
Active
$299,500
3
bds
|
0
ba
|
1,875
sqft
|
built
1974
13722 Woodchester Dr, Sugar Land, TX 77498
$-639
Cash flow
-11.1%
Cash-on-Cash Return
3.7%
Cap rate
0.7%
Rent to Value Ratio

Active
$849,000
4
bds
|
0
ba
|
3,663
sqft
|
built
2000
5419 Eagle Trace Ct, Sugar Land, TX 77479
$-2,764
Cash flow
-17.0%
Cash-on-Cash Return
2.4%
Cap rate
0.5%
Rent to Value Ratio
Active
$3,639,000
5
bds
|
0
ba
|
7,482
sqft
|
built
1997
326 W Alkire Lake Dr, Sugar Land, TX 77478
$-14,030
Cash flow
-20.1%
Cash-on-Cash Return
1.6%
Cap rate
0.2%
Rent to Value Ratio

Active
$333,300
3
bds
|
0
ba
|
1,900
sqft
|
built
2006
16626 Pademelon Dr, Sugar Land, TX 77498
$-906
Cash flow
-14.2%
Cash-on-Cash Return
3.0%
Cap rate
0.6%
Rent to Value Ratio
Active
$299,990
4
bds
|
0
ba
|
2,074
sqft
|
built
1983
1007 Sugardale Ct, Sugar Land, TX 77498
$-596
Cash flow
-10.4%
Cash-on-Cash Return
3.9%
Cap rate
0.7%
Rent to Value Ratio

Active
$625,000
4
bds
|
0
ba
|
3,539
sqft
|
built
2005
14330 Ayers Rock Rd, Sugar Land, TX 77498
$-2,420
Cash flow
-20.2%
Cash-on-Cash Return
1.6%
Cap rate
0.5%
Rent to Value Ratio
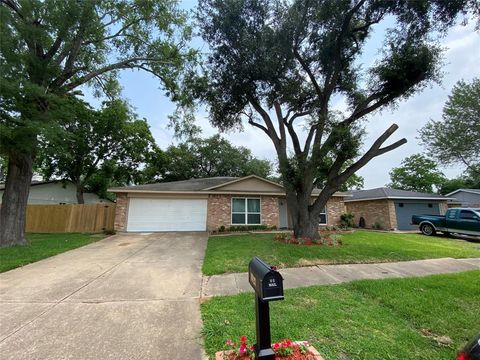
Active
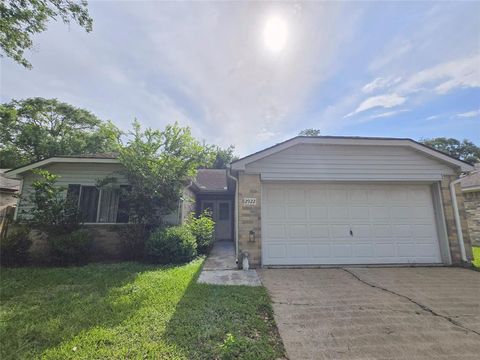
$319,000
3
bds
|
0
ba
|
1,789
sqft
|
built
1978
3122 Mosby Dr, Sugar Land, TX 77479
$-733
Cash flow
-12.0%
Cash-on-Cash Return
3.5%
Cap rate
0.6%
Rent to Value Ratio
Active
$557,500
4
bds
|
0
ba
|
2,861
sqft
|
built
1987
4403 Jamaica Dr, Sugar Land, TX 77479
$-1,763
Cash flow
-16.5%
Cash-on-Cash Return
2.5%
Cap rate
0.5%
Rent to Value Ratio

Active
$384,210
4
bds
|
0
ba
|
2,518
sqft
|
built
1989
210 Needleleaf Ln, Sugar Land, TX 77479
$-993
Cash flow
-13.5%
Cash-on-Cash Return
3.2%
Cap rate
0.7%
Rent to Value Ratio

Active
$535,000
4
bds
|
0
ba
|
3,179
sqft
|
built
2003
14339 Tasmania Ct, Sugar Land, TX 77498
$-1,610
Cash flow
-15.7%
Cash-on-Cash Return
2.7%
Cap rate
0.5%
Rent to Value Ratio

Active
$1,300,000
5
bds
|
0
ba
|
4,674
sqft
|
built
2018
5807 Yango Terrace Ln, Sugar Land, TX 77479
$-5,507
Cash flow
-22.1%
Cash-on-Cash Return
1.2%
Cap rate
0.3%
Rent to Value Ratio
Active
$665,000
3
bds
|
0
ba
|
2,739
sqft
|
built
1995
3106 Royal Lytham Ct, Sugar Land, TX 77479
$-2,135
Cash flow
-16.8%
Cash-on-Cash Return
2.4%
Cap rate
0.5%
Rent to Value Ratio
Active
$2,489,000
5
bds
|
0
ba
|
6,190
sqft
|
built
2016
35 Enclave Manor Dr, Sugar Land, TX 77479
$-9,627
Cash flow
-20.2%
Cash-on-Cash Return
1.6%
Cap rate
0.4%
Rent to Value Ratio
Active
$829,900
4
bds
|
0
ba
|
3,834
sqft
|
built
2016
47 Monarch Trl, Sugar Land, TX 77498
$-2,623
Cash flow
-16.5%
Cash-on-Cash Return
2.5%
Cap rate
0.6%
Rent to Value Ratio
Active
$385,000
4
bds
|
0
ba
|
2,363
sqft
|
built
1982
2639 Valley Field Dr, Sugar Land, TX 77479
$-845
Cash flow
-11.5%
Cash-on-Cash Return
3.6%
Cap rate
0.6%
Rent to Value Ratio
Active
$1,180,000
5
bds
|
0
ba
|
4,359
sqft
|
built
2002
5318 Turning Leaf Ln, Sugar Land, TX 77479
$-4,654
Cash flow
-20.6%
Cash-on-Cash Return
1.5%
Cap rate
0.4%
Rent to Value Ratio

Active
$229,000
3
bds
|
0
ba
|
1,422
sqft
|
built
2000
2710 Grants Lake Blvd, Sugar Land, TX 77479
$-741
Cash flow
-16.9%
Cash-on-Cash Return
2.4%
Cap rate
0.9%
Rent to Value Ratio
Active
$560,000
4
bds
|
0
ba
|
3,768
sqft
|
built
2003
14038 Cobalt Glen Dr, Sugar Land, TX 77498
$-1,489
Cash flow
-13.9%
Cash-on-Cash Return
3.1%
Cap rate
0.6%
Rent to Value Ratio

Active
$549,000
3
bds
|
0
ba
|
2,359
sqft
|
built
2006
6706 Oakman Ln, Sugar Land, TX 77479
$-1,926
Cash flow
-18.3%
Cash-on-Cash Return
2.1%
Cap rate
0.5%
Rent to Value Ratio
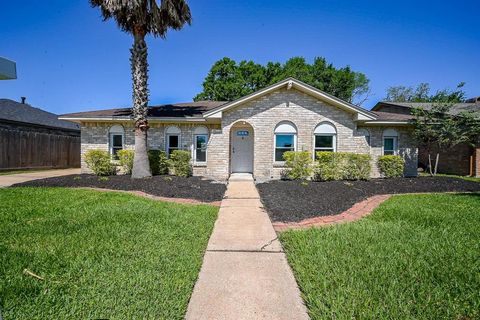
Active
$285,000
3
bds
|
0
ba
|
1,618
sqft
|
built
1980
16841 Aprilmont Dr, Sugar Land, TX 77498
$-617
Cash flow
-11.3%
Cash-on-Cash Return
3.7%
Cap rate
0.7%
Rent to Value Ratio
Active
$615,000
4
bds
|
0
ba
|
3,768
sqft
|
built
2000
8707 Westbrook Forest Dr, Sugar Land, TX 77479
$-1,100
Cash flow
-9.3%
Cash-on-Cash Return
4.1%
Cap rate
0.5%
Rent to Value Ratio
Active
$599,995
5
bds
|
0
ba
|
3,856
sqft
|
built
1992
6506 Taimer Ct, Sugar Land, TX 77479
$-1,652
Cash flow
-14.4%
Cash-on-Cash Return
3.0%
Cap rate
0.6%
Rent to Value Ratio

Active
$439,000
4
bds
|
0
ba
|
2,412
sqft
|
built
2011
2403 Ranna Ct, Sugar Land, TX 77498
$-1,264
Cash flow
-15.0%
Cash-on-Cash Return
2.8%
Cap rate
0.6%
Rent to Value Ratio
Active
$665,000
5
bds
|
0
ba
|
3,120
sqft
|
built
2005
3719 Arundel Gardens Ln, Sugar Land, TX 77498
$-2,155
Cash flow
-16.9%
Cash-on-Cash Return
2.4%
Cap rate
0.4%
Rent to Value Ratio
Active
$695,000
4
bds
|
0
ba
|
3,117
sqft
|
built
1997
6219 Mound Airy Ct, Sugar Land, TX 77479
$-2,468
Cash flow
-18.5%
Cash-on-Cash Return
2.0%
Cap rate
0.5%
Rent to Value Ratio

Active
$325,786
4
bds
|
0
ba
|
1,904
sqft
|
built
1989
2031 Summerfield Pl, Sugar Land, TX 77478
$-589
Cash flow
-9.4%
Cash-on-Cash Return
4.1%
Cap rate
0.7%
Rent to Value Ratio
Active
$599,000
4
bds
|
0
ba
|
2,710
sqft
|
built
2000
8303 Big Bend Dr, Sugar Land, TX 77479
$-2,069
Cash flow
-18.0%
Cash-on-Cash Return
2.1%
Cap rate
0.5%
Rent to Value Ratio
Active
$325,000
3
bds
|
0
ba
|
2,439
sqft
|
built
2002
16306 Soaring Eagle Dr, Sugar Land, TX 77498
$-215
Cash flow
-3.5%
Cash-on-Cash Return
5.5%
Cap rate
0.7%
Rent to Value Ratio
Active
$280,000
3
bds
|
0
ba
|
1,461
sqft
|
built
1978
2530 Long Reach Dr, Sugar Land, TX 77478
$-555
Cash flow
-10.3%
Cash-on-Cash Return
3.9%
Cap rate
0.7%
Rent to Value Ratio
Active
$879,888
5
bds
|
0
ba
|
4,181
sqft
|
built
2006
7003 Paxton Ct, Sugar Land, TX 77479
$-3,523
Cash flow
-20.9%
Cash-on-Cash Return
1.5%
Cap rate
0.4%
Rent to Value Ratio
Active
$369,999
4
bds
|
0
ba
|
2,448
sqft
|
built
1988
6311 Laurel Bush Ln, Sugar Land, TX 77479
$-828
Cash flow
-11.7%
Cash-on-Cash Return
3.6%
Cap rate
0.7%
Rent to Value Ratio
Active
$235,000
2
bds
|
0
ba
|
1,226
sqft
|
built
1982
2922 Whetrock Ln, Sugar Land, TX 77479
$-555
Cash flow
-12.3%
Cash-on-Cash Return
2.8%
Cap rate
0.6%
Rent to Value Ratio
Active
$1,299,000
4
bds
|
0
ba
|
4,804
sqft
|
built
2010
407 Pickney Ave, Sugar Land, TX 77479
$-4,307
Cash flow
-17.3%
Cash-on-Cash Return
2.3%
Cap rate
0.5%
Rent to Value Ratio

Active
$579,500
4
bds
|
0
ba
|
2,885
sqft
|
built
1993
17422 Marigold Dr, Sugar Land, TX 77479
$-1,422
Cash flow
-12.8%
Cash-on-Cash Return
2.7%
Cap rate
0.5%
Rent to Value Ratio
Active
$448,500
4
bds
|
0
ba
|
2,265
sqft
|
built
1997
1123 Woodley Bnd, Sugar Land, TX 77479
$-1,171
Cash flow
-13.6%
Cash-on-Cash Return
2.5%
Cap rate
0.6%
Rent to Value Ratio
Active
$324,500
4
bds
|
0
ba
|
2,047
sqft
|
built
1995
16926 Pheasant Ridge Dr, Sugar Land, TX 77498
$-704
Cash flow
-11.3%
Cash-on-Cash Return
3.1%
Cap rate
0.7%
Rent to Value Ratio
Active
$550,000
3
bds
|
0
ba
|
2,950
sqft
|
built
2001
8826 Rippling Water Dr, Sugar Land, TX 77479
$-1,092
Cash flow
-10.4%
Cash-on-Cash Return
3.3%
Cap rate
0.7%
Rent to Value Ratio