Sugar Land, TX Investment Properties for Sale
Browse homes for sale and investment properties in Sugar Land, TX. Refine your search by price, property type, or more.
Best cash flowing properties in Sugar Land, TX
Active
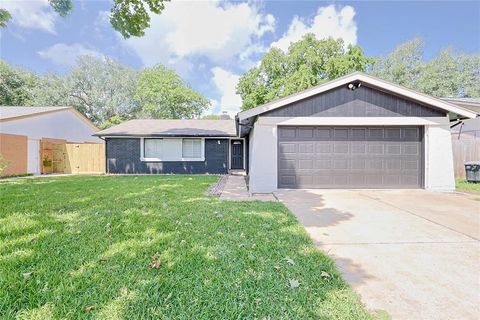
$269,900
3
bds
|
0
ba
|
1,488
sqft
|
built
1977
9910 Kent Towne Ln, Sugar Land, TX 77498
$-60
Cash flow
-1.2%
Cash-on-Cash Return
6.0%
Cap rate
0.7%
Rent to Value Ratio

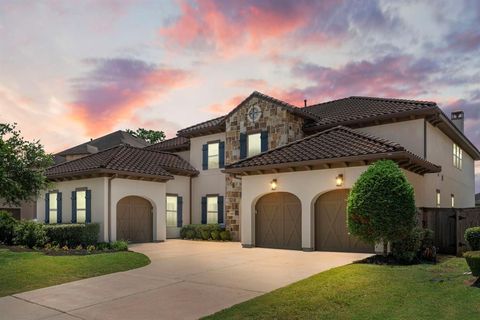
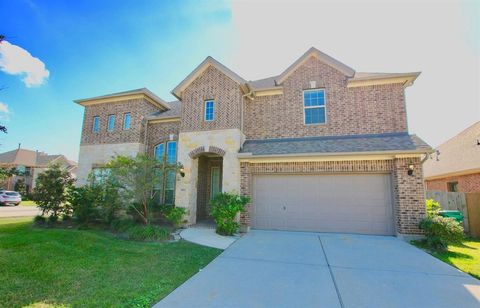
Active
$345,000
4
bds
|
0
ba
|
2,562
sqft
|
built
2002
14910 Sugar Crystal Ct, Sugar Land, TX 77498
$-258
Cash flow
-3.9%
Cash-on-Cash Return
5.4%
Cap rate
0.7%
Rent to Value Ratio
428 out of 519 properties for sale in Sugar Land, TX
Limited Results Shown
Create a free account, or log in to reveal all property listings and enjoy the complete experience.
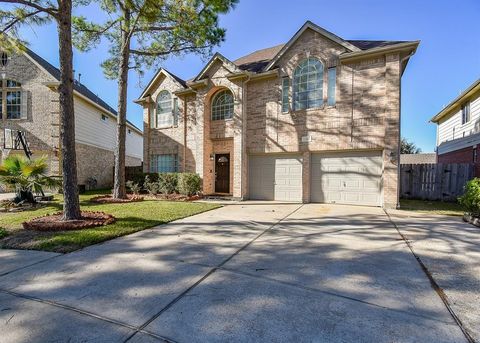
Active
$1,249,990
4
bds
|
0
ba
|
4,536
sqft
|
built
2015
6407 Caparra Rock Ln, Sugar Land, TX 77479
$-5,119
Cash flow
-21.4%
Cash-on-Cash Return
1.4%
Cap rate
0.4%
Rent to Value Ratio

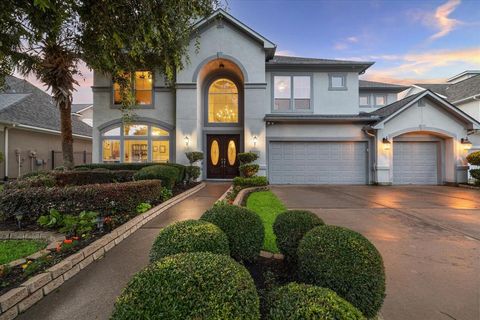
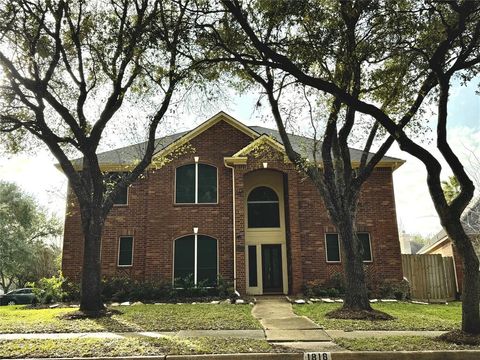
Active
$369,000
3
bds
|
0
ba
|
2,142
sqft
|
built
1977
1819 Redwood Ct, Sugar Land, TX 77498
$-875
Cash flow
-12.4%
Cash-on-Cash Return
3.4%
Cap rate
0.6%
Rent to Value Ratio
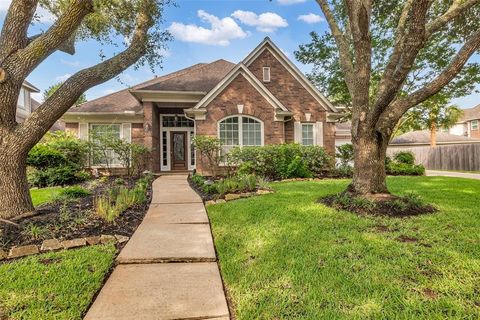
Active
$459,000
4
bds
|
0
ba
|
2,784
sqft
|
built
2000
12418 Ashford Valley Dr, Sugar Land, TX 77478
$-1,214
Cash flow
-13.8%
Cash-on-Cash Return
3.1%
Cap rate
0.6%
Rent to Value Ratio
Active
$1,095,000
5
bds
|
0
ba
|
4,676
sqft
|
built
2003
5214 Harvest Bend Ct, Sugar Land, TX 77479
$-2,979
Cash flow
-14.2%
Cash-on-Cash Return
3.0%
Cap rate
0.6%
Rent to Value Ratio
Active
$749,900
5
bds
|
0
ba
|
4,428
sqft
|
built
1998
7434 Guinevere Dr, Sugar Land, TX 77479
$-2,087
Cash flow
-14.5%
Cash-on-Cash Return
2.9%
Cap rate
0.6%
Rent to Value Ratio
Active
$679,995
5
bds
|
0
ba
|
3,947
sqft
|
built
2015
3811 Pearl Pass Ln, Sugar Land, TX 77479
$-2,317
Cash flow
-17.8%
Cash-on-Cash Return
2.2%
Cap rate
0.5%
Rent to Value Ratio
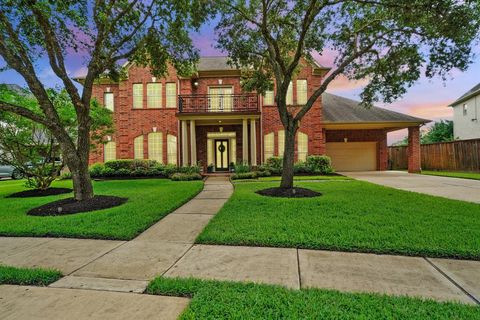
Active
$559,500
5
bds
|
0
ba
|
2,979
sqft
|
built
1997
1818 Maidenhair Ln, Sugar Land, TX 77479
$-1,564
Cash flow
-14.6%
Cash-on-Cash Return
2.9%
Cap rate
0.6%
Rent to Value Ratio

Active
$438,000
4
bds
|
0
ba
|
2,561
sqft
|
built
1980
1646 Creekside Dr, Sugar Land, TX 77478
$-649
Cash flow
-7.7%
Cash-on-Cash Return
4.5%
Cap rate
0.7%
Rent to Value Ratio
Active
$795,000
5
bds
|
0
ba
|
4,323
sqft
|
built
1998
1930 Crisfield Dr, Sugar Land, TX 77479
$-2,644
Cash flow
-17.4%
Cash-on-Cash Return
2.3%
Cap rate
0.5%
Rent to Value Ratio
Active
$639,000
3
bds
|
0
ba
|
3,352
sqft
|
built
1999
7726 Northwoods Dr, Sugar Land, TX 77479
$-2,030
Cash flow
-16.6%
Cash-on-Cash Return
2.5%
Cap rate
0.5%
Rent to Value Ratio

Active
$320,000
3
bds
|
0
ba
|
2,105
sqft
|
built
1976
1102 Ashdale Dr, Sugar Land, TX 77498
$-749
Cash flow
-12.2%
Cash-on-Cash Return
3.5%
Cap rate
0.6%
Rent to Value Ratio

Active
$420,000
5
bds
|
0
ba
|
2,272
sqft
|
built
1981
417 W Hillary Cir, Sugar Land, TX 77498
$-945
Cash flow
-11.7%
Cash-on-Cash Return
3.6%
Cap rate
0.6%
Rent to Value Ratio

Active
$326,990
3
bds
|
0
ba
|
2,074
sqft
|
built
1994
4210 W Meadows Dr, Sugar Land, TX 77479
$-665
Cash flow
-10.6%
Cash-on-Cash Return
3.8%
Cap rate
0.7%
Rent to Value Ratio
Active
$1,100,000
4
bds
|
0
ba
|
4,352
sqft
|
built
2008
902 Delford Way, Sugar Land, TX 77479
$-4,645
Cash flow
-22.0%
Cash-on-Cash Return
1.2%
Cap rate
0.4%
Rent to Value Ratio

Active
$435,000
3
bds
|
0
ba
|
2,424
sqft
|
built
1983
815 Millpond Dr, Sugar Land, TX 77498
$-1,183
Cash flow
-14.2%
Cash-on-Cash Return
3.0%
Cap rate
0.6%
Rent to Value Ratio
Active
$399,000
4
bds
|
0
ba
|
2,315
sqft
|
built
1995
218 Windrift Ct, Sugar Land, TX 77479
$-927
Cash flow
-12.1%
Cash-on-Cash Return
3.5%
Cap rate
0.7%
Rent to Value Ratio
Active
$600,000
5
bds
|
0
ba
|
3,205
sqft
|
built
1989
2027 Richland Ct, Sugar Land, TX 77478
$-1,770
Cash flow
-15.4%
Cash-on-Cash Return
2.7%
Cap rate
0.5%
Rent to Value Ratio

Active
$6,995,000
6
bds
|
0
ba
|
17,020
sqft
|
built
2005
21 Grand Mnr, Sugar Land, TX 77479
$-36,070
Cash flow
-26.9%
Cash-on-Cash Return
0.1%
Cap rate
0.1%
Rent to Value Ratio
Active
$510,000
4
bds
|
0
ba
|
2,655
sqft
|
built
1994
4807 Louisa Ct, Sugar Land, TX 77478
$-1,505
Cash flow
-15.4%
Cash-on-Cash Return
2.7%
Cap rate
0.5%
Rent to Value Ratio
Active
$426,999
4
bds
|
0
ba
|
2,265
sqft
|
built
1998
1111 Cambrian Park Ct, Sugar Land, TX 77479
$-1,241
Cash flow
-15.2%
Cash-on-Cash Return
2.8%
Cap rate
0.6%
Rent to Value Ratio

Active
$970,000
4
bds
|
0
ba
|
4,092
sqft
|
built
2011
6223 Duke Trail Ln, Sugar Land, TX 77479
$-3,913
Cash flow
-21.0%
Cash-on-Cash Return
1.4%
Cap rate
0.4%
Rent to Value Ratio

Active
$369,500
5
bds
|
0
ba
|
2,267
sqft
|
built
1981
3022 Sam Houston Dr, Sugar Land, TX 77479
$-828
Cash flow
-11.7%
Cash-on-Cash Return
3.6%
Cap rate
0.6%
Rent to Value Ratio
Active
$345,000
4
bds
|
0
ba
|
2,562
sqft
|
built
2002
14910 Sugar Crystal Ct, Sugar Land, TX 77498
$-258
Cash flow
-3.9%
Cash-on-Cash Return
5.4%
Cap rate
0.7%
Rent to Value Ratio
Active
$418,000
4
bds
|
0
ba
|
2,647
sqft
|
built
1990
235 Cedar Elm Ln, Sugar Land, TX 77479
$-1,161
Cash flow
-14.5%
Cash-on-Cash Return
2.9%
Cap rate
0.6%
Rent to Value Ratio
Active
$415,000
4
bds
|
0
ba
|
2,378
sqft
|
built
1982
2814 River Birch Dr, Sugar Land, TX 77479
$-1,179
Cash flow
-14.8%
Cash-on-Cash Return
2.9%
Cap rate
0.6%
Rent to Value Ratio

Active
$234,500
2
bds
|
0
ba
|
1,330
sqft
|
built
2002
2710 Grants Lake Blvd, Sugar Land, TX 77479
$-477
Cash flow
-10.6%
Cash-on-Cash Return
3.8%
Cap rate
0.8%
Rent to Value Ratio
Active
$875,800
5
bds
|
0
ba
|
4,002
sqft
|
built
2013
5822 Crawford Hill Ln, Sugar Land, TX 77479
$-2,840
Cash flow
-16.9%
Cash-on-Cash Return
2.4%
Cap rate
0.5%
Rent to Value Ratio
Active
$1,495,000
4
bds
|
0
ba
|
4,362
sqft
|
built
1997
4111 Thistle Hill Ct, Sugar Land, TX 77479
$-6,894
Cash flow
-24.1%
Cash-on-Cash Return
0.7%
Cap rate
0.3%
Rent to Value Ratio
Active
$269,900
3
bds
|
0
ba
|
1,488
sqft
|
built
1977
9910 Kent Towne Ln, Sugar Land, TX 77498
$-60
Cash flow
-1.2%
Cash-on-Cash Return
6.0%
Cap rate
0.7%
Rent to Value Ratio
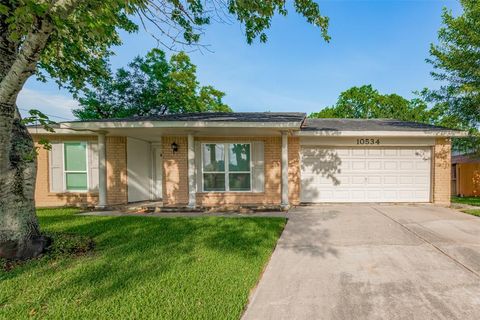
Active
$269,786
3
bds
|
0
ba
|
1,584
sqft
|
built
1977
10534 Towne Square Rd, Sugar Land, TX 77498
$-622
Cash flow
-12.0%
Cash-on-Cash Return
3.5%
Cap rate
0.7%
Rent to Value Ratio
Active
$348,000
3
bds
|
0
ba
|
2,182
sqft
|
built
1999
12723 Orchard Summit Dr, Sugar Land, TX 77498
$-970
Cash flow
-14.5%
Cash-on-Cash Return
2.9%
Cap rate
0.6%
Rent to Value Ratio

Active
$680,000
5
bds
|
0
ba
|
3,938
sqft
|
built
1973
619 Chevy Chase Cir, Sugar Land, TX 77478
$-1,775
Cash flow
-13.6%
Cash-on-Cash Return
3.1%
Cap rate
0.6%
Rent to Value Ratio
Active
$194,990
2
bds
|
0
ba
|
977
sqft
|
built
1983
2611 Grants Lake Blvd, Sugar Land, TX 77479
$-670
Cash flow
-17.9%
Cash-on-Cash Return
2.1%
Cap rate
0.8%
Rent to Value Ratio
Active
$349,999
4
bds
|
0
ba
|
2,359
sqft
|
built
1997
15310 Cobblestone Point Ct, Sugar Land, TX 77498
$-700
Cash flow
-10.4%
Cash-on-Cash Return
3.9%
Cap rate
0.7%
Rent to Value Ratio

Active
$499,999
6
bds
|
0
ba
|
3,311
sqft
|
built
2002
3110 Aspen Hollow Ln, Sugar Land, TX 77479
$-550
Cash flow
-5.7%
Cash-on-Cash Return
4.9%
Cap rate
0.6%
Rent to Value Ratio

Active
$355,000
5
bds
|
0
ba
|
2,420
sqft
|
built
1986
6403 Laurel Bush Ln, Sugar Land, TX 77479
$-809
Cash flow
-11.9%
Cash-on-Cash Return
3.5%
Cap rate
0.7%
Rent to Value Ratio

Active
$335,000
4
bds
|
0
ba
|
2,313
sqft
|
built
1995
3107 Pheasant Trail Dr, Sugar Land, TX 77498
$-853
Cash flow
-13.3%
Cash-on-Cash Return
3.2%
Cap rate
0.7%
Rent to Value Ratio
Active
$869,000
5
bds
|
0
ba
|
3,594
sqft
|
built
2015
5515 Mangrove Creek Ln, Sugar Land, TX 77479
$-2,884
Cash flow
-17.3%
Cash-on-Cash Return
2.3%
Cap rate
0.4%
Rent to Value Ratio

Active
$470,000
4
bds
|
0
ba
|
2,854
sqft
|
built
1988
1318 N Gabriel River Cir, Sugar Land, TX 77478
$-1,180
Cash flow
-13.1%
Cash-on-Cash Return
3.3%
Cap rate
0.6%
Rent to Value Ratio
Active
$452,000
4
bds
|
0
ba
|
2,436
sqft
|
built
1981
2442 Hodges Bend Cir, Sugar Land, TX 77479
$-1,561
Cash flow
-18.0%
Cash-on-Cash Return
2.1%
Cap rate
0.5%
Rent to Value Ratio