Sugar Land, TX Investment Properties for Sale
Browse homes for sale and investment properties in Sugar Land, TX. Refine your search by price, property type, or more.
Best cash flowing properties in Sugar Land, TX
Active
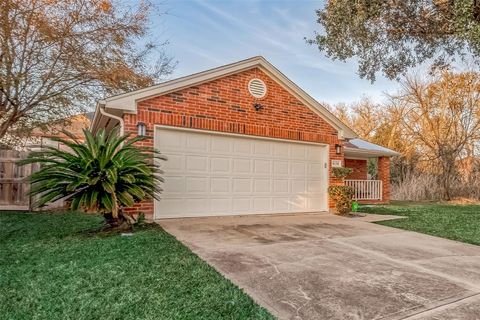
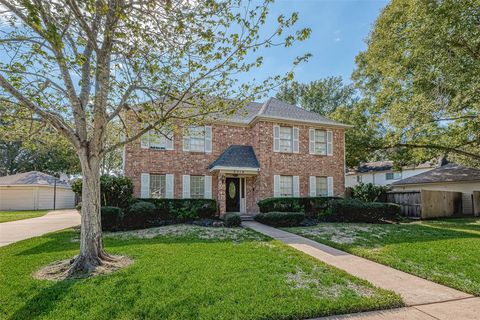
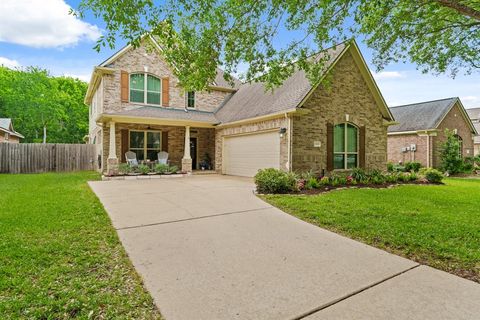
$319,000
3
bds
|
0
ba
|
1,762
sqft
|
built
2000
16310 Blossomwood Ln, Sugar Land, TX 77498
$-184
Cash flow
-3.0%
Cash-on-Cash Return
5.6%
Cap rate
0.7%
Rent to Value Ratio

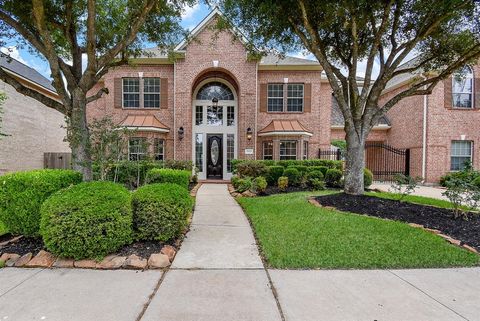
Active
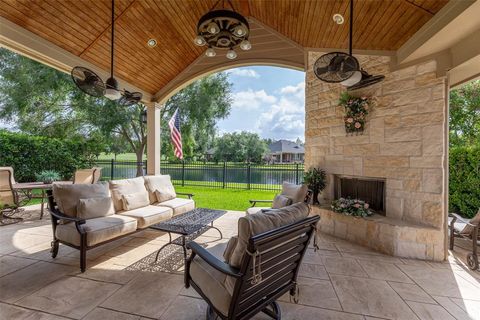
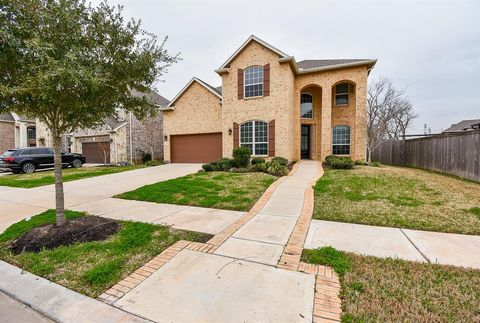
$300,000
4
bds
|
0
ba
|
1,824
sqft
|
built
1983
2214 S Ferrisburg Ct, Sugar Land, TX 77478
$-498
Cash flow
-8.7%
Cash-on-Cash Return
4.3%
Cap rate
0.7%
Rent to Value Ratio
428 out of 519 properties for sale in Sugar Land, TX
Limited Results Shown
Create a free account, or log in to reveal all property listings and enjoy the complete experience.
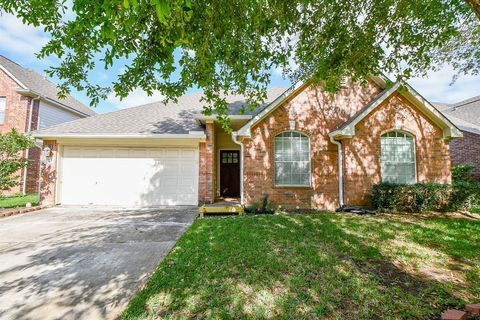
Active
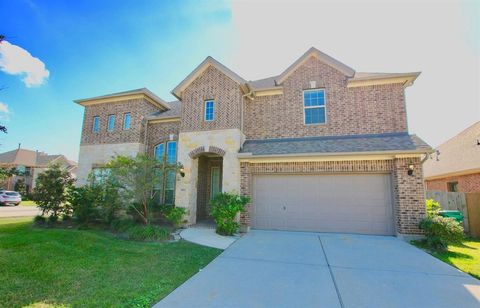
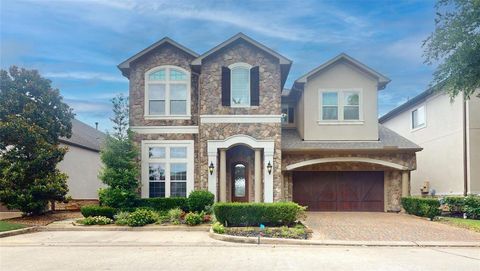
$564,900
3
bds
|
0
ba
|
2,597
sqft
|
built
2001
8727 Rippling Water Dr, Sugar Land, TX 77479
$-1,855
Cash flow
-17.1%
Cash-on-Cash Return
2.3%
Cap rate
0.5%
Rent to Value Ratio

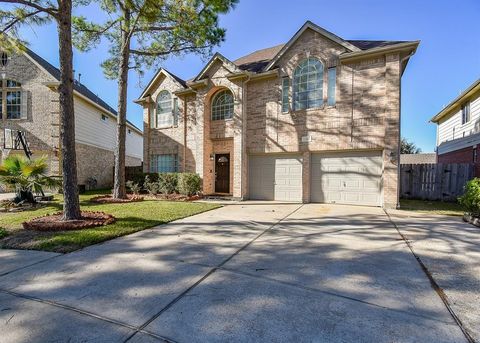
Active
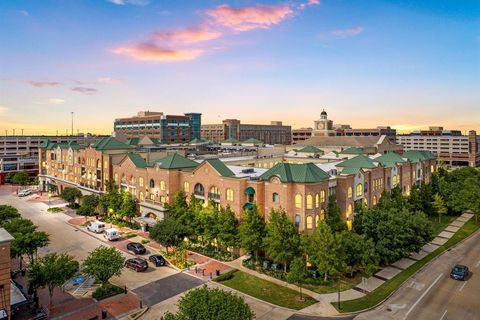
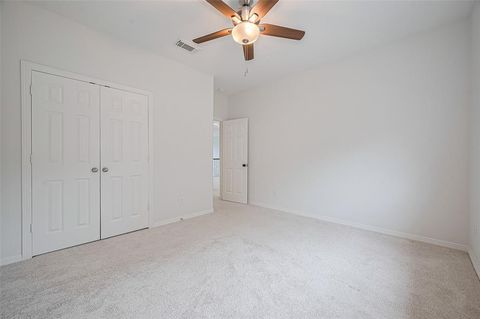
$589,000
5
bds
|
0
ba
|
3,807
sqft
|
built
2003
2614 Sunset Lake Dr, Sugar Land, TX 77478
$-1,534
Cash flow
-13.6%
Cash-on-Cash Return
3.1%
Cap rate
0.6%
Rent to Value Ratio

Active
$330,000
3
bds
|
0
ba
|
2,011
sqft
|
built
1991
1207 Green Knoll Dr, Sugar Land, TX 77479
$-869
Cash flow
-13.7%
Cash-on-Cash Return
3.1%
Cap rate
0.7%
Rent to Value Ratio

Active
$399,900
3
bds
|
0
ba
|
2,465
sqft
|
built
1991
6615 Cypress Village Dr, Sugar Land, TX 77479
$-1,047
Cash flow
-13.7%
Cash-on-Cash Return
3.1%
Cap rate
0.7%
Rent to Value Ratio
Active
$319,000
3
bds
|
0
ba
|
1,762
sqft
|
built
2000
16310 Blossomwood Ln, Sugar Land, TX 77498
$-184
Cash flow
-3.0%
Cash-on-Cash Return
5.6%
Cap rate
0.7%
Rent to Value Ratio
Active
$300,000
4
bds
|
0
ba
|
1,824
sqft
|
built
1983
2214 S Ferrisburg Ct, Sugar Land, TX 77478
$-498
Cash flow
-8.7%
Cash-on-Cash Return
4.3%
Cap rate
0.7%
Rent to Value Ratio
Active
$679,995
5
bds
|
0
ba
|
3,947
sqft
|
built
2015
3811 Pearl Pass Ln, Sugar Land, TX 77479
$-2,317
Cash flow
-17.8%
Cash-on-Cash Return
2.2%
Cap rate
0.5%
Rent to Value Ratio

Active
$539,000
3
bds
|
0
ba
|
2,654
sqft
|
built
2016
726 Imperial Blvd, Sugar Land, TX 77498
$-1,784
Cash flow
-17.3%
Cash-on-Cash Return
2.3%
Cap rate
0.6%
Rent to Value Ratio
Active
$299,500
1
bds
|
0
ba
|
793
sqft
|
built
2004
2299 Lone Star Dr, Sugar Land, TX 77479
$-1,246
Cash flow
-21.7%
Cash-on-Cash Return
1.3%
Cap rate
0.6%
Rent to Value Ratio
Active
$409,500
4
bds
|
0
ba
|
2,504
sqft
|
built
1978
2510 Wind Fall Ln, Sugar Land, TX 77479
$-1,120
Cash flow
-14.3%
Cash-on-Cash Return
3.0%
Cap rate
0.6%
Rent to Value Ratio
Active
$739,500
5
bds
|
0
ba
|
3,263
sqft
|
built
2020
4510 Shaded Arbor Way, Sugar Land, TX 77479
$-2,286
Cash flow
-16.1%
Cash-on-Cash Return
2.6%
Cap rate
0.5%
Rent to Value Ratio

Active
$280,000
4
bds
|
0
ba
|
1,421
sqft
|
built
1970
13642 Greenridge Dr, Sugar Land, TX 77498
$-637
Cash flow
-11.9%
Cash-on-Cash Return
3.5%
Cap rate
0.6%
Rent to Value Ratio
Active
$1,050,000
3
bds
|
0
ba
|
3,312
sqft
|
built
2013
902 Oyster Bank Cir, Sugar Land, TX 77478
$-3,316
Cash flow
-16.5%
Cash-on-Cash Return
2.5%
Cap rate
0.5%
Rent to Value Ratio
Active
$475,000
4
bds
|
0
ba
|
2,560
sqft
|
built
2008
4142 Regal Stone Ln, Sugar Land, TX 77479
$-1,622
Cash flow
-17.8%
Cash-on-Cash Return
2.2%
Cap rate
0.5%
Rent to Value Ratio
Active
$289,888
3
bds
|
0
ba
|
1,620
sqft
|
built
1999
13415 Naples Bridge Rd, Sugar Land, TX 77498
$-591
Cash flow
-10.6%
Cash-on-Cash Return
3.8%
Cap rate
0.7%
Rent to Value Ratio

Active
$2,150,000
5
bds
|
0
ba
|
5,782
sqft
|
built
2013
5006 Water View Bnd, Sugar Land, TX 77479
$-10,276
Cash flow
-24.9%
Cash-on-Cash Return
0.5%
Cap rate
0.2%
Rent to Value Ratio

Active
$399,900
4
bds
|
0
ba
|
2,612
sqft
|
built
1983
2926 Field Line Dr, Sugar Land, TX 77479
$-952
Cash flow
-12.4%
Cash-on-Cash Return
3.4%
Cap rate
0.7%
Rent to Value Ratio

Active
$369,000
3
bds
|
0
ba
|
2,142
sqft
|
built
1977
1819 Redwood Ct, Sugar Land, TX 77498
$-875
Cash flow
-12.4%
Cash-on-Cash Return
3.4%
Cap rate
0.6%
Rent to Value Ratio

Active
$320,000
3
bds
|
0
ba
|
2,105
sqft
|
built
1976
1102 Ashdale Dr, Sugar Land, TX 77498
$-749
Cash flow
-12.2%
Cash-on-Cash Return
3.5%
Cap rate
0.6%
Rent to Value Ratio

Active
$375,000
3
bds
|
0
ba
|
1,907
sqft
|
built
1978
2543 Sage Brush Ln, Sugar Land, TX 77479
$-894
Cash flow
-12.4%
Cash-on-Cash Return
3.4%
Cap rate
0.6%
Rent to Value Ratio
Active
$445,000
5
bds
|
0
ba
|
2,500
sqft
|
built
1981
902 Rolling Mill Dr, Sugar Land, TX 77498
$-1,038
Cash flow
-12.2%
Cash-on-Cash Return
3.5%
Cap rate
0.6%
Rent to Value Ratio

Active
$929,500
5
bds
|
0
ba
|
4,198
sqft
|
built
2004
5407 Oakville Ct, Sugar Land, TX 77479
$-3,461
Cash flow
-19.4%
Cash-on-Cash Return
1.8%
Cap rate
0.4%
Rent to Value Ratio
Active
$319,000
3
bds
|
0
ba
|
1,680
sqft
|
built
1992
2902 Secluded Dr, Sugar Land, TX 77498
$-811
Cash flow
-13.3%
Cash-on-Cash Return
3.2%
Cap rate
0.6%
Rent to Value Ratio
Active
$335,000
4
bds
|
0
ba
|
2,417
sqft
|
built
1978
10522 Gulfstream Ln, Sugar Land, TX 77498
$-644
Cash flow
-10.0%
Cash-on-Cash Return
4.0%
Cap rate
0.7%
Rent to Value Ratio

Active
$499,988
4
bds
|
0
ba
|
3,542
sqft
|
built
2001
13226 Dusty Grove Ln, Sugar Land, TX 77498
$-1,571
Cash flow
-16.4%
Cash-on-Cash Return
2.5%
Cap rate
0.6%
Rent to Value Ratio
Active
$449,000
4
bds
|
0
ba
|
3,058
sqft
|
built
2002
13115 Parkbrook Way Ln, Sugar Land, TX 77498
$-1,260
Cash flow
-14.6%
Cash-on-Cash Return
2.9%
Cap rate
0.6%
Rent to Value Ratio
Active
$949,500
4
bds
|
0
ba
|
4,403
sqft
|
built
2008
1611 Whitfield St, Sugar Land, TX 77479
$-4,124
Cash flow
-22.7%
Cash-on-Cash Return
1.1%
Cap rate
0.4%
Rent to Value Ratio

Active
$499,000
4
bds
|
0
ba
|
2,724
sqft
|
built
1983
1030 Oyster Bay Dr, Sugar Land, TX 77478
$-1,304
Cash flow
-13.6%
Cash-on-Cash Return
3.1%
Cap rate
0.6%
Rent to Value Ratio
Active
$359,000
3
bds
|
0
ba
|
2,018
sqft
|
built
2001
1143 Oxford Mills Ln, Sugar Land, TX 77479
$-925
Cash flow
-13.4%
Cash-on-Cash Return
3.2%
Cap rate
0.7%
Rent to Value Ratio

Active
$490,000
5
bds
|
0
ba
|
3,516
sqft
|
built
1997
11943 Natural Bridges Ln, Sugar Land, TX 77498
$-1,478
Cash flow
-15.7%
Cash-on-Cash Return
2.6%
Cap rate
0.6%
Rent to Value Ratio

Active
$499,000
4
bds
|
0
ba
|
2,909
sqft
|
built
1993
1103 Glendale Dr, Sugar Land, TX 77479
$-1,390
Cash flow
-14.5%
Cash-on-Cash Return
2.9%
Cap rate
0.6%
Rent to Value Ratio

Active
$459,000
4
bds
|
0
ba
|
2,239
sqft
|
built
1984
3010 W Steepbank Cir, Sugar Land, TX 77479
$-1,379
Cash flow
-15.7%
Cash-on-Cash Return
2.7%
Cap rate
0.5%
Rent to Value Ratio
Active
$459,000
4
bds
|
0
ba
|
2,784
sqft
|
built
2000
12418 Ashford Valley Dr, Sugar Land, TX 77478
$-1,214
Cash flow
-13.8%
Cash-on-Cash Return
3.1%
Cap rate
0.6%
Rent to Value Ratio
Active
$1,095,000
5
bds
|
0
ba
|
4,676
sqft
|
built
2003
5214 Harvest Bend Ct, Sugar Land, TX 77479
$-2,979
Cash flow
-14.2%
Cash-on-Cash Return
3.0%
Cap rate
0.6%
Rent to Value Ratio
Active
$639,000
3
bds
|
0
ba
|
3,352
sqft
|
built
1999
7726 Northwoods Dr, Sugar Land, TX 77479
$-2,030
Cash flow
-16.6%
Cash-on-Cash Return
2.5%
Cap rate
0.5%
Rent to Value Ratio

Active
$749,900
5
bds
|
0
ba
|
4,488
sqft
|
built
2013
4210 Moss Cove Ct, Sugar Land, TX 77479
$-2,109
Cash flow
-14.7%
Cash-on-Cash Return
2.9%
Cap rate
0.6%
Rent to Value Ratio

Active
$509,000
3
bds
|
0
ba
|
2,135
sqft
|
built
2014
442 Imperial Blvd, Sugar Land, TX 77498
$-1,610
Cash flow
-16.5%
Cash-on-Cash Return
2.5%
Cap rate
0.6%
Rent to Value Ratio

Active
$3,500,000
3
bds
|
0
ba
|
4,940
sqft
|
built
2014
15618 Oyster Cove Dr, Sugar Land, TX 77478
$-18,056
Cash flow
-26.9%
Cash-on-Cash Return
0.1%
Cap rate
0.1%
Rent to Value Ratio
Active
$1,118,880
5
bds
|
0
ba
|
4,858
sqft
|
built
2006
7010 Mc Clellan Ln, Sugar Land, TX 77479
$-4,861
Cash flow
-22.7%
Cash-on-Cash Return
1.1%
Cap rate
0.4%
Rent to Value Ratio
Active
$749,900
5
bds
|
0
ba
|
4,428
sqft
|
built
1998
7434 Guinevere Dr, Sugar Land, TX 77479
$-2,087
Cash flow
-14.5%
Cash-on-Cash Return
2.9%
Cap rate
0.6%
Rent to Value Ratio