Sugar Land, TX Investment Properties for Sale
Browse homes for sale and investment properties in Sugar Land, TX. Refine your search by price, property type, or more.
Best cash flowing properties in Sugar Land, TX

Active
$203,500
3
bds
|
0
ba
|
990
sqft
|
built
1963
106 Avenue G, Sugar Land, TX 77498
$318
Cash flow
8.2%
Cash-on-Cash Return
8.1%
Cap rate
1.0%
Rent to Value Ratio
Active
$318,000
5
bds
|
0
ba
|
2,355
sqft
|
built
2005
9726 Angleside Ln, Sugar Land, TX 77498
$-108
Cash flow
-1.8%
Cash-on-Cash Return
5.9%
Cap rate
0.7%
Rent to Value Ratio
428 out of 519 properties for sale in Sugar Land, TX
Limited Results Shown
Create a free account, or log in to reveal all property listings and enjoy the complete experience.

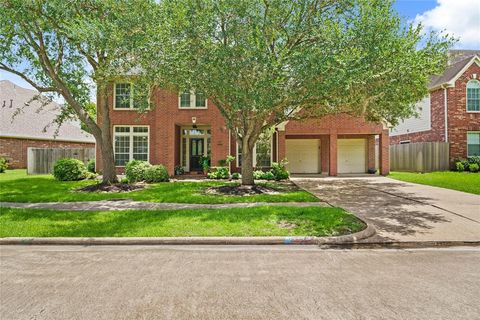
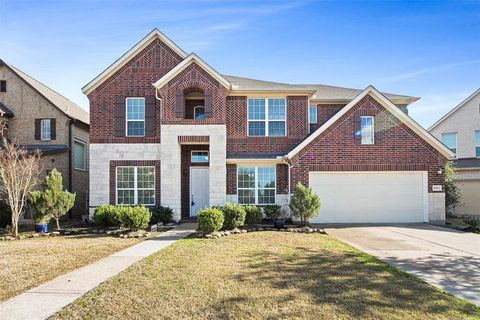
Active
$615,000
4
bds
|
0
ba
|
3,296
sqft
|
built
1997
1902 Rosebay Ct, Sugar Land, TX 77479
$-1,809
Cash flow
-15.3%
Cash-on-Cash Return
2.7%
Cap rate
0.5%
Rent to Value Ratio
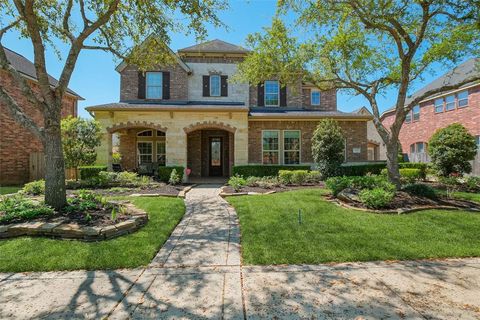
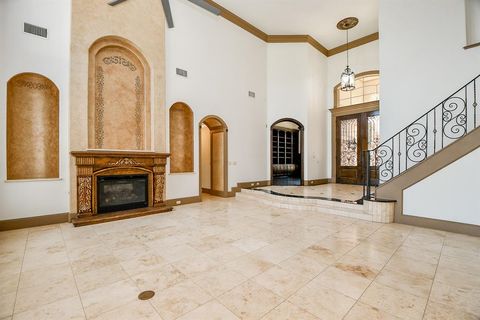
Active
$660,000
6
bds
|
0
ba
|
3,767
sqft
|
built
2002
14326 Tasmania Ct, Sugar Land, TX 77498
$-2,216
Cash flow
-17.5%
Cash-on-Cash Return
2.2%
Cap rate
0.5%
Rent to Value Ratio

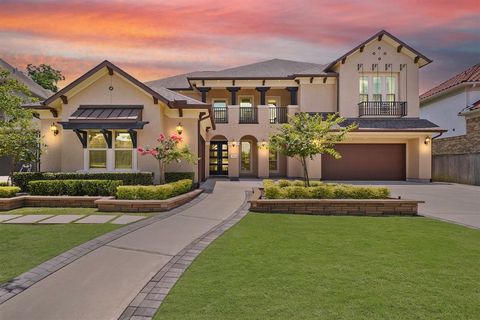
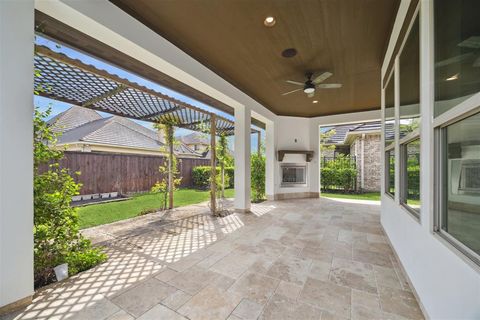
Active
$544,990
4
bds
|
0
ba
|
3,094
sqft
|
built
2013
6507 Loralie Ln, Sugar Land, TX 77479
$-1,481
Cash flow
-14.2%
Cash-on-Cash Return
3.0%
Cap rate
0.7%
Rent to Value Ratio
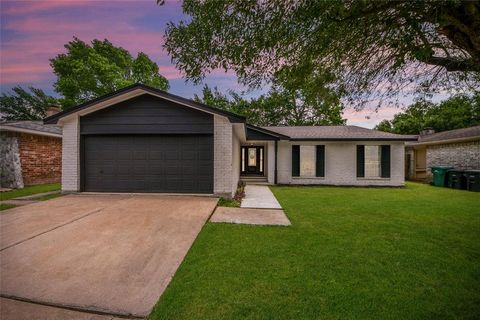
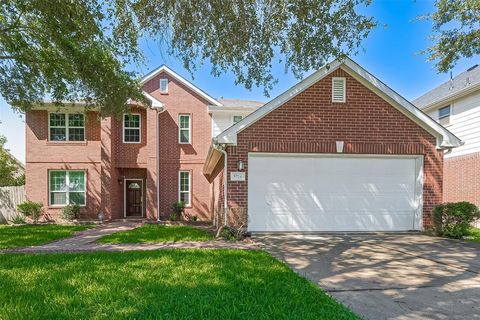
Active
$1,179,000
5
bds
|
0
ba
|
4,447
sqft
|
built
2001
19 Royal Hampton Ct, Sugar Land, TX 77479
$-4,924
Cash flow
-21.8%
Cash-on-Cash Return
1.3%
Cap rate
0.4%
Rent to Value Ratio

Active
$648,900
3
bds
|
0
ba
|
3,092
sqft
|
built
2000
5527 Chesapeake Pl, Sugar Land, TX 77479
$-1,959
Cash flow
-15.8%
Cash-on-Cash Return
2.6%
Cap rate
0.5%
Rent to Value Ratio

Active
$449,000
5
bds
|
0
ba
|
3,212
sqft
|
built
1998
4702 Plato Park Dr, Sugar Land, TX 77479
$-1,029
Cash flow
-12.0%
Cash-on-Cash Return
3.5%
Cap rate
0.7%
Rent to Value Ratio
Active
$499,000
5
bds
|
0
ba
|
3,712
sqft
|
built
1998
11927 Natural Bridges Ln, Sugar Land, TX 77498
$-1,289
Cash flow
-13.5%
Cash-on-Cash Return
3.2%
Cap rate
0.6%
Rent to Value Ratio

Active
$850,000
4
bds
|
0
ba
|
4,200
sqft
|
built
1982
203 Laurel Springs Ct, Sugar Land, TX 77478
$-2,728
Cash flow
-16.7%
Cash-on-Cash Return
2.4%
Cap rate
0.5%
Rent to Value Ratio
Active
$555,000
4
bds
|
0
ba
|
3,606
sqft
|
built
2001
2227 Clawson Falls Ln, Sugar Land, TX 77479
$-1,551
Cash flow
-14.6%
Cash-on-Cash Return
2.9%
Cap rate
0.5%
Rent to Value Ratio

Active
$270,000
4
bds
|
0
ba
|
1,604
sqft
|
built
1975
10218 Towneview Dr, Sugar Land, TX 77498
$-626
Cash flow
-12.1%
Cash-on-Cash Return
3.5%
Cap rate
0.7%
Rent to Value Ratio

Active
$780,000
5
bds
|
0
ba
|
4,824
sqft
|
built
2009
5302 Briarwick Meadow Ln, Sugar Land, TX 77479
$-2,860
Cash flow
-19.1%
Cash-on-Cash Return
1.9%
Cap rate
0.5%
Rent to Value Ratio
Active
$812,500
5
bds
|
0
ba
|
4,204
sqft
|
built
2010
5206 Briarwick Meadow Ln, Sugar Land, TX 77479
$-2,392
Cash flow
-15.4%
Cash-on-Cash Return
2.7%
Cap rate
0.5%
Rent to Value Ratio

Active
$448,000
4
bds
|
0
ba
|
2,840
sqft
|
built
2000
15014 Cabin Run Ln, Sugar Land, TX 77498
$-1,275
Cash flow
-14.8%
Cash-on-Cash Return
2.9%
Cap rate
0.6%
Rent to Value Ratio

Active
$440,000
2
bds
|
0
ba
|
1,478
sqft
|
built
2004
2299 Lone Star Dr, Sugar Land, TX 77479
$-2,396
Cash flow
-28.4%
Cash-on-Cash Return
-0.3%
Cap rate
0.5%
Rent to Value Ratio
Active
$1,199,000
5
bds
|
0
ba
|
4,703
sqft
|
built
2018
6614 Tarrion Bay Ln, Sugar Land, TX 77479
$-4,745
Cash flow
-20.6%
Cash-on-Cash Return
1.5%
Cap rate
0.4%
Rent to Value Ratio

Active
$778,000
4
bds
|
0
ba
|
3,729
sqft
|
built
2000
5403 Emerald Pointe Ln, Sugar Land, TX 77479
$-2,652
Cash flow
-17.8%
Cash-on-Cash Return
2.2%
Cap rate
0.5%
Rent to Value Ratio

Active
$360,000
3
bds
|
0
ba
|
2,371
sqft
|
built
2005
14943 Sugar Peak Dr, Sugar Land, TX 77498
$-841
Cash flow
-12.2%
Cash-on-Cash Return
3.5%
Cap rate
0.6%
Rent to Value Ratio

Active
$499,900
4
bds
|
0
ba
|
2,351
sqft
|
built
1987
3214 Explorer Cv, Sugar Land, TX 77479
$-1,583
Cash flow
-16.5%
Cash-on-Cash Return
2.5%
Cap rate
0.5%
Rent to Value Ratio

Active
$5,250,000
5
bds
|
0
ba
|
12,011
sqft
|
built
2010
5 Cypress Valley Ct, Sugar Land, TX 77479
$-27,946
Cash flow
-27.8%
Cash-on-Cash Return
-0.1%
Cap rate
0.1%
Rent to Value Ratio
Active
$284,900
4
bds
|
0
ba
|
1,604
sqft
|
built
1974
10415 Towne Oak Ln, Sugar Land, TX 77498
$-667
Cash flow
-12.2%
Cash-on-Cash Return
3.5%
Cap rate
0.6%
Rent to Value Ratio
Active
$749,000
4
bds
|
0
ba
|
3,963
sqft
|
built
2014
4663 Rockton Hills Ln, Sugar Land, TX 77479
$-2,470
Cash flow
-17.2%
Cash-on-Cash Return
2.3%
Cap rate
0.5%
Rent to Value Ratio
Active
$3,000,000
6
bds
|
0
ba
|
8,350
sqft
|
built
2009
32 Miramar Heights Cir, Sugar Land, TX 77479
$-15,335
Cash flow
-26.7%
Cash-on-Cash Return
0.1%
Cap rate
0.2%
Rent to Value Ratio

Active
$415,000
4
bds
|
0
ba
|
3,110
sqft
|
built
1999
11322 Rock Bridge Ln, Sugar Land, TX 77498
$-744
Cash flow
-9.4%
Cash-on-Cash Return
4.1%
Cap rate
0.7%
Rent to Value Ratio
Active
$203,500
3
bds
|
0
ba
|
990
sqft
|
built
1963
106 Avenue G, Sugar Land, TX 77498
$318
Cash flow
8.2%
Cash-on-Cash Return
8.1%
Cap rate
1.0%
Rent to Value Ratio
Active
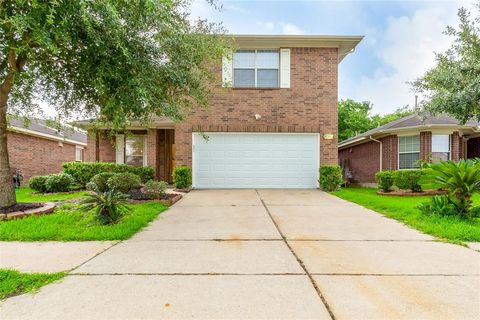
$680,000
3
bds
|
0
ba
|
2,419
sqft
|
built
2014
4014 Sundance Hill Ln, Sugar Land, TX 77479
$-1,997
Cash flow
-15.3%
Cash-on-Cash Return
2.7%
Cap rate
0.5%
Rent to Value Ratio

Active
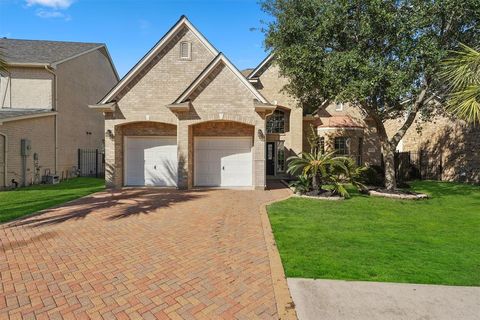
$648,880
3
bds
|
0
ba
|
2,623
sqft
|
built
2015
5131 Anthony Springs Ln, Sugar Land, TX 77479
$-2,205
Cash flow
-17.7%
Cash-on-Cash Return
2.2%
Cap rate
0.5%
Rent to Value Ratio

Active
$750,000
3
bds
|
0
ba
|
1,853
sqft
|
built
1958
414 Lakeview Dr, Sugar Land, TX 77498
$-2,849
Cash flow
-19.8%
Cash-on-Cash Return
1.7%
Cap rate
0.3%
Rent to Value Ratio
Active
$395,000
3
bds
|
0
ba
|
3,128
sqft
|
built
2001
5714 Ames Xing, Sugar Land, TX 77479
$-909
Cash flow
-12.0%
Cash-on-Cash Return
3.5%
Cap rate
0.7%
Rent to Value Ratio
Active
$1,280,000
5
bds
|
0
ba
|
5,311
sqft
|
built
1996
3211 Riviera Dr, Sugar Land, TX 77479
$-4,060
Cash flow
-16.5%
Cash-on-Cash Return
2.5%
Cap rate
0.5%
Rent to Value Ratio
Active
$318,000
5
bds
|
0
ba
|
2,355
sqft
|
built
2005
9726 Angleside Ln, Sugar Land, TX 77498
$-108
Cash flow
-1.8%
Cash-on-Cash Return
5.9%
Cap rate
0.7%
Rent to Value Ratio
Active
$425,000
3
bds
|
0
ba
|
2,375
sqft
|
built
1984
3406 Mesquite Dr, Sugar Land, TX 77479
$-1,195
Cash flow
-14.7%
Cash-on-Cash Return
2.9%
Cap rate
0.6%
Rent to Value Ratio

Active
$610,000
4
bds
|
0
ba
|
3,487
sqft
|
built
1990
7403 Timberlake Dr, Sugar Land, TX 77479
$-1,792
Cash flow
-15.3%
Cash-on-Cash Return
2.7%
Cap rate
0.6%
Rent to Value Ratio

Active
$379,990
4
bds
|
0
ba
|
2,281
sqft
|
built
1997
718 Presley Way, Sugar Land, TX 77479
$-727
Cash flow
-10.0%
Cash-on-Cash Return
4.0%
Cap rate
0.7%
Rent to Value Ratio
Active
$1,110,000
4
bds
|
0
ba
|
4,872
sqft
|
built
2010
4814 Burclare Ct, Sugar Land, TX 77479
$-4,916
Cash flow
-23.1%
Cash-on-Cash Return
1.0%
Cap rate
0.4%
Rent to Value Ratio
Active
$349,990
4
bds
|
0
ba
|
1,893
sqft
|
built
2005
9622 Sugarblossom Ln, Sugar Land, TX 77498
$-1,019
Cash flow
-15.2%
Cash-on-Cash Return
2.8%
Cap rate
0.6%
Rent to Value Ratio
Active
$289,990
3
bds
|
0
ba
|
1,421
sqft
|
built
1983
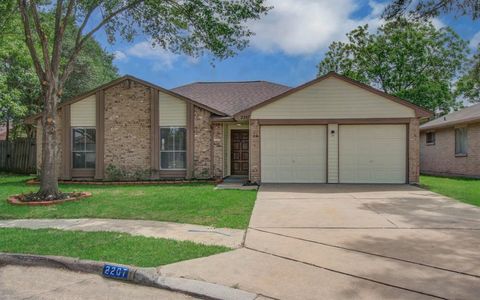
2207 S Ferrisburg Ct, Sugar Land, TX 77478
$-664
Cash flow
-11.9%
Cash-on-Cash Return
3.5%
Cap rate
0.6%
Rent to Value Ratio
Active
$789,999
4
bds
|
0
ba
|
2,916
sqft
|
built
2014
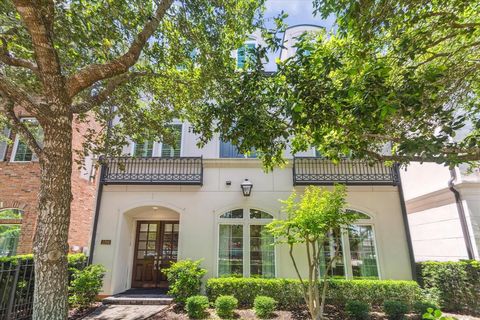
1206 Lake Pointe Pkwy, Sugar Land, TX 77478
$-3,080
Cash flow
-20.3%
Cash-on-Cash Return
1.6%
Cap rate
0.4%
Rent to Value Ratio
Active
$949,500
4
bds
|
0
ba
|
4,403
sqft
|
built
2008
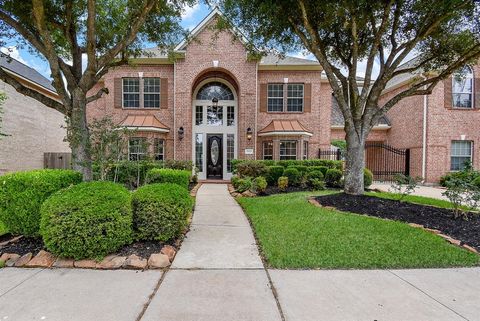
1611 Whitfield St, Sugar Land, TX 77479
$-4,124
Cash flow
-22.7%
Cash-on-Cash Return
1.1%
Cap rate
0.4%
Rent to Value Ratio

Active
$499,000
4
bds
|
0
ba
|
2,724
sqft
|
built
1983
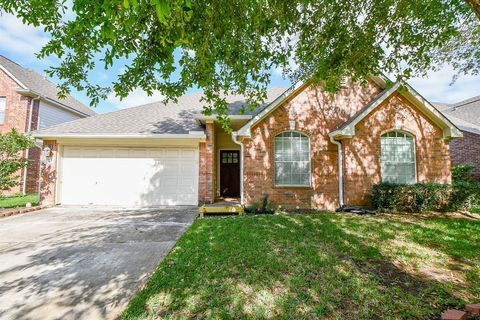
1030 Oyster Bay Dr, Sugar Land, TX 77478
$-1,304
Cash flow
-13.6%
Cash-on-Cash Return
3.1%
Cap rate
0.6%
Rent to Value Ratio
Active
$359,000
3
bds
|
0
ba
|
2,018
sqft
|
built
2001
1143 Oxford Mills Ln, Sugar Land, TX 77479
$-925
Cash flow
-13.4%
Cash-on-Cash Return
3.2%
Cap rate
0.7%
Rent to Value Ratio