Sugar Land, TX Investment Properties for Sale
Browse homes for sale and investment properties in Sugar Land, TX. Refine your search by price, property type, or more.
Best cash flowing properties in Sugar Land, TX
Active
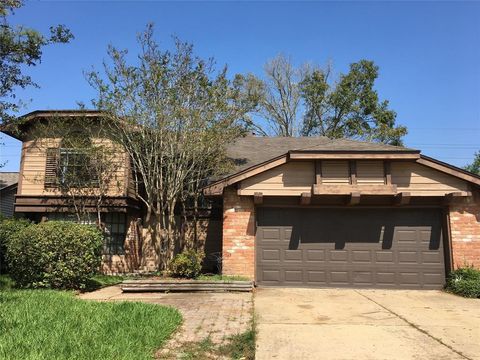
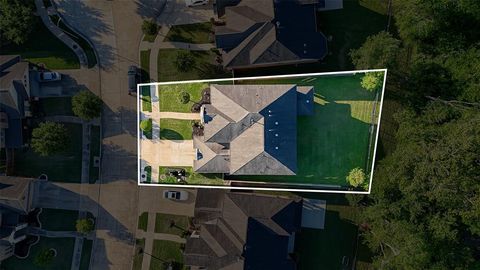
$309,900
4
bds
|
0
ba
|
2,078
sqft
|
built
1983
2615 Austins Pl, Sugar Land, TX 77478
$-151
Cash flow
-2.5%
Cash-on-Cash Return
5.7%
Cap rate
0.7%
Rent to Value Ratio

Active
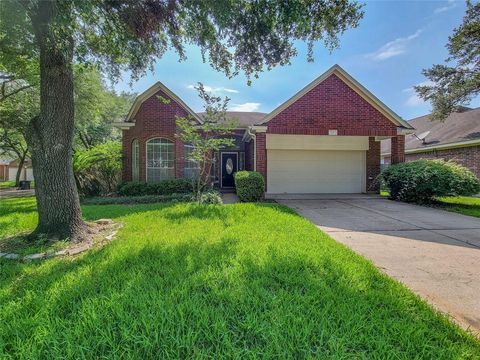
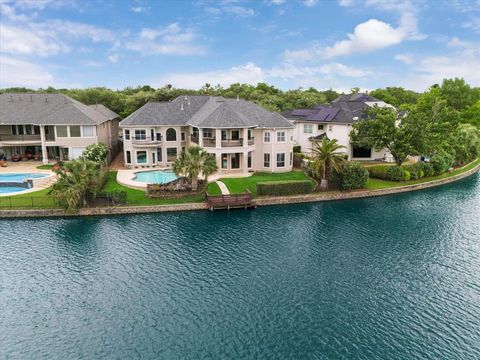
$389,900
4
bds
|
0
ba
|
2,699
sqft
|
built
1999
5542 Morgan Park Ln, Sugar Land, TX 77479
$-202
Cash flow
-2.7%
Cash-on-Cash Return
5.6%
Cap rate
0.7%
Rent to Value Ratio
400 out of 478 properties for sale in Sugar Land, TX
Limited Results Shown
Create a free account, or log in to reveal all property listings and enjoy the complete experience.
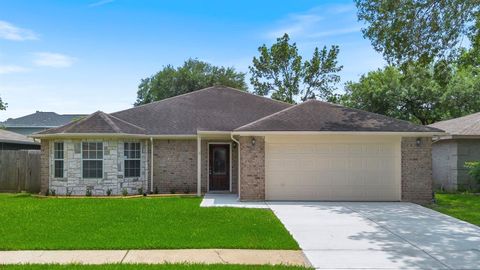
Active
$309,900
4
bds
|
0
ba
|
2,078
sqft
|
built
1983
2615 Austins Pl, Sugar Land, TX 77478
$-151
Cash flow
-2.5%
Cash-on-Cash Return
5.7%
Cap rate
0.7%
Rent to Value Ratio
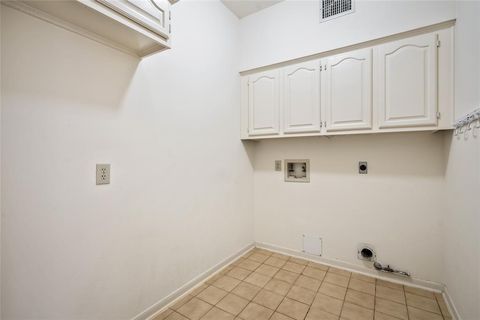
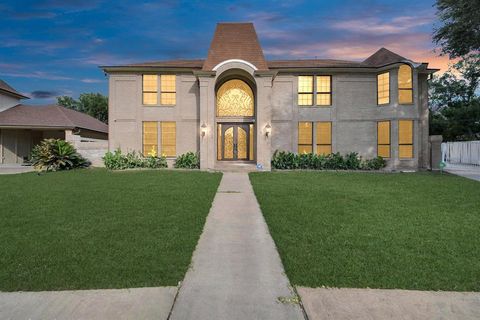
Active
$399,000
4
bds
|
0
ba
|
2,315
sqft
|
built
1995
218 Windrift Ct, Sugar Land, TX 77479
$-927
Cash flow
-12.1%
Cash-on-Cash Return
3.5%
Cap rate
0.7%
Rent to Value Ratio
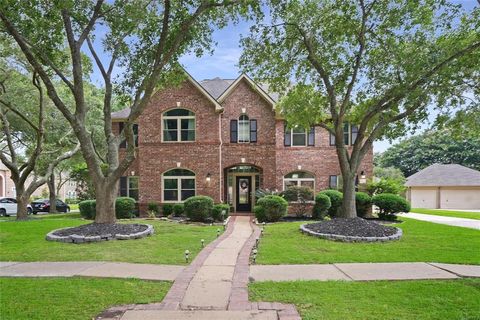
Active
$504,999
4
bds
|
0
ba
|
2,825
sqft
|
built
1987
4423 Nassau Dr, Sugar Land, TX 77479
$-1,481
Cash flow
-15.3%
Cash-on-Cash Return
2.7%
Cap rate
0.6%
Rent to Value Ratio
Active
$630,000
5
bds
|
0
ba
|
3,860
sqft
|
built
1998
3 Amberstone Dr, Sugar Land, TX 77479
$-1,782
Cash flow
-14.8%
Cash-on-Cash Return
2.9%
Cap rate
0.6%
Rent to Value Ratio

Active
$1,350,000
5
bds
|
0
ba
|
5,059
sqft
|
built
2012
2918 Auburn Path, Sugar Land, TX 77479
$-6,260
Cash flow
-24.2%
Cash-on-Cash Return
0.7%
Cap rate
0.3%
Rent to Value Ratio
Active
$510,000
4
bds
|
0
ba
|
2,655
sqft
|
built
1994
4807 Louisa Ct, Sugar Land, TX 77478
$-1,505
Cash flow
-15.4%
Cash-on-Cash Return
2.7%
Cap rate
0.5%
Rent to Value Ratio
Active
$426,999
4
bds
|
0
ba
|
2,265
sqft
|
built
1998
1111 Cambrian Park Ct, Sugar Land, TX 77479
$-1,241
Cash flow
-15.2%
Cash-on-Cash Return
2.8%
Cap rate
0.6%
Rent to Value Ratio

Active
$970,000
4
bds
|
0
ba
|
4,092
sqft
|
built
2011
6223 Duke Trail Ln, Sugar Land, TX 77479
$-3,913
Cash flow
-21.0%
Cash-on-Cash Return
1.4%
Cap rate
0.4%
Rent to Value Ratio

Active
$1,265,000
4
bds
|
0
ba
|
4,472
sqft
|
built
2006
1111 Vista Creek Dr, Sugar Land, TX 77478
$-4,727
Cash flow
-19.5%
Cash-on-Cash Return
1.8%
Cap rate
0.4%
Rent to Value Ratio

Active
$299,500
3
bds
|
0
ba
|
1,453
sqft
|
built
1985
13002 Nantucket Dr, Sugar Land, TX 77478
$-731
Cash flow
-12.7%
Cash-on-Cash Return
3.3%
Cap rate
0.6%
Rent to Value Ratio

Active
$379,000
2
bds
|
0
ba
|
1,274
sqft
|
built
1960
614 Kyle St, Sugar Land, TX 77478
$-1,009
Cash flow
-13.9%
Cash-on-Cash Return
3.1%
Cap rate
0.5%
Rent to Value Ratio
Active
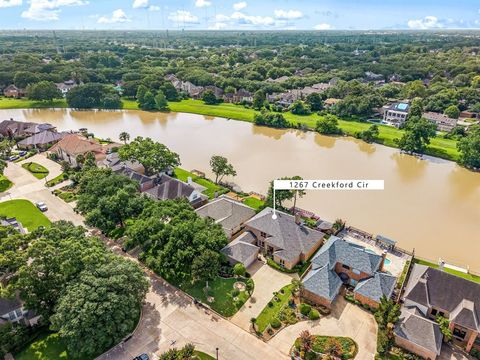
$850,000
4
bds
|
0
ba
|
3,354
sqft
|
built
1984
1267 Creekford Cir, Sugar Land, TX 77478
$-2,284
Cash flow
-14.0%
Cash-on-Cash Return
3.0%
Cap rate
0.4%
Rent to Value Ratio

Active
$488,000
5
bds
|
0
ba
|
3,018
sqft
|
built
1993
627 Winston Ln, Sugar Land, TX 77479
$-1,573
Cash flow
-16.8%
Cash-on-Cash Return
2.4%
Cap rate
0.6%
Rent to Value Ratio
Active
$990,000
5
bds
|
0
ba
|
4,235
sqft
|
built
2002
5207 Eagle Pointe Ct, Sugar Land, TX 77479
$-2,529
Cash flow
-13.3%
Cash-on-Cash Return
3.2%
Cap rate
0.6%
Rent to Value Ratio

Active
$703,000
5
bds
|
0
ba
|
3,961
sqft
|
built
1989
47 Sterling St, Sugar Land, TX 77479
$-1,939
Cash flow
-14.4%
Cash-on-Cash Return
3.0%
Cap rate
0.6%
Rent to Value Ratio

Active
$435,000
3
bds
|
0
ba
|
2,424
sqft
|
built
1983
815 Millpond Dr, Sugar Land, TX 77498
$-1,183
Cash flow
-14.2%
Cash-on-Cash Return
3.0%
Cap rate
0.6%
Rent to Value Ratio
Active
$1,150,000
5
bds
|
0
ba
|
5,125
sqft
|
built
2010
1219 Coleridge St, Sugar Land, TX 77479
$-5,030
Cash flow
-22.8%
Cash-on-Cash Return
1.0%
Cap rate
0.3%
Rent to Value Ratio

Active
$326,500
3
bds
|
0
ba
|
1,906
sqft
|
built
1996
16910 Pheasant Ridge Dr, Sugar Land, TX 77498
$-845
Cash flow
-13.5%
Cash-on-Cash Return
3.2%
Cap rate
0.7%
Rent to Value Ratio
Active
$359,000
4
bds
|
0
ba
|
2,108
sqft
|
built
1985
1826 Concho River Ct, Sugar Land, TX 77478
$-900
Cash flow
-13.1%
Cash-on-Cash Return
3.3%
Cap rate
0.6%
Rent to Value Ratio
Active
$389,900
4
bds
|
0
ba
|
2,699
sqft
|
built
1999
5542 Morgan Park Ln, Sugar Land, TX 77479
$-202
Cash flow
-2.7%
Cash-on-Cash Return
5.6%
Cap rate
0.7%
Rent to Value Ratio
Active
$609,000
4
bds
|
0
ba
|
3,421
sqft
|
built
2008
4211 Turtle Trails Ln, Sugar Land, TX 77479
$-1,789
Cash flow
-15.3%
Cash-on-Cash Return
2.7%
Cap rate
0.5%
Rent to Value Ratio
Active
$339,000
4
bds
|
0
ba
|
2,196
sqft
|
built
1988
6414 Scarlet Ridge Ct, Sugar Land, TX 77479
$-813
Cash flow
-12.5%
Cash-on-Cash Return
3.4%
Cap rate
0.7%
Rent to Value Ratio
Active
$830,000
5
bds
|
0
ba
|
3,899
sqft
|
built
2010
4603 Red Hawk Ct, Sugar Land, TX 77479
$-1,682
Cash flow
-10.6%
Cash-on-Cash Return
3.8%
Cap rate
0.5%
Rent to Value Ratio

Active
$590,000
6
bds
|
0
ba
|
4,000
sqft
|
built
2006
3730 Arundel Gardens Ln, Sugar Land, TX 77498
$-1,858
Cash flow
-16.4%
Cash-on-Cash Return
2.5%
Cap rate
0.6%
Rent to Value Ratio
Active
$730,000
4
bds
|
0
ba
|
3,600
sqft
|
built
2012
4203 Scenic Valley Ln, Sugar Land, TX 77479
$-2,365
Cash flow
-16.9%
Cash-on-Cash Return
2.4%
Cap rate
0.5%
Rent to Value Ratio

Active
$380,000
3
bds
|
0
ba
|
1,814
sqft
|
built
1984
4519 Pioneer Trl, Sugar Land, TX 77479
$-1,026
Cash flow
-14.1%
Cash-on-Cash Return
3.0%
Cap rate
0.6%
Rent to Value Ratio
Active
$519,988
4
bds
|
0
ba
|
3,319
sqft
|
built
2003
1411 Flanders Field Ln, Sugar Land, TX 77498
$-1,280
Cash flow
-12.8%
Cash-on-Cash Return
3.3%
Cap rate
0.6%
Rent to Value Ratio

Active
$695,000
5
bds
|
0
ba
|
3,861
sqft
|
built
2000
1615 Forest Trace Dr, Sugar Land, TX 77479
$-2,532
Cash flow
-19.0%
Cash-on-Cash Return
1.9%
Cap rate
0.4%
Rent to Value Ratio
Active
$375,000
4
bds
|
0
ba
|
2,331
sqft
|
built
1993
6506 Knoll Park Dr, Sugar Land, TX 77479
$-939
Cash flow
-13.1%
Cash-on-Cash Return
3.3%
Cap rate
0.7%
Rent to Value Ratio
Active
$990,000
5
bds
|
0
ba
|
3,753
sqft
|
built
2016
5411 Oban Terrace Ln, Sugar Land, TX 77479
$-3,735
Cash flow
-19.7%
Cash-on-Cash Return
1.7%
Cap rate
0.4%
Rent to Value Ratio

Active
$3,500,000
5
bds
|
0
ba
|
7,173
sqft
|
built
2016
38 Enclave Manor Dr, Sugar Land, TX 77479
$-16,180
Cash flow
-24.1%
Cash-on-Cash Return
0.7%
Cap rate
0.1%
Rent to Value Ratio
Active
$1,780,000
5
bds
|
0
ba
|
6,289
sqft
|
built
2000
5011 Regency Dr, Sugar Land, TX 77479
$-6,226
Cash flow
-18.2%
Cash-on-Cash Return
2.1%
Cap rate
0.4%
Rent to Value Ratio
Active
$385,000
4
bds
|
0
ba
|
2,036
sqft
|
built
2013
14315 Branchwater Ln, Sugar Land, TX 77498
$-1,490
Cash flow
-20.2%
Cash-on-Cash Return
1.6%
Cap rate
0.6%
Rent to Value Ratio
Active
$1,070,000
5
bds
|
0
ba
|
6,418
sqft
|
built
1987
1743 Randons Point Dr, Sugar Land, TX 77478
$-3,958
Cash flow
-19.3%
Cash-on-Cash Return
1.8%
Cap rate
0.4%
Rent to Value Ratio
Active
$674,999
4
bds
|
0
ba
|
4,042
sqft
|
built
1997
26 Schubach Dr, Sugar Land, TX 77479
$-2,213
Cash flow
-17.1%
Cash-on-Cash Return
2.3%
Cap rate
0.5%
Rent to Value Ratio
Active
$499,786
4
bds
|
0
ba
|
2,979
sqft
|
built
1991
5918 Pendelton Place Dr, Sugar Land, TX 77479
$-1,503
Cash flow
-15.7%
Cash-on-Cash Return
2.7%
Cap rate
0.6%
Rent to Value Ratio

Active
$415,000
4
bds
|
0
ba
|
2,720
sqft
|
built
1989
2802 Grants River Cir, Sugar Land, TX 77479
$-1,150
Cash flow
-14.5%
Cash-on-Cash Return
2.9%
Cap rate
0.6%
Rent to Value Ratio

Active
$559,000
5
bds
|
0
ba
|
2,911
sqft
|
built
1989
3222 Serene Oak Dr, Sugar Land, TX 77478
$-1,773
Cash flow
-16.5%
Cash-on-Cash Return
2.5%
Cap rate
0.5%
Rent to Value Ratio

Active
$2,898,800
6
bds
|
0
ba
|
8,400
sqft
|
built
2013
70 Sunset Park Ln, Sugar Land, TX 77479
$-12,307
Cash flow
-22.2%
Cash-on-Cash Return
1.2%
Cap rate
0.3%
Rent to Value Ratio

Active
$539,900
5
bds
|
0
ba
|
3,229
sqft
|
built
2001
1818 Cross Spring Dr, Sugar Land, TX 77479
$-1,270
Cash flow
-12.3%
Cash-on-Cash Return
3.4%
Cap rate
0.7%
Rent to Value Ratio