Sugar Land, TX Investment Properties for Sale
Browse homes for sale and investment properties in Sugar Land, TX. Refine your search by price, property type, or more.
Best cash flowing properties in Sugar Land, TX
Active
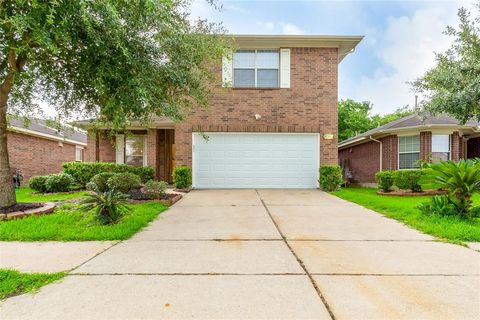
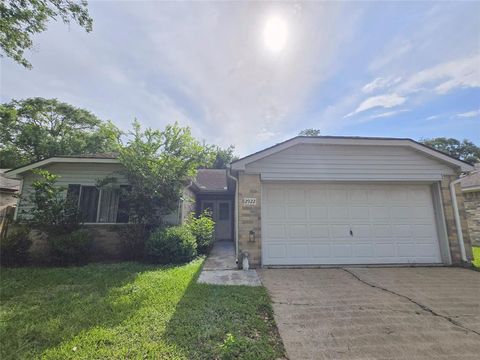
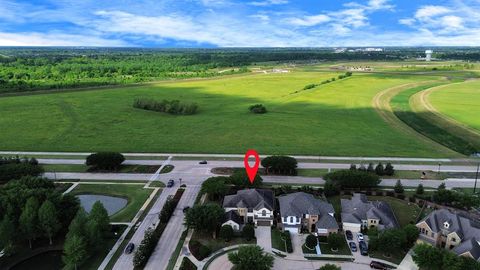
$318,000
5
bds
|
0
ba
|
2,355
sqft
|
built
2005
9726 Angleside Ln, Sugar Land, TX 77498
$-108
Cash flow
-1.8%
Cash-on-Cash Return
5.9%
Cap rate
0.7%
Rent to Value Ratio

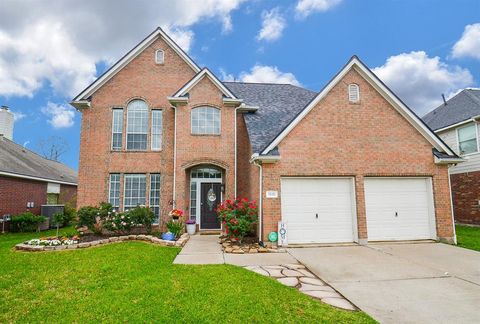
Active
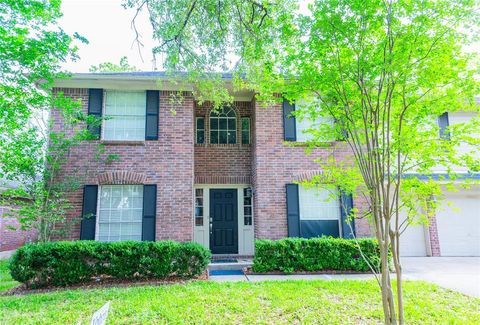
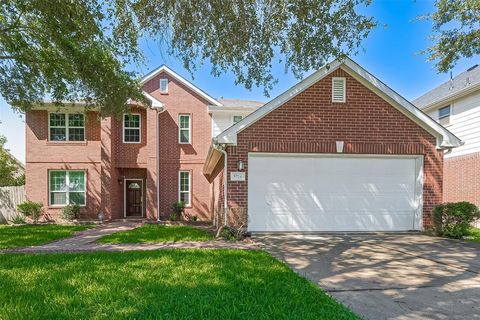
$325,000
3
bds
|
0
ba
|
2,439
sqft
|
built
2002
16306 Soaring Eagle Dr, Sugar Land, TX 77498
$-215
Cash flow
-3.5%
Cash-on-Cash Return
5.5%
Cap rate
0.7%
Rent to Value Ratio
428 out of 519 properties for sale in Sugar Land, TX
Limited Results Shown
Create a free account, or log in to reveal all property listings and enjoy the complete experience.
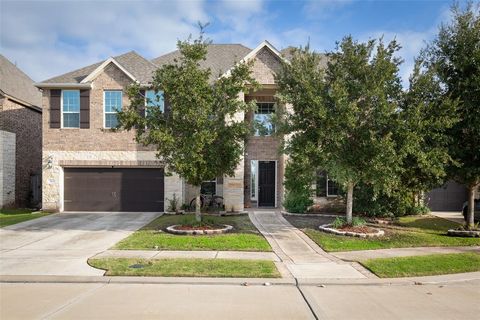
Active
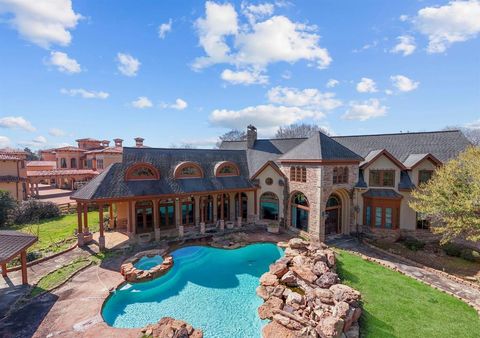
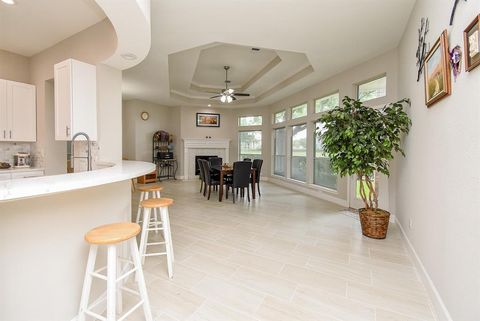
$369,999
4
bds
|
0
ba
|
2,448
sqft
|
built
1988
6311 Laurel Bush Ln, Sugar Land, TX 77479
$-828
Cash flow
-11.7%
Cash-on-Cash Return
3.6%
Cap rate
0.7%
Rent to Value Ratio

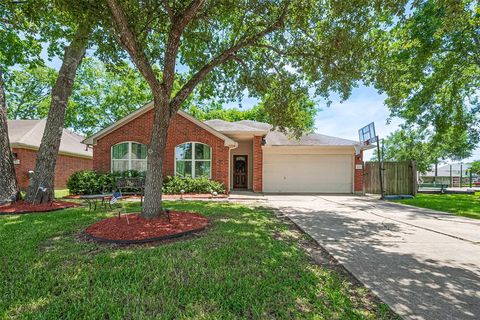
Active
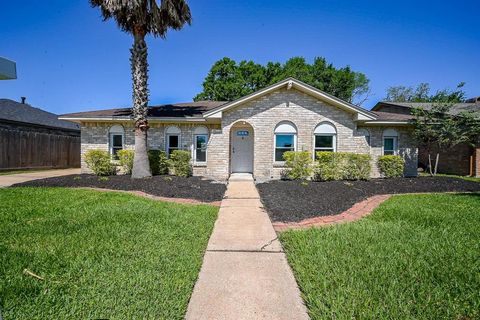
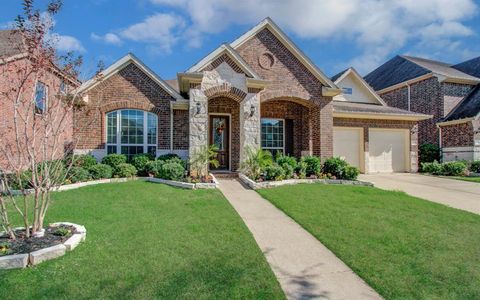
$439,000
4
bds
|
0
ba
|
2,412
sqft
|
built
2011
2403 Ranna Ct, Sugar Land, TX 77498
$-1,264
Cash flow
-15.0%
Cash-on-Cash Return
2.8%
Cap rate
0.6%
Rent to Value Ratio

Active
$219,000
2
bds
|
0
ba
|
0
sqft
|
built
1985
2910 Grants Lake Blvd, Sugar Land, TX 77479
$-389
Cash flow
-9.3%
Cash-on-Cash Return
4.1%
Cap rate
0.7%
Rent to Value Ratio

Active
$849,000
4
bds
|
0
ba
|
3,663
sqft
|
built
2000
5419 Eagle Trace Ct, Sugar Land, TX 77479
$-2,764
Cash flow
-17.0%
Cash-on-Cash Return
2.4%
Cap rate
0.5%
Rent to Value Ratio
Active
$3,639,000
5
bds
|
0
ba
|
7,482
sqft
|
built
1997
326 W Alkire Lake Dr, Sugar Land, TX 77478
$-14,030
Cash flow
-20.1%
Cash-on-Cash Return
1.6%
Cap rate
0.2%
Rent to Value Ratio
Active
$299,500
3
bds
|
0
ba
|
1,875
sqft
|
built
1974
13722 Woodchester Dr, Sugar Land, TX 77498
$-639
Cash flow
-11.1%
Cash-on-Cash Return
3.7%
Cap rate
0.7%
Rent to Value Ratio
Active
$599,000
4
bds
|
0
ba
|
2,710
sqft
|
built
2000
8303 Big Bend Dr, Sugar Land, TX 77479
$-2,069
Cash flow
-18.0%
Cash-on-Cash Return
2.1%
Cap rate
0.5%
Rent to Value Ratio
Active
$325,000
3
bds
|
0
ba
|
2,439
sqft
|
built
2002
16306 Soaring Eagle Dr, Sugar Land, TX 77498
$-215
Cash flow
-3.5%
Cash-on-Cash Return
5.5%
Cap rate
0.7%
Rent to Value Ratio
Active
$829,900
4
bds
|
0
ba
|
3,834
sqft
|
built
2016
47 Monarch Trl, Sugar Land, TX 77498
$-2,623
Cash flow
-16.5%
Cash-on-Cash Return
2.5%
Cap rate
0.6%
Rent to Value Ratio
Active
$695,000
4
bds
|
0
ba
|
3,117
sqft
|
built
1997
6219 Mound Airy Ct, Sugar Land, TX 77479
$-2,468
Cash flow
-18.5%
Cash-on-Cash Return
2.0%
Cap rate
0.5%
Rent to Value Ratio

Active
$529,990
5
bds
|
0
ba
|
3,110
sqft
|
built
2000
11906 Dinosaur Valley Dr, Sugar Land, TX 77498
$-1,531
Cash flow
-15.1%
Cash-on-Cash Return
2.8%
Cap rate
0.5%
Rent to Value Ratio

Active
$725,000
5
bds
|
0
ba
|
4,241
sqft
|
built
2006
5014 Riverstone Crossing Dr, Sugar Land, TX 77479
$-2,205
Cash flow
-15.9%
Cash-on-Cash Return
2.6%
Cap rate
0.5%
Rent to Value Ratio
Active
$295,000
3
bds
|
0
ba
|
1,371
sqft
|
built
1983
4007 Issacks Way, Sugar Land, TX 77479
$-613
Cash flow
-10.8%
Cash-on-Cash Return
3.8%
Cap rate
0.7%
Rent to Value Ratio

Active
$1,300,000
5
bds
|
0
ba
|
4,674
sqft
|
built
2018
5807 Yango Terrace Ln, Sugar Land, TX 77479
$-5,507
Cash flow
-22.1%
Cash-on-Cash Return
1.2%
Cap rate
0.3%
Rent to Value Ratio
Active
$665,000
3
bds
|
0
ba
|
2,739
sqft
|
built
1995
3106 Royal Lytham Ct, Sugar Land, TX 77479
$-2,135
Cash flow
-16.8%
Cash-on-Cash Return
2.4%
Cap rate
0.5%
Rent to Value Ratio
Active
$2,489,000
5
bds
|
0
ba
|
6,190
sqft
|
built
2016
35 Enclave Manor Dr, Sugar Land, TX 77479
$-9,627
Cash flow
-20.2%
Cash-on-Cash Return
1.6%
Cap rate
0.4%
Rent to Value Ratio
Active
$280,000
3
bds
|
0
ba
|
1,461
sqft
|
built
1978
2530 Long Reach Dr, Sugar Land, TX 77478
$-555
Cash flow
-10.3%
Cash-on-Cash Return
3.9%
Cap rate
0.7%
Rent to Value Ratio
Active
$879,888
5
bds
|
0
ba
|
4,181
sqft
|
built
2006
7003 Paxton Ct, Sugar Land, TX 77479
$-3,523
Cash flow
-20.9%
Cash-on-Cash Return
1.5%
Cap rate
0.4%
Rent to Value Ratio
Active
$798,990
4
bds
|
0
ba
|
4,339
sqft
|
built
2018
4218 Tanner Woods Ln, Sugar Land, TX 77479
$-1,228
Cash flow
-8.0%
Cash-on-Cash Return
4.4%
Cap rate
0.6%
Rent to Value Ratio
Active
$1,098,880
4
bds
|
0
ba
|
4,591
sqft
|
built
2017
190 Monarch Trl, Sugar Land, TX 77498
$-3,275
Cash flow
-15.5%
Cash-on-Cash Return
2.7%
Cap rate
0.6%
Rent to Value Ratio
Active
$299,990
4
bds
|
0
ba
|
2,074
sqft
|
built
1983
1007 Sugardale Ct, Sugar Land, TX 77498
$-596
Cash flow
-10.4%
Cash-on-Cash Return
3.9%
Cap rate
0.7%
Rent to Value Ratio

Active
$325,786
4
bds
|
0
ba
|
1,904
sqft
|
built
1989
2031 Summerfield Pl, Sugar Land, TX 77478
$-589
Cash flow
-9.4%
Cash-on-Cash Return
4.1%
Cap rate
0.7%
Rent to Value Ratio
Active
$1,299,000
4
bds
|
0
ba
|
4,804
sqft
|
built
2010
407 Pickney Ave, Sugar Land, TX 77479
$-4,307
Cash flow
-17.3%
Cash-on-Cash Return
2.3%
Cap rate
0.5%
Rent to Value Ratio
Active
$235,000
2
bds
|
0
ba
|
1,226
sqft
|
built
1982
2922 Whetrock Ln, Sugar Land, TX 77479
$-555
Cash flow
-12.3%
Cash-on-Cash Return
2.8%
Cap rate
0.6%
Rent to Value Ratio
Active
$429,990
4
bds
|
0
ba
|
2,542
sqft
|
built
2001
1515 Summer Forest Dr, Sugar Land, TX 77479
$-1,162
Cash flow
-14.1%
Cash-on-Cash Return
3.0%
Cap rate
0.6%
Rent to Value Ratio
Active
$900,000
5
bds
|
0
ba
|
4,577
sqft
|
built
2017
14 Monarch Ct, Sugar Land, TX 77498
$-3,556
Cash flow
-20.6%
Cash-on-Cash Return
1.5%
Cap rate
0.5%
Rent to Value Ratio
Active
$339,900
4
bds
|
0
ba
|
1,762
sqft
|
built
2001
3207 Pheasant Trail Dr, Sugar Land, TX 77498
$-952
Cash flow
-14.6%
Cash-on-Cash Return
2.9%
Cap rate
0.6%
Rent to Value Ratio

Active
$740,000
5
bds
|
0
ba
|
5,126
sqft
|
built
2005
7014 Lake Haven Ct, Sugar Land, TX 77479
$-2,084
Cash flow
-14.7%
Cash-on-Cash Return
2.9%
Cap rate
0.6%
Rent to Value Ratio

Active
$1,699,000
5
bds
|
0
ba
|
4,657
sqft
|
built
1987
25 The Oval St, Sugar Land, TX 77479
$-7,642
Cash flow
-23.5%
Cash-on-Cash Return
0.9%
Cap rate
0.3%
Rent to Value Ratio

Active
$223,800
2
bds
|
0
ba
|
1,050
sqft
|
built
1990
2930 Grants Lake Blvd, Sugar Land, TX 77479
$-676
Cash flow
-15.8%
Cash-on-Cash Return
2.6%
Cap rate
0.8%
Rent to Value Ratio

Active
$325,000
3
bds
|
0
ba
|
2,028
sqft
|
built
1993
4131 N New Meadows Dr, Sugar Land, TX 77479
$-648
Cash flow
-10.4%
Cash-on-Cash Return
3.9%
Cap rate
0.7%
Rent to Value Ratio
Active
$1,110,000
4
bds
|
0
ba
|
4,872
sqft
|
built
2010
4814 Burclare Ct, Sugar Land, TX 77479
$-4,916
Cash flow
-23.1%
Cash-on-Cash Return
1.0%
Cap rate
0.4%
Rent to Value Ratio

Active
$750,000
3
bds
|
0
ba
|
1,853
sqft
|
built
1958
414 Lakeview Dr, Sugar Land, TX 77498
$-2,849
Cash flow
-19.8%
Cash-on-Cash Return
1.7%
Cap rate
0.3%
Rent to Value Ratio
Active
$395,000
3
bds
|
0
ba
|
3,128
sqft
|
built
2001
5714 Ames Xing, Sugar Land, TX 77479
$-909
Cash flow
-12.0%
Cash-on-Cash Return
3.5%
Cap rate
0.7%
Rent to Value Ratio
Active
$1,280,000
5
bds
|
0
ba
|
5,311
sqft
|
built
1996
3211 Riviera Dr, Sugar Land, TX 77479
$-4,060
Cash flow
-16.5%
Cash-on-Cash Return
2.5%
Cap rate
0.5%
Rent to Value Ratio
Active
$318,000
5
bds
|
0
ba
|
2,355
sqft
|
built
2005
9726 Angleside Ln, Sugar Land, TX 77498
$-108
Cash flow
-1.8%
Cash-on-Cash Return
5.9%
Cap rate
0.7%
Rent to Value Ratio

Active
$1,395,000
5
bds
|
0
ba
|
4,760
sqft
|
built
2014
5306 Lockwood Bend Ln, Sugar Land, TX 77479
$-5,652
Cash flow
-21.1%
Cash-on-Cash Return
1.4%
Cap rate
0.3%
Rent to Value Ratio
Active
$649,000
4
bds
|
0
ba
|
3,456
sqft
|
built
2014
4419 Rolling Field Ln, Sugar Land, TX 77479
$-1,921
Cash flow
-15.4%
Cash-on-Cash Return
2.7%
Cap rate
0.5%
Rent to Value Ratio
Active
$849,600
6
bds
|
0
ba
|
4,610
sqft
|
built
2013
5306 Belle Manor Ln, Sugar Land, TX 77479
$-2,756
Cash flow
-16.9%
Cash-on-Cash Return
2.4%
Cap rate
0.5%
Rent to Value Ratio

Active
$379,990
4
bds
|
0
ba
|
2,281
sqft
|
built
1997
718 Presley Way, Sugar Land, TX 77479
$-727
Cash flow
-10.0%
Cash-on-Cash Return
4.0%
Cap rate
0.7%
Rent to Value Ratio