Superior, CO Investment Properties for Sale
Browse homes for sale and investment properties in Superior, CO. Refine your search by price, property type, or more.
Best cash flowing properties in Superior, CO
Active
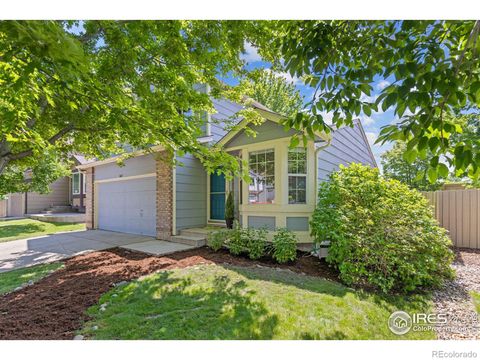
$499,900
3
bds
|
3
ba
|
1,492
sqft
|
built
1999
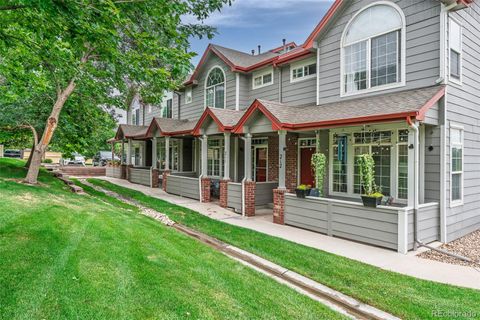
2855 Rock Creek Cir, Superior, CO 80027
$-1,219
Cash flow
-12.7%
Cash-on-Cash Return
2.8%
Cap rate
0.5%
Rent to Value Ratio

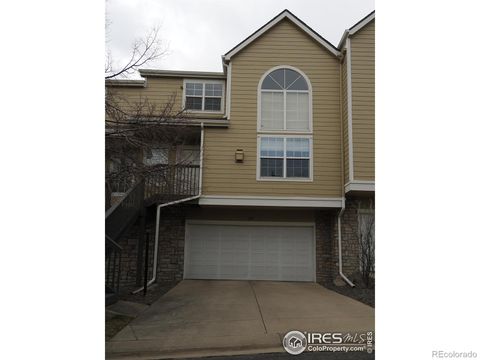
Active
$695,000
3
bds
|
4
ba
|
2,171
sqft
|
built
1993
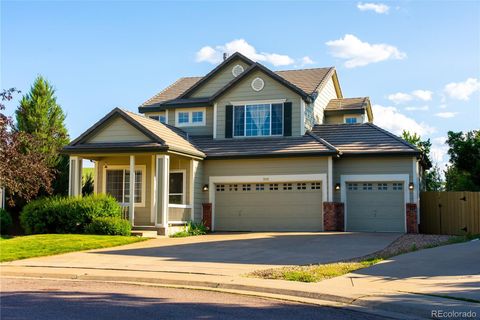
1485 Stoneham St, Superior, CO 80027
$-1,232
Cash flow
-9.2%
Cash-on-Cash Return
3.6%
Cap rate
0.5%
Rent to Value Ratio
29 out of 31 properties for sale in Superior, CO
Limited Results Shown
Create a free account, or log in to reveal all property listings and enjoy the complete experience.
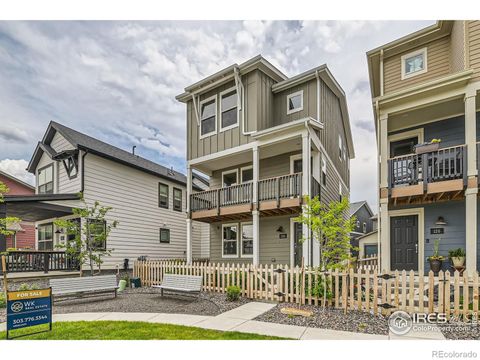
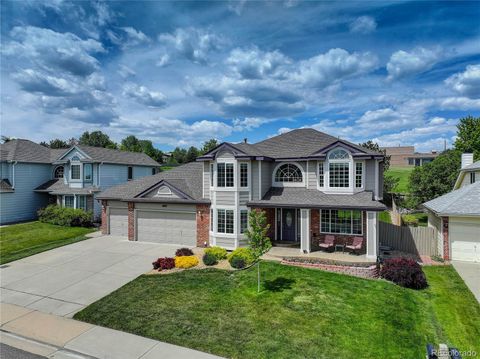
Active
$950,000
4
bds
|
4
ba
|
3,112
sqft
|
built
2000
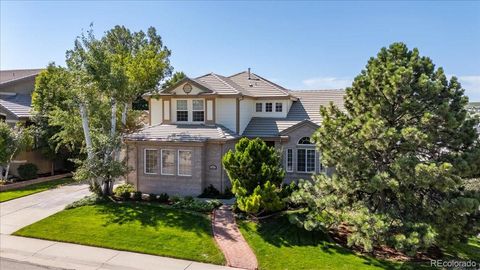
3232 Cimarron Pl, Superior, CO 80027
$-2,566
Cash flow
-14.1%
Cash-on-Cash Return
2.4%
Cap rate
0.4%
Rent to Value Ratio
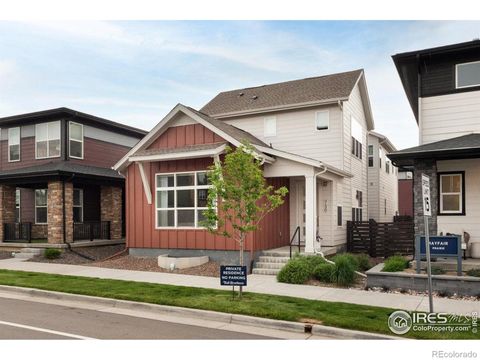
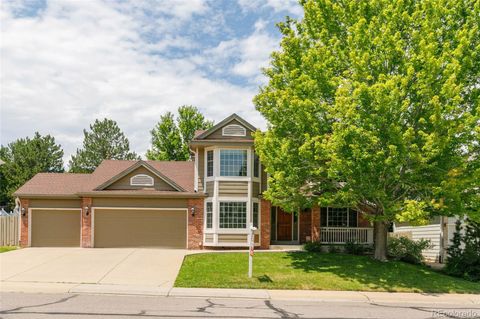
Active
$1,200,700
5
bds
|
4
ba
|
4,154
sqft
|
built
1998
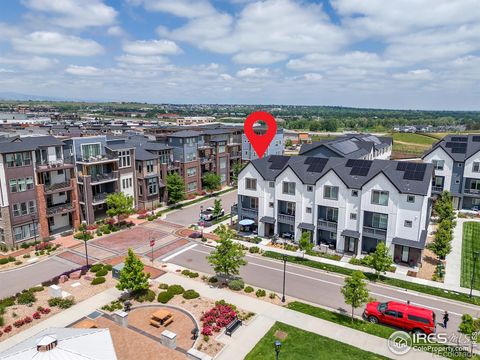
888 Northern Way, Superior, CO 80027
$-3,567
Cash flow
-15.5%
Cash-on-Cash Return
2.1%
Cap rate
0.3%
Rent to Value Ratio
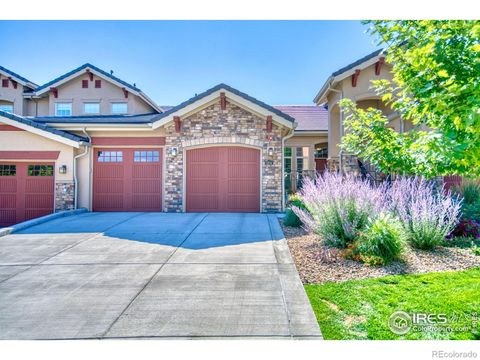
Active
$717,999
3
bds
|
4
ba
|
1,753
sqft
|
built
2022
605 Promenade Dr, Superior, CO 80027
$-1,313
Cash flow
-9.5%
Cash-on-Cash Return
3.5%
Cap rate
0.5%
Rent to Value Ratio
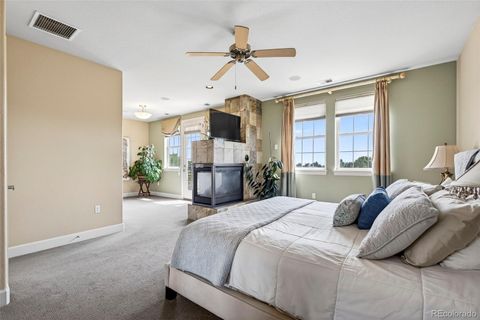
Active
$694,000
3
bds
|
4
ba
|
1,920
sqft
|
built
1995
1667 Reliance Cir, Superior, CO 80027
$-1,467
Cash flow
-11.0%
Cash-on-Cash Return
3.1%
Cap rate
0.5%
Rent to Value Ratio
Active
$509,500
2
bds
|
2
ba
|
1,286
sqft
|
built
1997
1697 High Plains Ct, Superior, CO 80027
$-1,466
Cash flow
-15.0%
Cash-on-Cash Return
2.2%
Cap rate
0.5%
Rent to Value Ratio
Active
$732,000
3
bds
|
3
ba
|
1,546
sqft
|
built
2022
128 E Douglas St, Superior, CO 80027
$-1,557
Cash flow
-11.1%
Cash-on-Cash Return
3.1%
Cap rate
0.5%
Rent to Value Ratio
Active
$1,125,000
4
bds
|
4
ba
|
3,517
sqft
|
built
2022
730 Promenade Dr, Superior, CO 80027
$-3,640
Cash flow
-16.9%
Cash-on-Cash Return
1.8%
Cap rate
0.3%
Rent to Value Ratio
Active
$1,127,000
4
bds
|
4
ba
|
3,096
sqft
|
built
1993
1825 Keota Ln, Superior, CO 80027
$-3,187
Cash flow
-14.8%
Cash-on-Cash Return
2.3%
Cap rate
0.3%
Rent to Value Ratio
Active
$999,900
4
bds
|
4
ba
|
3,296
sqft
|
built
1993
1899 Breen Ln, Superior, CO 80027
$-2,575
Cash flow
-13.4%
Cash-on-Cash Return
2.6%
Cap rate
0.4%
Rent to Value Ratio
Active
$1,100,000
3
bds
|
3
ba
|
3,132
sqft
|
built
2016
2904 Casalon Cir, Superior, CO 80027
$-3,179
Cash flow
-15.1%
Cash-on-Cash Return
2.2%
Cap rate
0.4%
Rent to Value Ratio
Active
$1,200,000
3
bds
|
4
ba
|
3,299
sqft
|
built
2008
2712 Calmante Pl, Superior, CO 80027
$-3,954
Cash flow
-17.2%
Cash-on-Cash Return
1.7%
Cap rate
0.3%
Rent to Value Ratio
Active
$848,000
4
bds
|
4
ba
|
2,590
sqft
|
built
1999
2926 Castle Peak Ave, Superior, CO 80027
$-2,222
Cash flow
-13.7%
Cash-on-Cash Return
2.5%
Cap rate
0.4%
Rent to Value Ratio
Active
$1,069,000
4
bds
|
4
ba
|
4,040
sqft
|
built
1996
2225 Clayton Cir, Superior, CO 80027
$-2,814
Cash flow
-13.7%
Cash-on-Cash Return
2.5%
Cap rate
0.4%
Rent to Value Ratio
Active
$1,050,000
4
bds
|
4
ba
|
3,686
sqft
|
built
1996
977 Eldorado Dr, Superior, CO 80027
$-2,851
Cash flow
-14.2%
Cash-on-Cash Return
2.4%
Cap rate
0.4%
Rent to Value Ratio
Active
$2,200,000
6
bds
|
6
ba
|
7,135
sqft
|
built
1998
725 E Wiggins St, Superior, CO 80027
$-8,137
Cash flow
-19.3%
Cash-on-Cash Return
1.2%
Cap rate
0.2%
Rent to Value Ratio
Active
$839,000
5
bds
|
3
ba
|
2,741
sqft
|
built
1998
2937 W Yarrow Cir, Superior, CO 80027
$-1,809
Cash flow
-11.2%
Cash-on-Cash Return
3.1%
Cap rate
0.5%
Rent to Value Ratio
Active
$590,000
2
bds
|
3
ba
|
1,537
sqft
|
built
1999
2855 Rock Creek Cir, Superior, CO 80027
$-1,519
Cash flow
-13.4%
Cash-on-Cash Return
2.6%
Cap rate
0.5%
Rent to Value Ratio
Active
$1,250,000
5
bds
|
5
ba
|
4,422
sqft
|
built
1996
2204 Lasalle St, Superior, CO 80027
$-3,539
Cash flow
-14.8%
Cash-on-Cash Return
2.3%
Cap rate
0.4%
Rent to Value Ratio
Active
$759,900
3
bds
|
3
ba
|
1,898
sqft
|
built
2003
910 Humboldt Way, Superior, CO 80027
$-2,138
Cash flow
-14.7%
Cash-on-Cash Return
2.3%
Cap rate
0.4%
Rent to Value Ratio

Active
$1,375,000
5
bds
|
5
ba
|
4,505
sqft
|
built
1997
1820 Vernon Ln, Superior, CO 80027
$-4,226
Cash flow
-16.0%
Cash-on-Cash Return
2.0%
Cap rate
0.3%
Rent to Value Ratio

Active
$797,000
5
bds
|
4
ba
|
2,340
sqft
|
built
1993
1220 S Boyero Ct, Superior, CO 80027
$-1,835
Cash flow
-12.0%
Cash-on-Cash Return
2.9%
Cap rate
0.4%
Rent to Value Ratio
Active
$800,000
4
bds
|
4
ba
|
2,790
sqft
|
built
1994
2112 Grayden Ct, Superior, CO 80027
$-1,813
Cash flow
-11.8%
Cash-on-Cash Return
3.0%
Cap rate
0.4%
Rent to Value Ratio

Active
$722,500
3
bds
|
3
ba
|
1,340
sqft
|
built
2023
125 Mesa Way, Superior, CO 80027
$-1,577
Cash flow
-11.4%
Cash-on-Cash Return
3.1%
Cap rate
0.4%
Rent to Value Ratio
Active
$799,990
3
bds
|
4
ba
|
2,051
sqft
|
built
2021
352 Superior Dr, Superior, CO 80027
$-2,310
Cash flow
-15.1%
Cash-on-Cash Return
2.2%
Cap rate
0.4%
Rent to Value Ratio
Active
$728,000
3
bds
|
3
ba
|
1,654
sqft
|
built
1994
1842 Reliance Cir, Superior, CO 80027
$-1,615
Cash flow
-11.6%
Cash-on-Cash Return
3.0%
Cap rate
0.4%
Rent to Value Ratio
Active
$1,175,000
4
bds
|
4
ba
|
3,648
sqft
|
built
2002
333 N Snowmass Cir, Superior, CO 80027
$-3,209
Cash flow
-14.2%
Cash-on-Cash Return
2.4%
Cap rate
0.4%
Rent to Value Ratio
Active
$640,000
3
bds
|
3
ba
|
1,800
sqft
|
built
1997
2960 E Yarrow Cir, Superior, CO 80027
$-1,270
Cash flow
-10.4%
Cash-on-Cash Return
3.3%
Cap rate
0.5%
Rent to Value Ratio