Sycamore, IL Investment Properties for Sale
Browse homes for sale and investment properties in Sycamore, IL. Refine your search by price, property type, or more.
Best cash flowing properties in Sycamore, IL
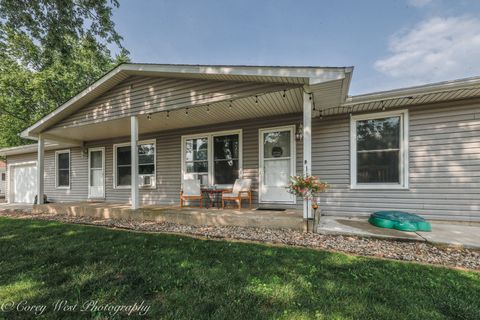
Active
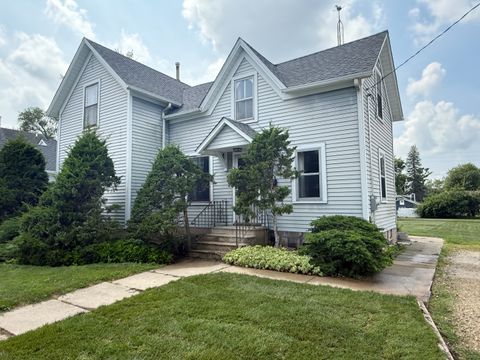
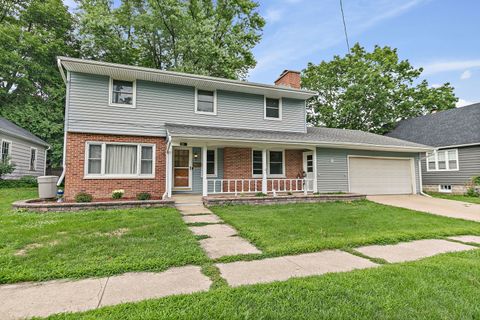
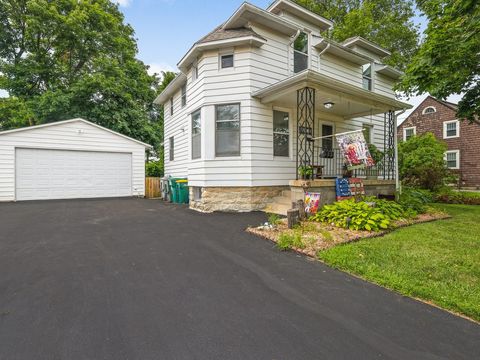
$194,900
4
bds
|
2
ba
|
1,720
sqft
|
built
1920
719 Park Ave, Sycamore, IL 60178
$120
Cash flow
3.2%
Cash-on-Cash Return
6.4%
Cap rate
1.0%
Rent to Value Ratio
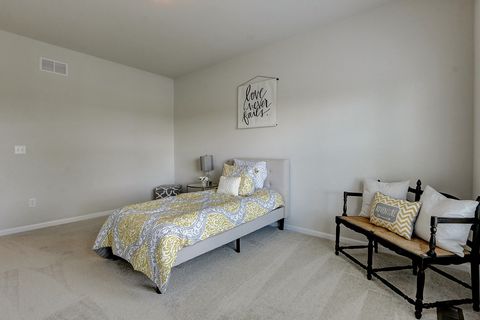
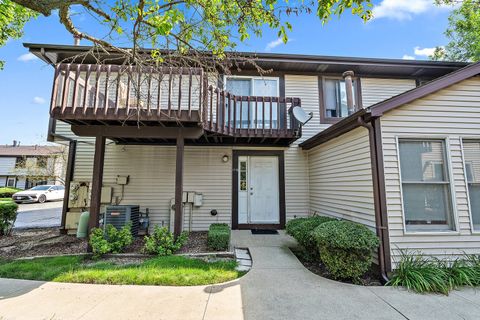
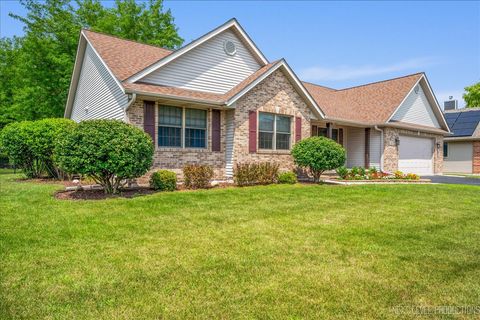
Active
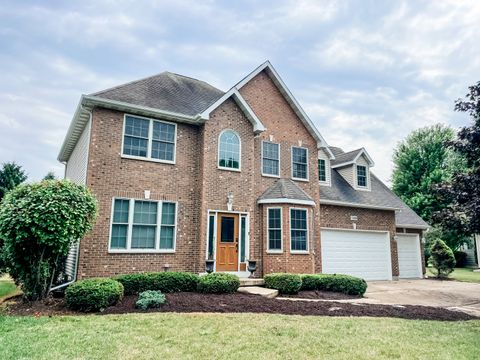
$439,900
3
bds
|
2
ba
|
1,870
sqft
|
built
2020
437 E Becker Pl, Sycamore, IL 60178
$95
Cash flow
1.1%
Cash-on-Cash Return
5.9%
Cap rate
0.7%
Rent to Value Ratio
20 out of 28 properties for sale in Sycamore, IL
Limited Results Shown
Create a free account, or log in to reveal all property listings and enjoy the complete experience.
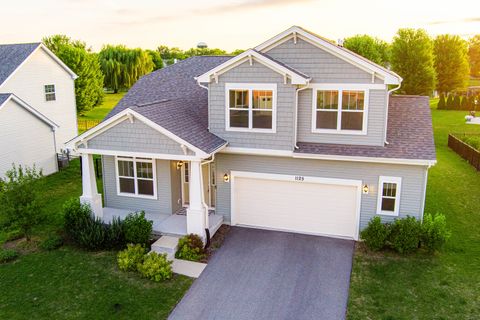
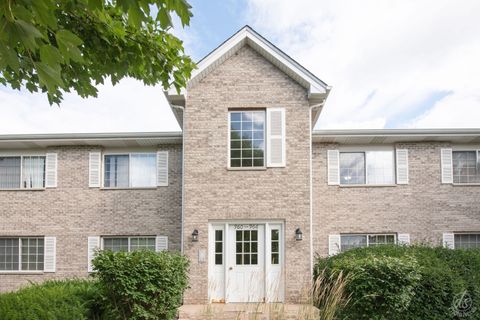
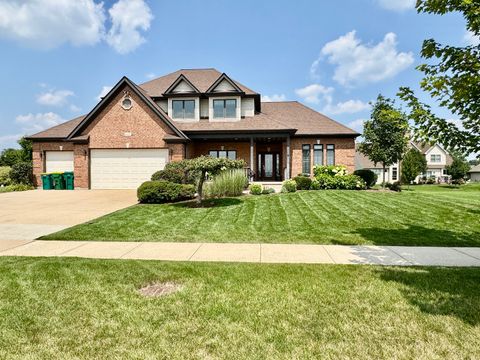
Active
$415,000
4
bds
|
3
ba
|
2,019
sqft
|
built
2022
1125 Juniper Dr, Sycamore, IL 60178
$-734
Cash flow
-9.2%
Cash-on-Cash Return
3.6%
Cap rate
0.8%
Rent to Value Ratio
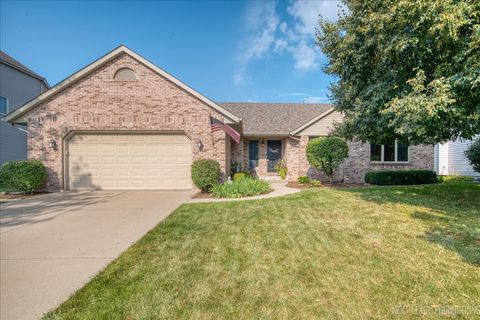
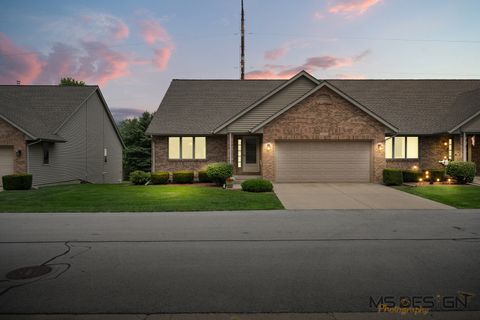
Active
$419,900
3
bds
|
3
ba
|
2,298
sqft
|
built
1998
1331 Yorkshire Dr N, Sycamore, IL 60178
$-1,010
Cash flow
-12.5%
Cash-on-Cash Return
2.8%
Cap rate
0.6%
Rent to Value Ratio
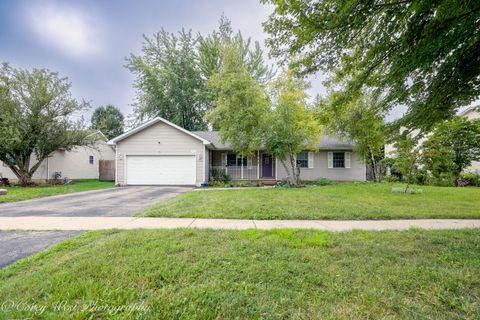
Active
$187,900
3
bds
|
1
ba
|
1,056
sqft
|
built
1977
1715 Cedarbrook Ct, Sycamore, IL 60178
$-128
Cash flow
-3.6%
Cash-on-Cash Return
4.9%
Cap rate
1.0%
Rent to Value Ratio
Active
$184,900
2
bds
|
2
ba
|
1,220
sqft
|
built
1997
966 Constance Ln, Sycamore, IL 60178
$-138
Cash flow
-3.9%
Cash-on-Cash Return
4.8%
Cap rate
1.0%
Rent to Value Ratio
Active
$350,000
3
bds
|
2
ba
|
0
sqft
|
built
1996
134 Brian St, Sycamore, IL 60178
$-537
Cash flow
-8.0%
Cash-on-Cash Return
3.8%
Cap rate
0.7%
Rent to Value Ratio
Active
$339,800
4
bds
|
3
ba
|
1,980
sqft
|
built
1965
211 E Ottawa St, Sycamore, IL 60178
$-341
Cash flow
-5.2%
Cash-on-Cash Return
4.5%
Cap rate
0.8%
Rent to Value Ratio
Active
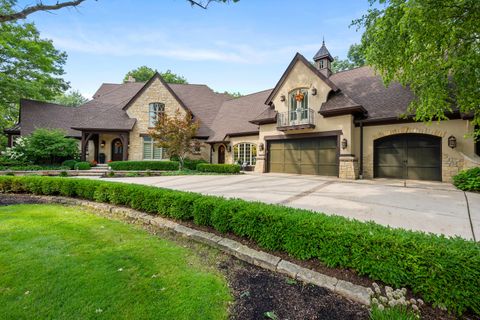
$1,299,000
4
bds
|
8
ba
|
8,440
sqft
|
built
2009
361 Merry Oaks Dr, Sycamore, IL 60178
$-3,699
Cash flow
-14.9%
Cash-on-Cash Return
2.3%
Cap rate
0.5%
Rent to Value Ratio
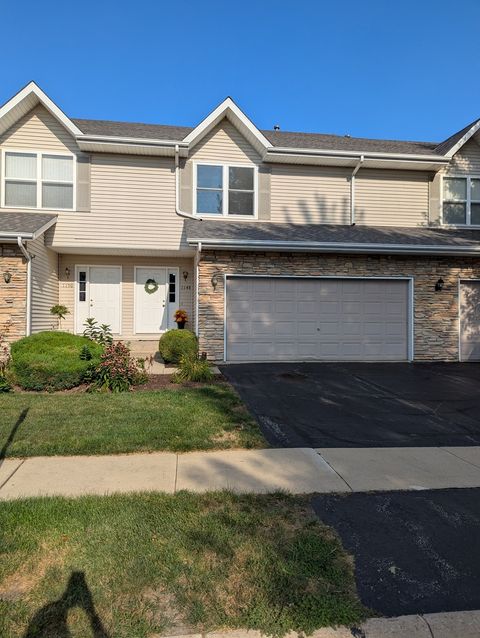
Active
$249,900
2
bds
|
4
ba
|
1,778
sqft
|
built
2005
1148 Rose Dr, Sycamore, IL 60178
$-265
Cash flow
-5.5%
Cash-on-Cash Return
4.4%
Cap rate
0.9%
Rent to Value Ratio
Active
$314,900
6
bds
|
3
ba
|
0
sqft
|
built
1962
1509 Oak Ln, Sycamore, IL 60178
$-237
Cash flow
-3.9%
Cash-on-Cash Return
4.8%
Cap rate
0.8%
Rent to Value Ratio
Active
$225,000
4
bds
|
2
ba
|
2,150
sqft
|
built
1900
822 Dekalb Ave, Sycamore, IL 60178
$95
Cash flow
2.2%
Cash-on-Cash Return
6.2%
Cap rate
1.1%
Rent to Value Ratio
Active
$424,900
3
bds
|
3
ba
|
2,000
sqft
|
built
2002
475 John Marshall Ln, Sycamore, IL 60178
$-1,178
Cash flow
-14.5%
Cash-on-Cash Return
2.4%
Cap rate
0.6%
Rent to Value Ratio
Active
$595,000
4
bds
|
4
ba
|
2,600
sqft
|
built
2007
607 Emanuel Ln, Sycamore, IL 60178
$-998
Cash flow
-8.8%
Cash-on-Cash Return
3.7%
Cap rate
0.7%
Rent to Value Ratio
Active
$330,000
2
bds
|
2
ba
|
1,683
sqft
|
built
1993
1123 Milan Dr N, Sycamore, IL 60178
$-672
Cash flow
-10.6%
Cash-on-Cash Return
3.2%
Cap rate
0.8%
Rent to Value Ratio
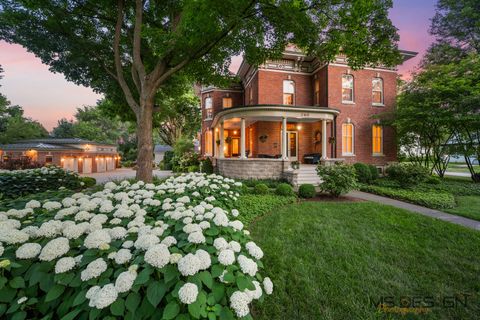
Active
$725,000
5
bds
|
3
ba
|
4,913
sqft
|
built
1873
740 W State St, Sycamore, IL 60178
$-2,962
Cash flow
-21.3%
Cash-on-Cash Return
0.8%
Cap rate
0.4%
Rent to Value Ratio
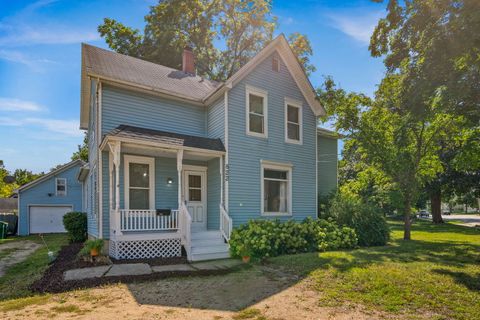
Active
$289,900
4
bds
|
1
ba
|
1,744
sqft
|
built
1900
250 Edward St, Sycamore, IL 60178
$-390
Cash flow
-7.0%
Cash-on-Cash Return
4.1%
Cap rate
0.7%
Rent to Value Ratio
Active
$449,900
4
bds
|
3
ba
|
3,672
sqft
|
built
2005
1308 Axcel Ln, Sycamore, IL 60178
$-1,492
Cash flow
-17.3%
Cash-on-Cash Return
1.7%
Cap rate
0.5%
Rent to Value Ratio
Active
$1,399,000
3
bds
|
3
ba
|
2,486
sqft
|
built
2002
14N700 Factly Rd, Sycamore, IL 60178
$-4,795
Cash flow
-17.9%
Cash-on-Cash Return
1.6%
Cap rate
0.3%
Rent to Value Ratio
Active
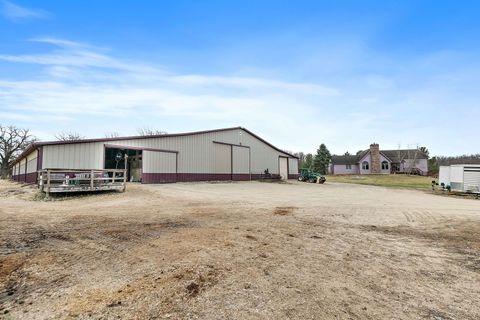
$359,900
3
bds
|
1
ba
|
1,478
sqft
|
built
1886
28234 Brickville Rd, Sycamore, IL 60178
$-706
Cash flow
-10.2%
Cash-on-Cash Return
3.3%
Cap rate
0.6%
Rent to Value Ratio