Thibodaux, LA Investment Properties for Sale
Browse homes for sale and investment properties in Thibodaux, LA. Refine your search by price, property type, or more.
Best cash flowing properties in Thibodaux, LA
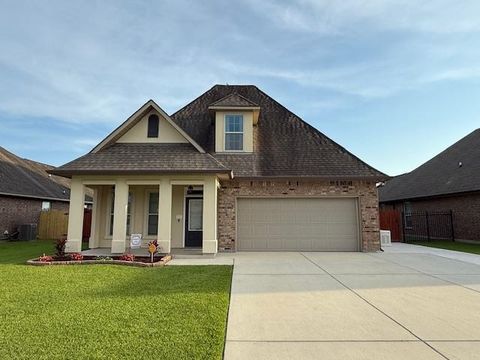
Active
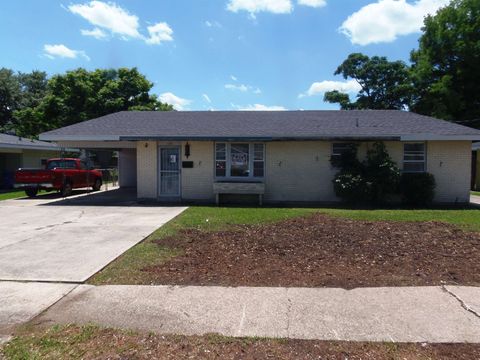
$95,900
3
bds
|
3
ba
|
2,244
sqft
|
built
1960
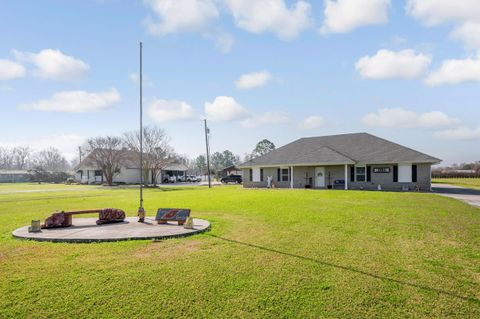
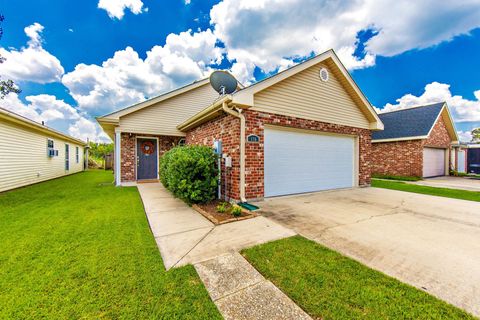
106 Apricot St, Thibodaux, LA 70301
$788
Cash flow
42.9%
Cash-on-Cash Return
15.5%
Cap rate
1.9%
Rent to Value Ratio
Active
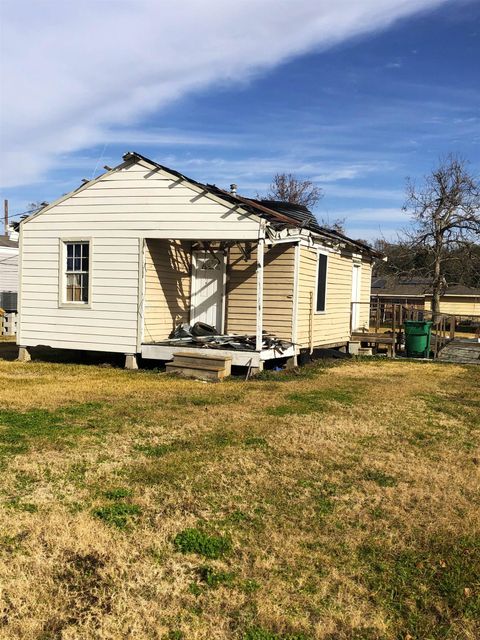
$62,000
2
bds
|
1
ba
|
624
sqft
|
built
1949
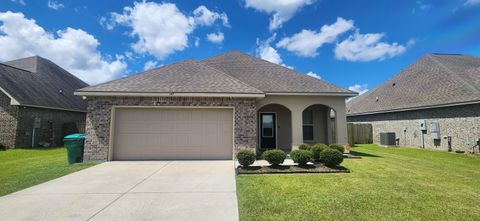
2305 Saint Bernard St, Thibodaux, LA 70301
$759
Cash flow
14.3%
Cash-on-Cash Return
14.7%
Cap rate
1.8%
Rent to Value Ratio
85 out of 105 properties for sale in Thibodaux, LA
Limited Results Shown
Create a free account, or log in to reveal all property listings and enjoy the complete experience.
Active
$287,000
4
bds
|
2
ba
|
1,885
sqft
|
built
2016
383 Kleinpeter Dr, Thibodaux, LA 70301
$160
Cash flow
2.9%
Cash-on-Cash Return
6.3%
Cap rate
0.8%
Rent to Value Ratio
Active
$309,000
3
bds
|
2
ba
|
2,750
sqft
|
built
1925
305 E 2nd St, Thibodaux, LA 70301
$-82
Cash flow
-1.4%
Cash-on-Cash Return
5.4%
Cap rate
0.6%
Rent to Value Ratio
Active
$599,000
3
bds
|
2
ba
|
2,260
sqft
|
built
2007
1294 Burma Rd, Thibodaux, LA 70301
$-1,455
Cash flow
-12.7%
Cash-on-Cash Return
2.8%
Cap rate
0.3%
Rent to Value Ratio
Active
$395,000
4
bds
|
3
ba
|
2,622
sqft
|
built
2020
306 Royal Oak Blvd, Thibodaux, LA 70301
$-330
Cash flow
-4.4%
Cash-on-Cash Return
4.7%
Cap rate
0.6%
Rent to Value Ratio
Active
$173,000
3
bds
|
2
ba
|
1,639
sqft
|
built
1983
251 Bayou Vista Dr, Thibodaux, LA 70301
$423
Cash flow
12.8%
Cash-on-Cash Return
8.6%
Cap rate
1.0%
Rent to Value Ratio
Active
$399,900
4
bds
|
2
ba
|
2,916
sqft
|
built
1975
1611 Saint Mary St, Thibodaux, LA 70301
$-512
Cash flow
-6.7%
Cash-on-Cash Return
4.1%
Cap rate
0.5%
Rent to Value Ratio
Active
$345,000
4
bds
|
3
ba
|
2,424
sqft
|
built
2017
371 Pond Dr, Thibodaux, LA 70301
$-274
Cash flow
-4.1%
Cash-on-Cash Return
4.7%
Cap rate
0.6%
Rent to Value Ratio
Active
$250,000
4
bds
|
2
ba
|
2,110
sqft
|
built
1976
206 Glenn St, Thibodaux, LA 70301
$59
Cash flow
1.2%
Cash-on-Cash Return
6.0%
Cap rate
0.7%
Rent to Value Ratio
Active
$1,100,000
5
bds
|
5
ba
|
4,662
sqft
|
built
2004
205 E Plater Dr, Thibodaux, LA 70301
$-2,998
Cash flow
-14.2%
Cash-on-Cash Return
2.4%
Cap rate
0.3%
Rent to Value Ratio
Active
$247,500
3
bds
|
2
ba
|
1,718
sqft
|
built
2013
258 Harvest Ct, Thibodaux, LA 70301
$71
Cash flow
1.5%
Cash-on-Cash Return
6.0%
Cap rate
0.7%
Rent to Value Ratio
Active
$260,000
4
bds
|
3
ba
|
1,782
sqft
|
built
2021
114 Shadow Pointe Rd, Thibodaux, LA 70301
$-8
Cash flow
-0.2%
Cash-on-Cash Return
5.6%
Cap rate
0.7%
Rent to Value Ratio
Active
$189,000
3
bds
|
2
ba
|
1,692
sqft
|
built
1959
204 Tiger Dr, Thibodaux, LA 70301
$210
Cash flow
5.8%
Cash-on-Cash Return
7.0%
Cap rate
0.8%
Rent to Value Ratio
Active
$289,000
4
bds
|
3
ba
|
1,851
sqft
|
built
2022
155 Magazine Loop, Thibodaux, LA 70301
$-105
Cash flow
-1.9%
Cash-on-Cash Return
5.2%
Cap rate
0.7%
Rent to Value Ratio
Active
$255,000
3
bds
|
2
ba
|
1,481
sqft
|
built
2006
139 Natchez Dr, Thibodaux, LA 70301
$35
Cash flow
0.7%
Cash-on-Cash Return
5.8%
Cap rate
0.7%
Rent to Value Ratio
Active
$179,900
3
bds
|
2
ba
|
1,384
sqft
|
built
2004
176 Jolie Oaks Blvd, Thibodaux, LA 70301
$253
Cash flow
7.3%
Cash-on-Cash Return
7.4%
Cap rate
0.9%
Rent to Value Ratio
Active
$247,000
3
bds
|
2
ba
|
1,613
sqft
|
built
2020
147 Cesare Dr, Thibodaux, LA 70301
$52
Cash flow
1.1%
Cash-on-Cash Return
5.9%
Cap rate
0.7%
Rent to Value Ratio
Active
$740,000
3
bds
|
5
ba
|
3,398
sqft
|
built
1980
525 Supercharge Dr, Thibodaux, LA 70301
$-1,570
Cash flow
-11.1%
Cash-on-Cash Return
3.1%
Cap rate
0.4%
Rent to Value Ratio
Active
$175,400
2
bds
|
1
ba
|
1,216
sqft
|
built
1975
702 Coulon Rd, Thibodaux, LA 70301
$136
Cash flow
4.0%
Cash-on-Cash Return
6.6%
Cap rate
0.8%
Rent to Value Ratio
Active
$389,000
3
bds
|
2
ba
|
2,029
sqft
|
built
2005
435 Glenwild Dr, Thibodaux, LA 70301
$-185
Cash flow
-2.5%
Cash-on-Cash Return
5.1%
Cap rate
0.6%
Rent to Value Ratio
Active
$255,000
3
bds
|
2
ba
|
1,756
sqft
|
built
2002
109 Rosedown Dr, Thibodaux, LA 70301
$35
Cash flow
0.7%
Cash-on-Cash Return
5.8%
Cap rate
0.7%
Rent to Value Ratio
Active
$125,000
bds
|
0
ba
|
1,200
sqft
|
built
722 Bayou Rd, Thibodaux, LA 70301
$305
Cash flow
12.7%
Cash-on-Cash Return
8.6%
Cap rate
1.0%
Rent to Value Ratio
Active
$286,000
3
bds
|
2
ba
|
2,097
sqft
|
built
1978
304 Winder Rd, Thibodaux, LA 70301
$-111
Cash flow
-2.0%
Cash-on-Cash Return
5.2%
Cap rate
0.6%
Rent to Value Ratio
Active
$220,000
3
bds
|
2
ba
|
1,351
sqft
|
built
2022
317 Outpost Way, Thibodaux, LA 70301
$44
Cash flow
1.0%
Cash-on-Cash Return
5.9%
Cap rate
0.7%
Rent to Value Ratio
Active
$185,000
3
bds
|
2
ba
|
1,150
sqft
|
built
2011
109 Sagewood Dr, Thibodaux, LA 70301
$91
Cash flow
2.6%
Cash-on-Cash Return
6.3%
Cap rate
0.8%
Rent to Value Ratio
Active
$242,000
3
bds
|
2
ba
|
1,551
sqft
|
built
2022
270 Shadow Pointe Rd, Thibodaux, LA 70301
$78
Cash flow
1.7%
Cash-on-Cash Return
6.1%
Cap rate
0.7%
Rent to Value Ratio
Active
$315,000
3
bds
|
3
ba
|
2,597
sqft
|
built
1977
200 Wintergreen St, Thibodaux, LA 70301
$234
Cash flow
3.9%
Cash-on-Cash Return
6.6%
Cap rate
0.8%
Rent to Value Ratio
Active
$225,000
3
bds
|
2
ba
|
1,483
sqft
|
built
2018
2584 Pineridge St, Thibodaux, LA 70301
$39
Cash flow
0.9%
Cash-on-Cash Return
5.9%
Cap rate
0.7%
Rent to Value Ratio
Active
$221,000
3
bds
|
2
ba
|
1,356
sqft
|
built
2015
150 Petal Ave, Thibodaux, LA 70301
$58
Cash flow
1.4%
Cash-on-Cash Return
6.0%
Cap rate
0.7%
Rent to Value Ratio
Active
$675,000
4
bds
|
4
ba
|
4,270
sqft
|
built
1998
200 Rienzi Dr, Thibodaux, LA 70301
$-1,193
Cash flow
-9.2%
Cash-on-Cash Return
3.6%
Cap rate
0.4%
Rent to Value Ratio
Active
$299,000
4
bds
|
3
ba
|
2,235
sqft
|
built
1974
818 Oak Ln, Thibodaux, LA 70301
$-311
Cash flow
-5.4%
Cash-on-Cash Return
4.4%
Cap rate
0.5%
Rent to Value Ratio
Active
$229,500
3
bds
|
2
ba
|
1,478
sqft
|
built
1949
131 Pecan St, Thibodaux, LA 70301
$18
Cash flow
0.4%
Cash-on-Cash Return
5.8%
Cap rate
0.7%
Rent to Value Ratio
Active
$228,000
3
bds
|
2
ba
|
1,438
sqft
|
built
2019
234 Colony Station St, Thibodaux, LA 70301
$143
Cash flow
3.3%
Cash-on-Cash Return
6.4%
Cap rate
0.8%
Rent to Value Ratio
Active
$290,000
4
bds
|
2
ba
|
1,885
sqft
|
built
2015
366 Crossing North St, Thibodaux, LA 70301
$146
Cash flow
2.6%
Cash-on-Cash Return
6.3%
Cap rate
0.8%
Rent to Value Ratio
Active
$147,000
2
bds
|
1
ba
|
772
sqft
|
built
1930
1019 Ridgefield Rd, Thibodaux, LA 70301
$201
Cash flow
7.1%
Cash-on-Cash Return
7.3%
Cap rate
0.9%
Rent to Value Ratio
Active
$299,000
4
bds
|
3
ba
|
1,689
sqft
|
built
2009
176 Lake Howard Ave, Thibodaux, LA 70301
$-68
Cash flow
-1.2%
Cash-on-Cash Return
5.4%
Cap rate
0.7%
Rent to Value Ratio
Active
$205,000
3
bds
|
2
ba
|
1,356
sqft
|
built
2014
198 Southern Cir, Thibodaux, LA 70301
$272
Cash flow
6.9%
Cash-on-Cash Return
7.3%
Cap rate
0.9%
Rent to Value Ratio
Active
$190,000
3
bds
|
2
ba
|
1,684
sqft
|
built
1972
2540 Highway 1, Thibodaux, LA 70301
$67
Cash flow
1.8%
Cash-on-Cash Return
6.1%
Cap rate
0.7%
Rent to Value Ratio
Active
$82,000
2
bds
|
1
ba
|
762
sqft
|
built
1945
610 Sycamore St, Thibodaux, LA 70301
$509
Cash flow
32.4%
Cash-on-Cash Return
13.1%
Cap rate
1.6%
Rent to Value Ratio