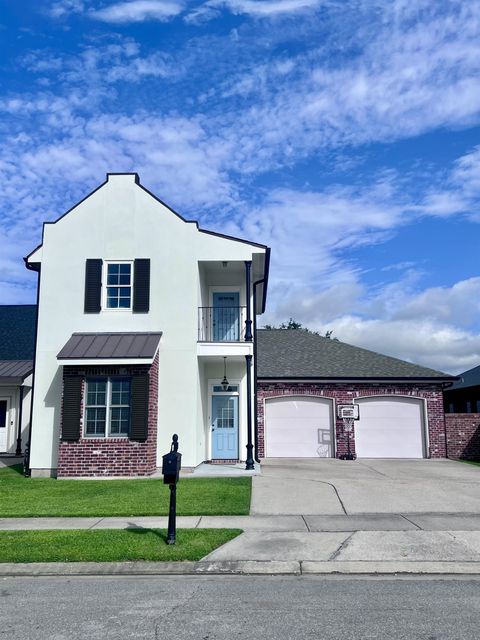
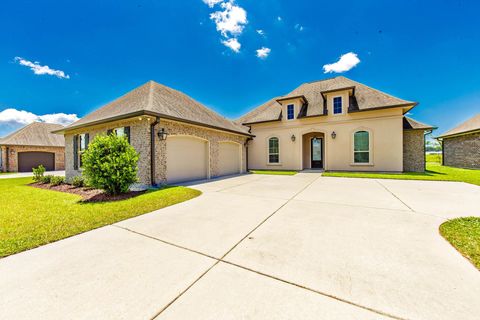
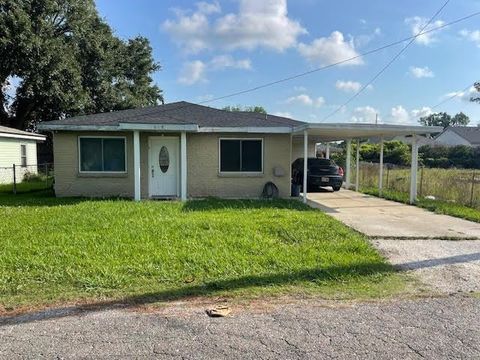
Thibodaux, LA Investment Properties for Sale
Browse homes for sale and investment properties in Thibodaux, LA. Refine your search by price, property type, or more.
Best cash flowing properties in Thibodaux, LA
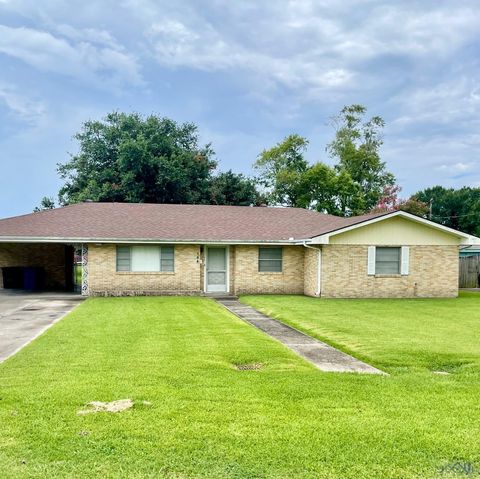
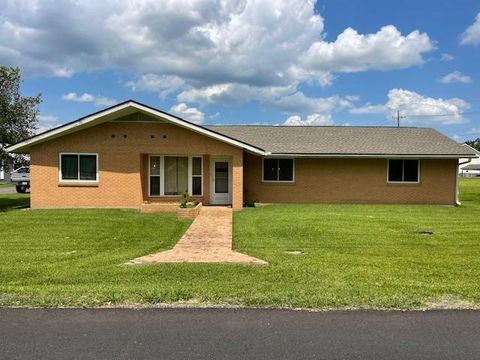
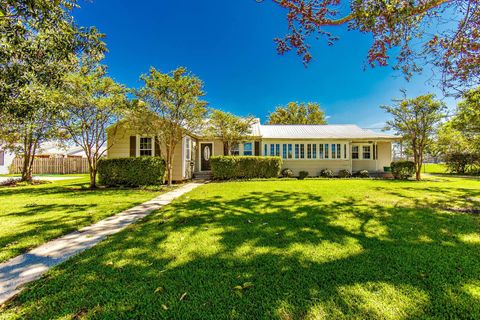
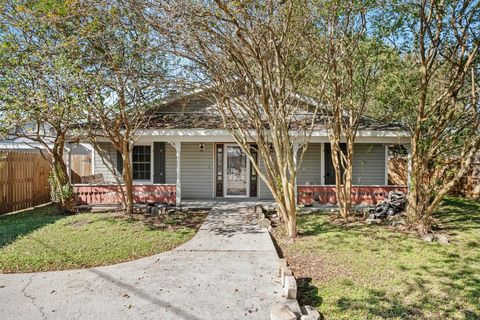
Active
$100,000
2
bds
|
1
ba
|
1,065
sqft
|
built
1960
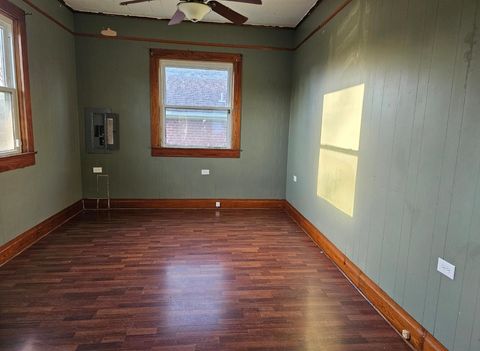
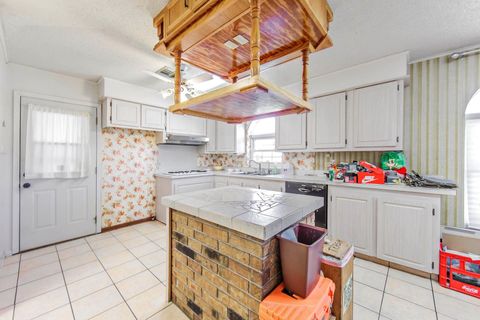
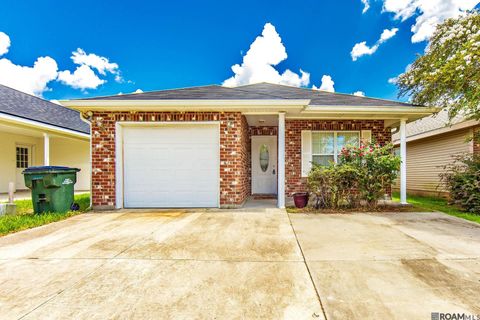
1016 Harrison St, Thibodaux, LA 70301
$631
Cash flow
32.9%
Cash-on-Cash Return
13.2%
Cap rate
1.6%
Rent to Value Ratio
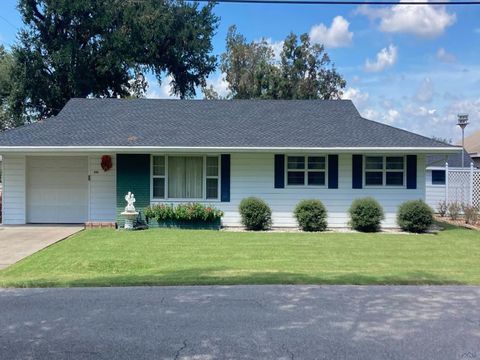
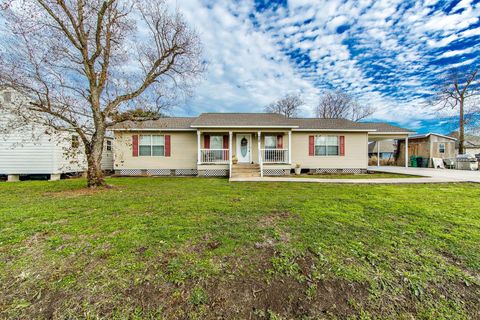
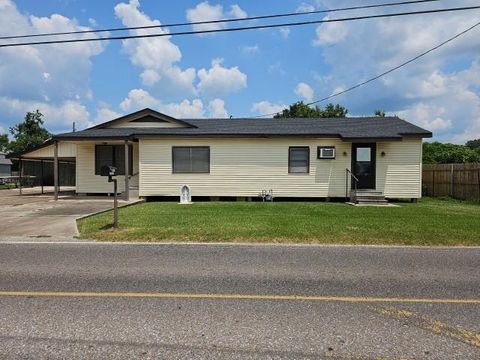
Active
$75,000
3
bds
|
2
ba
|
1,260
sqft
|
built
1982
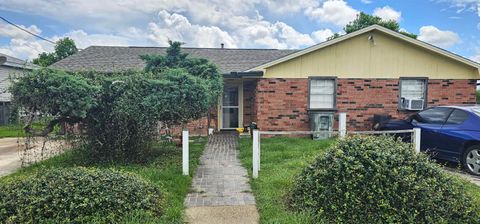
1131 Louise St, Thibodaux, LA 70301
$611
Cash flow
42.5%
Cash-on-Cash Return
15.5%
Cap rate
1.9%
Rent to Value Ratio
90 out of 110 properties for sale in Thibodaux, LA
Limited Results Shown
Create a free account, or log in to reveal all property listings and enjoy the complete experience.
Active
$299,000
4
bds
|
3
ba
|
1,689
sqft
|
built
2009
176 Lake Howard Ave, Thibodaux, LA 70301
$-68
Cash flow
-1.2%
Cash-on-Cash Return
5.4%
Cap rate
0.7%
Rent to Value Ratio
Active
$205,000
3
bds
|
2
ba
|
1,356
sqft
|
built
2014
198 Southern Cir, Thibodaux, LA 70301
$272
Cash flow
6.9%
Cash-on-Cash Return
7.3%
Cap rate
0.9%
Rent to Value Ratio
Active
$190,000
4
bds
|
2
ba
|
1,681
sqft
|
built
1970
144 Pecan St, Thibodaux, LA 70301
$205
Cash flow
5.6%
Cash-on-Cash Return
7.0%
Cap rate
0.8%
Rent to Value Ratio
Active
$215,000
3
bds
|
2
ba
|
1,424
sqft
|
built
2021
302 Outpost Way, Thibodaux, LA 70301
$87
Cash flow
2.1%
Cash-on-Cash Return
6.2%
Cap rate
0.7%
Rent to Value Ratio
Active
$425,000
4
bds
|
4
ba
|
2,182
sqft
|
built
2009
160 Samantha Dr, Thibodaux, LA 70301
$-493
Cash flow
-6.1%
Cash-on-Cash Return
4.3%
Cap rate
0.5%
Rent to Value Ratio
Active
$425,000
4
bds
|
3
ba
|
2,115
sqft
|
built
1994
210 Davis Dr, Thibodaux, LA 70301
$-493
Cash flow
-6.1%
Cash-on-Cash Return
4.3%
Cap rate
0.5%
Rent to Value Ratio
Active
$214,000
4
bds
|
2
ba
|
1,852
sqft
|
built
1970
103 Coulon Rd, Thibodaux, LA 70301
$229
Cash flow
5.6%
Cash-on-Cash Return
7.0%
Cap rate
0.8%
Rent to Value Ratio
Active
$440,000
3
bds
|
3
ba
|
2,306
sqft
|
built
2007
122 Rue Celeste, Thibodaux, LA 70301
$-205
Cash flow
-2.4%
Cash-on-Cash Return
5.1%
Cap rate
0.6%
Rent to Value Ratio
Active
$370,000
4
bds
|
3
ba
|
2,610
sqft
|
built
2019
362 Royal Oak Blvd, Thibodaux, LA 70301
$134
Cash flow
1.9%
Cash-on-Cash Return
6.1%
Cap rate
0.8%
Rent to Value Ratio
Active
$139,000
3
bds
|
1
ba
|
1,110
sqft
|
built
2005
615 Locust St, Thibodaux, LA 70301
$308
Cash flow
11.6%
Cash-on-Cash Return
8.3%
Cap rate
1.0%
Rent to Value Ratio
Active
$239,000
3
bds
|
2
ba
|
2,260
sqft
|
built
1973
815 Levert Dr, Thibodaux, LA 70301
$-30
Cash flow
-0.7%
Cash-on-Cash Return
5.5%
Cap rate
0.7%
Rent to Value Ratio
Active
$199,000
3
bds
|
2
ba
|
1,740
sqft
|
built
1961
300 Coulon Rd, Thibodaux, LA 70301
$162
Cash flow
4.2%
Cash-on-Cash Return
6.7%
Cap rate
0.8%
Rent to Value Ratio
Active
$429,900
3
bds
|
2
ba
|
2,967
sqft
|
built
2008
613 N Canal Blvd, Thibodaux, LA 70301
$-447
Cash flow
-5.4%
Cash-on-Cash Return
4.4%
Cap rate
0.5%
Rent to Value Ratio
Active
$280,000
3
bds
|
2
ba
|
1,525
sqft
|
built
1994
110 Legendre Dr, Thibodaux, LA 70301
$-83
Cash flow
-1.5%
Cash-on-Cash Return
5.3%
Cap rate
0.6%
Rent to Value Ratio
Active
$157,000
3
bds
|
2
ba
|
2,103
sqft
|
built
1974
603 Lafourche Dr, Thibodaux, LA 70301
$499
Cash flow
16.6%
Cash-on-Cash Return
9.5%
Cap rate
1.1%
Rent to Value Ratio
Active
$175,000
3
bds
|
2
ba
|
1,440
sqft
|
built
2001
2531 W Camellia Dr, Thibodaux, LA 70301
$207
Cash flow
6.2%
Cash-on-Cash Return
7.1%
Cap rate
0.9%
Rent to Value Ratio
Active
$485,000
3
bds
|
2
ba
|
2,626
sqft
|
built
1932
649 Highway 308, Thibodaux, LA 70301
$-915
Cash flow
-9.8%
Cash-on-Cash Return
3.4%
Cap rate
0.4%
Rent to Value Ratio
Active
$145,000
3
bds
|
1
ba
|
1,776
sqft
|
built
1950
574 Goode St, Thibodaux, LA 70301
$556
Cash flow
20.0%
Cash-on-Cash Return
10.3%
Cap rate
1.2%
Rent to Value Ratio
Active
$175,000
3
bds
|
2
ba
|
1,215
sqft
|
built
2000
235 Jolie Oaks Blvd, Thibodaux, LA 70301
$138
Cash flow
4.1%
Cash-on-Cash Return
6.6%
Cap rate
0.8%
Rent to Value Ratio
Active
$460,000
4
bds
|
3
ba
|
1,951
sqft
|
built
1891
528 Canal Blvd, Thibodaux, LA 70301
$31
Cash flow
0.4%
Cash-on-Cash Return
5.8%
Cap rate
0.7%
Rent to Value Ratio
Active
$199,000
4
bds
|
3
ba
|
2,367
sqft
|
built
1944
132 Goode St, Thibodaux, LA 70301
$300
Cash flow
7.9%
Cash-on-Cash Return
7.5%
Cap rate
0.9%
Rent to Value Ratio
Active
$247,000
3
bds
|
2
ba
|
1,604
sqft
|
built
2008
132 Cane Break Dr, Thibodaux, LA 70301
$4
Cash flow
0.1%
Cash-on-Cash Return
5.7%
Cap rate
0.7%
Rent to Value Ratio
Active
$185,000
4
bds
|
2
ba
|
2,393
sqft
|
built
2006
1100 Tiger Dr, Thibodaux, LA 70301
$229
Cash flow
6.5%
Cash-on-Cash Return
7.2%
Cap rate
0.9%
Rent to Value Ratio
Active
$160,900
3
bds
|
3
ba
|
1,573
sqft
|
built
1954
112 Duplantis St, Thibodaux, LA 70301
$343
Cash flow
11.1%
Cash-on-Cash Return
8.2%
Cap rate
1.0%
Rent to Value Ratio
Active
$290,000
4
bds
|
2
ba
|
2,454
sqft
|
built
1985
306 Ashland Dr, Thibodaux, LA 70301
$146
Cash flow
2.6%
Cash-on-Cash Return
6.3%
Cap rate
0.8%
Rent to Value Ratio
Active
$225,000
4
bds
|
3
ba
|
1,738
sqft
|
built
1980
120 Bayou Vista Dr, Thibodaux, LA 70301
$-99
Cash flow
-2.3%
Cash-on-Cash Return
5.2%
Cap rate
0.6%
Rent to Value Ratio
Active
$550,000
3
bds
|
2
ba
|
2,247
sqft
|
built
2011
136 Margaret St, Thibodaux, LA 70301
$-1,223
Cash flow
-11.6%
Cash-on-Cash Return
3.0%
Cap rate
0.4%
Rent to Value Ratio
Active
$379,900
4
bds
|
2
ba
|
2,636
sqft
|
built
1979
106 E Garden Dr, Thibodaux, LA 70301
$-283
Cash flow
-3.9%
Cash-on-Cash Return
4.8%
Cap rate
0.6%
Rent to Value Ratio
Active
$339,000
3
bds
|
2
ba
|
1,800
sqft
|
built
2022
150 Royal Oak Blvd, Thibodaux, LA 70301
$-59
Cash flow
-0.9%
Cash-on-Cash Return
5.5%
Cap rate
0.7%
Rent to Value Ratio
Active
$239,000
3
bds
|
2
ba
|
1,904
sqft
|
built
1995
310 Lee Dr, Thibodaux, LA 70301
$42
Cash flow
0.9%
Cash-on-Cash Return
5.9%
Cap rate
0.7%
Rent to Value Ratio
Active
$1,250,000
4
bds
|
3
ba
|
4,142
sqft
|
built
2009
156 Northlake Dr, Thibodaux, LA 70301
$-3,525
Cash flow
-14.7%
Cash-on-Cash Return
2.3%
Cap rate
0.3%
Rent to Value Ratio
Active
$675,000
4
bds
|
2
ba
|
4,418
sqft
|
built
1978
235 Rienzi Dr, Thibodaux, LA 70301
$-1,193
Cash flow
-9.2%
Cash-on-Cash Return
3.6%
Cap rate
0.4%
Rent to Value Ratio
Active
$134,900
5
bds
|
2
ba
|
2,575
sqft
|
built
1953
1718 Oakley St, Thibodaux, LA 70301
$535
Cash flow
20.7%
Cash-on-Cash Return
10.4%
Cap rate
1.3%
Rent to Value Ratio
Active
$225,000
3
bds
|
2
ba
|
1,463
sqft
|
built
2014
127 Petal Ave, Thibodaux, LA 70301
$39
Cash flow
0.9%
Cash-on-Cash Return
5.9%
Cap rate
0.7%
Rent to Value Ratio
Active
$235,000
4
bds
|
2
ba
|
1,662
sqft
|
built
2007
2464 Pineridge St, Thibodaux, LA 70301
$-8
Cash flow
-0.2%
Cash-on-Cash Return
5.6%
Cap rate
0.7%
Rent to Value Ratio
Active
$1,850,000
5
bds
|
7
ba
|
6,960
sqft
|
built
1949
2123 Saint Mary St, Thibodaux, LA 70301
$-6,961
Cash flow
-19.6%
Cash-on-Cash Return
1.2%
Cap rate
0.1%
Rent to Value Ratio
Active
$99,000
2
bds
|
1
ba
|
1,157
sqft
|
built
1950
210 E 10th St, Thibodaux, LA 70301
$359
Cash flow
18.9%
Cash-on-Cash Return
10.0%
Cap rate
1.2%
Rent to Value Ratio
Active
$475,000
4
bds
|
3
ba
|
1,762
sqft
|
built
2016
254 Baja Trl, Thibodaux, LA 70301
$-109
Cash flow
-1.2%
Cash-on-Cash Return
5.4%
Cap rate
0.7%
Rent to Value Ratio