Tinley Park, IL Investment Properties for Sale
Browse homes for sale and investment properties in Tinley Park, IL. Refine your search by price, property type, or more.
Best cash flowing properties in Tinley Park, IL
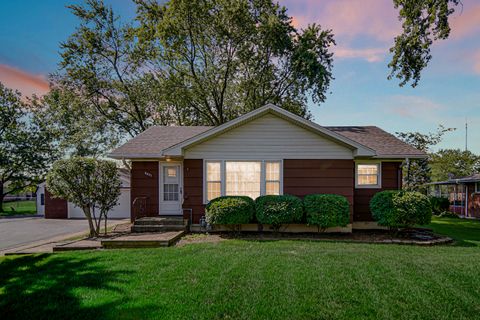
Active
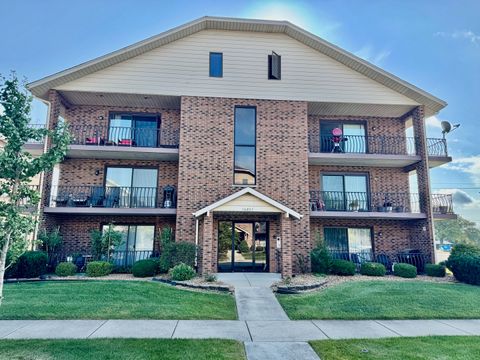
$189,900
2
bds
|
1
ba
|
925
sqft
|
built
1986
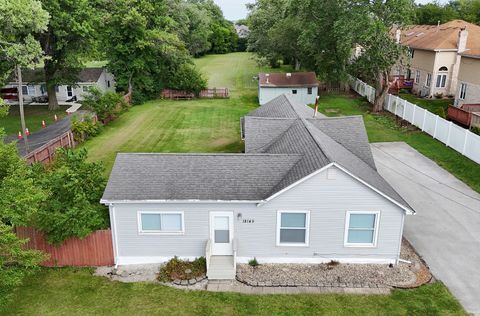
16837 81st Ave, Tinley Park, IL 60477
$113
Cash flow
3.1%
Cash-on-Cash Return
6.4%
Cap rate
1.2%
Rent to Value Ratio
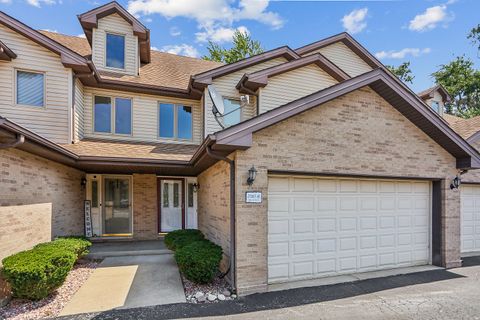
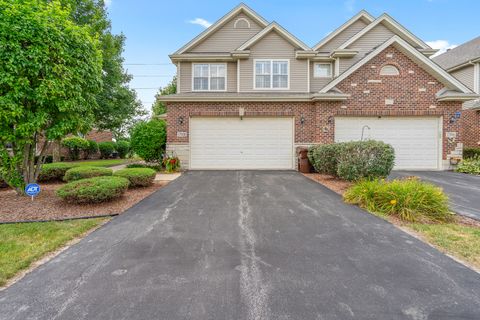
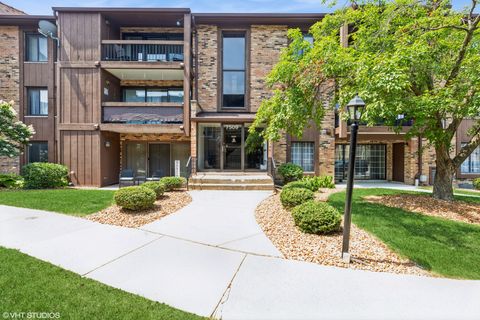
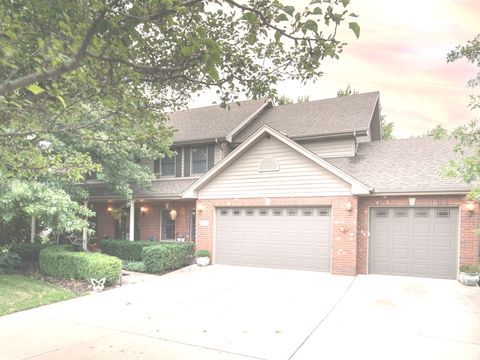
Active
$270,000
2
bds
|
3
ba
|
1,684
sqft
|
built
2001
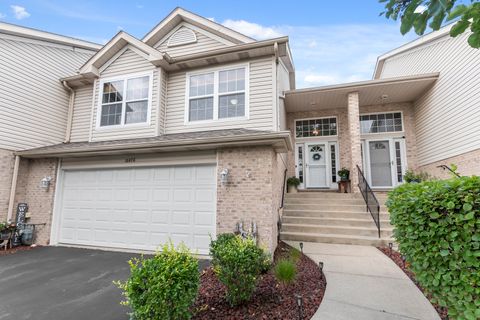
7025 167th St, Tinley Park, IL 60477
$77
Cash flow
1.5%
Cash-on-Cash Return
6.0%
Cap rate
1.0%
Rent to Value Ratio
56 out of 67 properties for sale in Tinley Park, IL
Limited Results Shown
Create a free account, or log in to reveal all property listings and enjoy the complete experience.
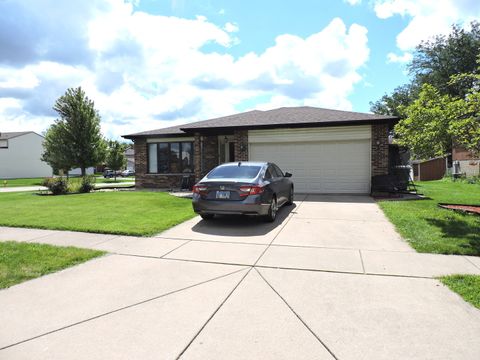
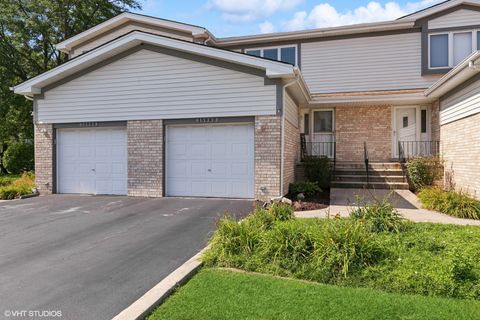
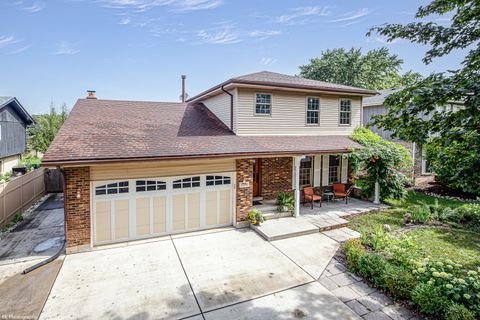
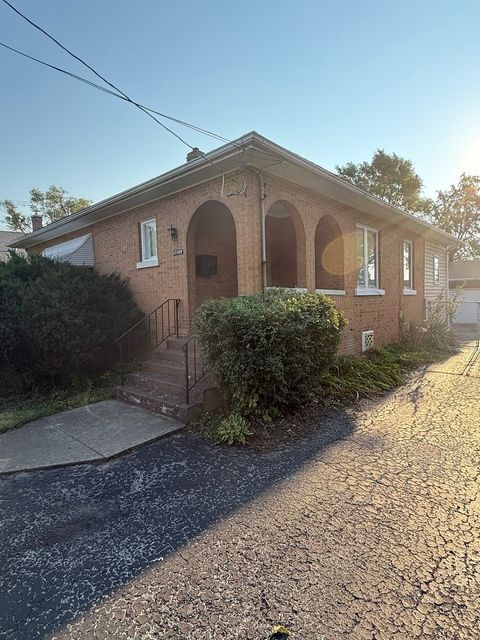
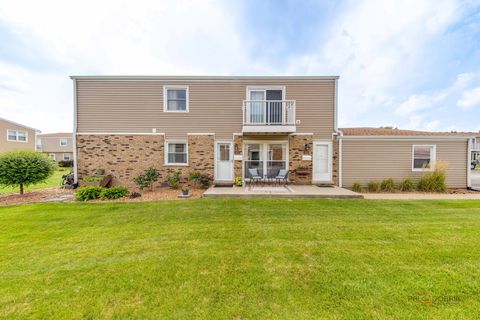
Active
$389,900
3
bds
|
2
ba
|
1,600
sqft
|
built
1989
6931 Coachwood Trl, Tinley Park, IL 60477
$-848
Cash flow
-11.3%
Cash-on-Cash Return
3.1%
Cap rate
0.7%
Rent to Value Ratio
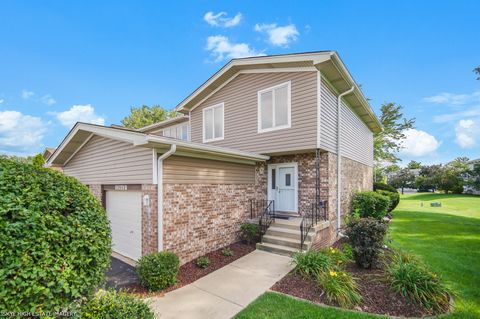
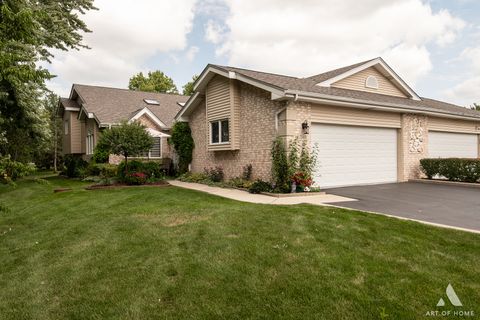
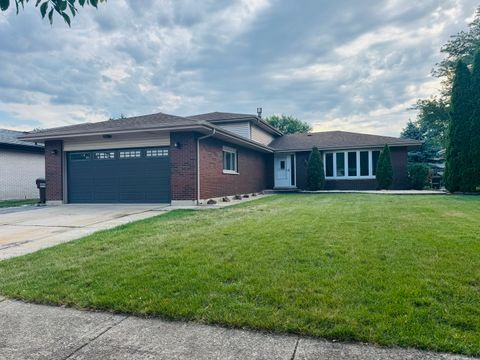
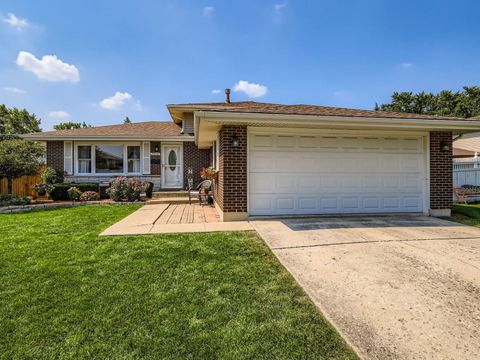
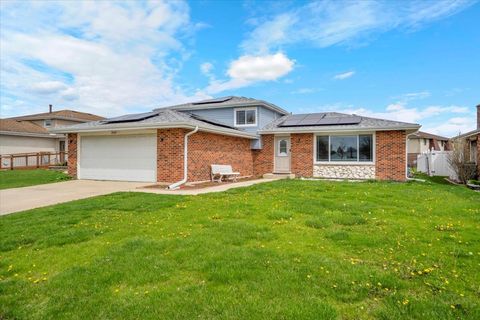
Active
$279,900
3
bds
|
3
ba
|
2,200
sqft
|
built
1989
15962 78th Ave, Tinley Park, IL 60477
$-88
Cash flow
-1.6%
Cash-on-Cash Return
5.3%
Cap rate
1.0%
Rent to Value Ratio
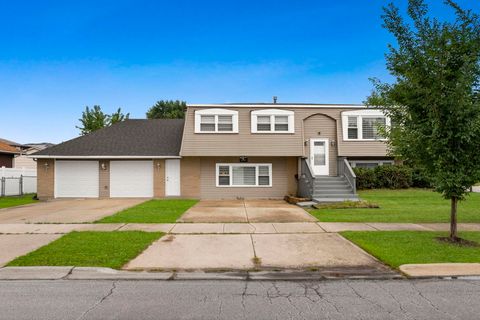
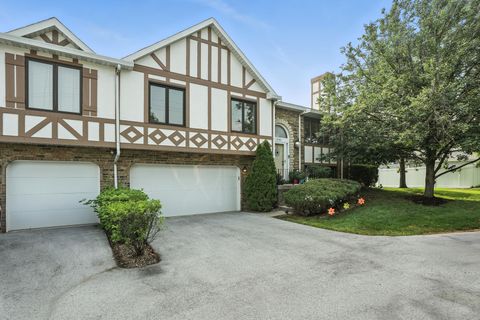
Active
$280,000
2
bds
|
2
ba
|
1,400
sqft
|
built
1992
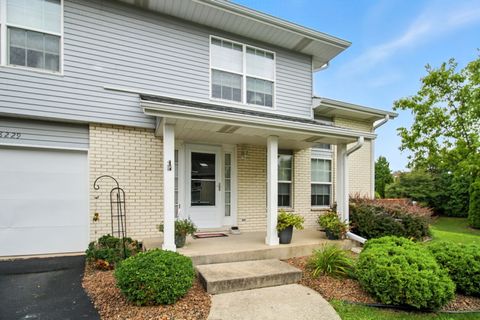
8229 170th St, Tinley Park, IL 60477
$-324
Cash flow
-6.0%
Cash-on-Cash Return
4.3%
Cap rate
0.8%
Rent to Value Ratio
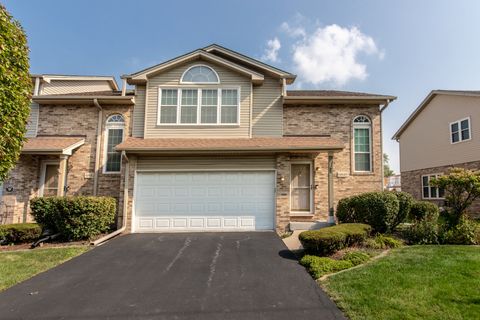
Active
$499,000
3
bds
|
2
ba
|
1,488
sqft
|
built
1936
18145 Harlem Ave, Tinley Park, IL 60477
$-886
Cash flow
-9.3%
Cash-on-Cash Return
3.5%
Cap rate
0.6%
Rent to Value Ratio
Active
$340,000
3
bds
|
2
ba
|
1,308
sqft
|
built
1986
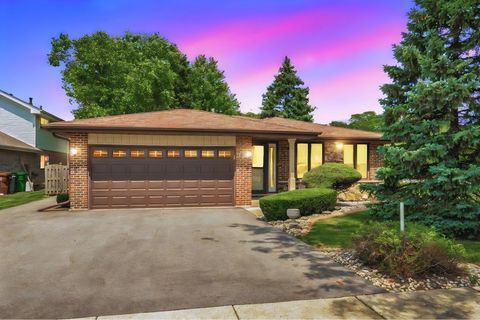
6402 Jeanette Ct, Tinley Park, IL 60477
$-245
Cash flow
-3.8%
Cash-on-Cash Return
4.8%
Cap rate
0.8%
Rent to Value Ratio
Active
$309,000
3
bds
|
2
ba
|
2,100
sqft
|
built
2003
18478 Bellagio Cir, Tinley Park, IL 60477
$-534
Cash flow
-9.0%
Cash-on-Cash Return
3.6%
Cap rate
1.0%
Rent to Value Ratio
Active
$229,900
2
bds
|
2
ba
|
1,100
sqft
|
built
1990
17960 Royal Oak Ct, Tinley Park, IL 60477
$-251
Cash flow
-5.7%
Cash-on-Cash Return
4.4%
Cap rate
0.9%
Rent to Value Ratio
Active
$309,900
2
bds
|
2
ba
|
1,815
sqft
|
built
2006
7716 Greenway Blvd, Tinley Park, IL 60487
$-476
Cash flow
-8.0%
Cash-on-Cash Return
3.8%
Cap rate
0.8%
Rent to Value Ratio
Active
$349,000
3
bds
|
4
ba
|
2,462
sqft
|
built
1993
6954 Kingston Ct, Tinley Park, IL 60477
$-618
Cash flow
-9.2%
Cash-on-Cash Return
3.6%
Cap rate
0.9%
Rent to Value Ratio
Active
$424,999
4
bds
|
2
ba
|
1,436
sqft
|
built
1986
8400 167th St, Tinley Park, IL 60487
$-743
Cash flow
-9.1%
Cash-on-Cash Return
3.6%
Cap rate
0.7%
Rent to Value Ratio
Active
$260,000
2
bds
|
3
ba
|
1,450
sqft
|
built
1994
15960 Ashford Ct, Tinley Park, IL 60477
$-257
Cash flow
-5.2%
Cash-on-Cash Return
4.5%
Cap rate
1.0%
Rent to Value Ratio
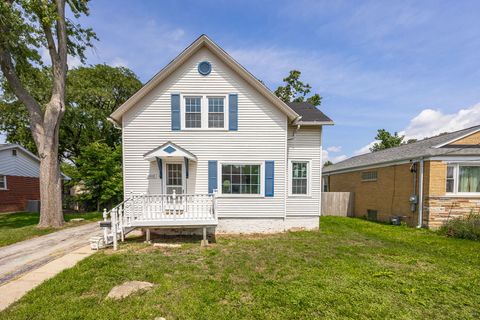
Active
$289,900
4
bds
|
2
ba
|
2,067
sqft
|
built
1919
6448 175th St, Tinley Park, IL 60477
$-349
Cash flow
-6.3%
Cash-on-Cash Return
4.2%
Cap rate
1.0%
Rent to Value Ratio
Active
$344,900
3
bds
|
3
ba
|
1,394
sqft
|
built
1993
7348 163rd St, Tinley Park, IL 60477
$-372
Cash flow
-5.6%
Cash-on-Cash Return
4.4%
Cap rate
0.8%
Rent to Value Ratio
Active
$384,900
3
bds
|
3
ba
|
2,040
sqft
|
built
2009
17908 Iroquois Trce, Tinley Park, IL 60477
$-674
Cash flow
-9.1%
Cash-on-Cash Return
3.6%
Cap rate
0.8%
Rent to Value Ratio
Active
$474,900
3
bds
|
3
ba
|
1,772
sqft
|
built
1978
7218 Sandy Ln, Tinley Park, IL 60477
$-818
Cash flow
-9.0%
Cash-on-Cash Return
3.6%
Cap rate
0.7%
Rent to Value Ratio
Active
$335,000
3
bds
|
2
ba
|
1,350
sqft
|
built
1975
17748 64th Ct, Tinley Park, IL 60477
$-181
Cash flow
-2.8%
Cash-on-Cash Return
5.0%
Cap rate
0.9%
Rent to Value Ratio
Active
$199,999
2
bds
|
2
ba
|
1,000
sqft
|
built
1981
7509 175th St, Tinley Park, IL 60477
$-302
Cash flow
-7.9%
Cash-on-Cash Return
3.9%
Cap rate
0.9%
Rent to Value Ratio
Active
$369,000
3
bds
|
2
ba
|
18,396
sqft
|
built
1974
16447 76th Ave, Tinley Park, IL 60477
$-366
Cash flow
-5.2%
Cash-on-Cash Return
4.5%
Cap rate
0.8%
Rent to Value Ratio
Active
$475,000
5
bds
|
3
ba
|
2,889
sqft
|
built
2003
7959 Brookside Glen Dr, Tinley Park, IL 60487
$-870
Cash flow
-9.6%
Cash-on-Cash Return
3.5%
Cap rate
0.8%
Rent to Value Ratio
Active
$499,000
4
bds
|
4
ba
|
2,763
sqft
|
built
1994
9217 173rd Pl, Tinley Park, IL 60487
$-888
Cash flow
-9.3%
Cash-on-Cash Return
3.5%
Cap rate
0.7%
Rent to Value Ratio
Active
$279,900
2
bds
|
2
ba
|
1,652
sqft
|
built
2001
18568 W Point Dr, Tinley Park, IL 60477
$-395
Cash flow
-7.4%
Cash-on-Cash Return
4.0%
Cap rate
1.0%
Rent to Value Ratio
Active
$349,900
3
bds
|
2
ba
|
1,264
sqft
|
built
1957
17209 70th Ave, Tinley Park, IL 60477
$-454
Cash flow
-6.8%
Cash-on-Cash Return
4.1%
Cap rate
0.7%
Rent to Value Ratio
Active
$284,900
3
bds
|
2
ba
|
1,500
sqft
|
built
1955
6621 183rd St, Tinley Park, IL 60477
$-130
Cash flow
-2.4%
Cash-on-Cash Return
5.1%
Cap rate
1.0%
Rent to Value Ratio
Active
$649,000
4
bds
|
4
ba
|
3,300
sqft
|
built
2002
8304 Queen Victoria Ln, Tinley Park, IL 60477
$-1,264
Cash flow
-10.2%
Cash-on-Cash Return
3.3%
Cap rate
0.6%
Rent to Value Ratio
Active
$225,000
1
bds
|
1
ba
|
990
sqft
|
built
1928
17109 67th Ct, Tinley Park, IL 60477
$-102
Cash flow
-2.4%
Cash-on-Cash Return
5.1%
Cap rate
1.0%
Rent to Value Ratio
Active
$384,900
3
bds
|
2
ba
|
1,095
sqft
|
built
1972
7513 Dorothy Ln, Tinley Park, IL 60477
$-437
Cash flow
-5.9%
Cash-on-Cash Return
4.3%
Cap rate
0.7%
Rent to Value Ratio
Active
$220,000
2
bds
|
1
ba
|
1,000
sqft
|
built
1969
7957 163rd Pl, Tinley Park, IL 60477
$-324
Cash flow
-7.7%
Cash-on-Cash Return
3.9%
Cap rate
0.8%
Rent to Value Ratio
Active
$369,900
3
bds
|
2
ba
|
0
sqft
|
built
1979
8440 163rd St, Tinley Park, IL 60487
$-459
Cash flow
-6.5%
Cash-on-Cash Return
4.2%
Cap rate
0.8%
Rent to Value Ratio
Active
$269,900
2
bds
|
2
ba
|
1,800
sqft
|
built
1987
9395 Windsor Pkwy, Tinley Park, IL 60487
$-324
Cash flow
-6.3%
Cash-on-Cash Return
4.2%
Cap rate
0.9%
Rent to Value Ratio
Active
$325,000
2
bds
|
4
ba
|
1,800
sqft
|
built
1996
6840 179th St, Tinley Park, IL 60477
$-374
Cash flow
-6.0%
Cash-on-Cash Return
4.3%
Cap rate
0.9%
Rent to Value Ratio
Active
$289,000
3
bds
|
3
ba
|
1,557
sqft
|
built
1995
7925 160th St, Tinley Park, IL 60477
$-130
Cash flow
-2.3%
Cash-on-Cash Return
5.1%
Cap rate
1.0%
Rent to Value Ratio
Active
$549,500
4
bds
|
3
ba
|
3,533
sqft
|
built
2000
17116 Dooneen Ave, Tinley Park, IL 60477
$-874
Cash flow
-8.3%
Cash-on-Cash Return
3.8%
Cap rate
0.7%
Rent to Value Ratio
Active
$389,900
2
bds
|
4
ba
|
2,200
sqft
|
built
2003
8447 Dunmore Dr, Tinley Park, IL 60487
$-857
Cash flow
-11.5%
Cash-on-Cash Return
3.0%
Cap rate
0.7%
Rent to Value Ratio
Active
$399,000
5
bds
|
2
ba
|
1,934
sqft
|
built
1971
7505 165th St, Tinley Park, IL 60477
$-75
Cash flow
-1.0%
Cash-on-Cash Return
5.5%
Cap rate
0.9%
Rent to Value Ratio
Active
$299,999
2
bds
|
2
ba
|
1,720
sqft
|
built
2002
7928 Trinity Cir, Tinley Park, IL 60487
$-451
Cash flow
-7.8%
Cash-on-Cash Return
3.9%
Cap rate
0.9%
Rent to Value Ratio
Active
$449,000
3
bds
|
3
ba
|
2,185
sqft
|
built
1995
6815 169th St, Tinley Park, IL 60477
$-862
Cash flow
-10.0%
Cash-on-Cash Return
3.4%
Cap rate
0.6%
Rent to Value Ratio
Active
$545,000
3
bds
|
4
ba
|
3,179
sqft
|
built
1989
16212 Hamilton Ave, Tinley Park, IL 60477
$-905
Cash flow
-8.7%
Cash-on-Cash Return
3.7%
Cap rate
0.6%
Rent to Value Ratio
Active
$339,900
3
bds
|
3
ba
|
1,808
sqft
|
built
1996
7925 Belle Rive Ct, Tinley Park, IL 60477
$-517
Cash flow
-7.9%
Cash-on-Cash Return
3.9%
Cap rate
0.8%
Rent to Value Ratio