Tinley Park, IL Investment Properties for Sale
Browse homes for sale and investment properties in Tinley Park, IL. Refine your search by price, property type, or more.
Best cash flowing properties in Tinley Park, IL
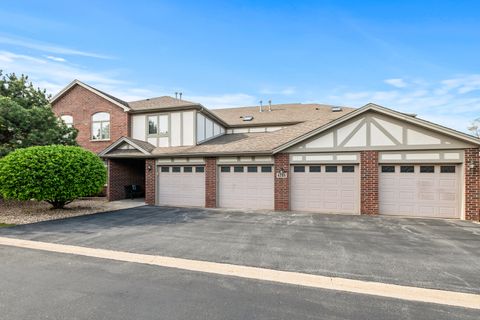
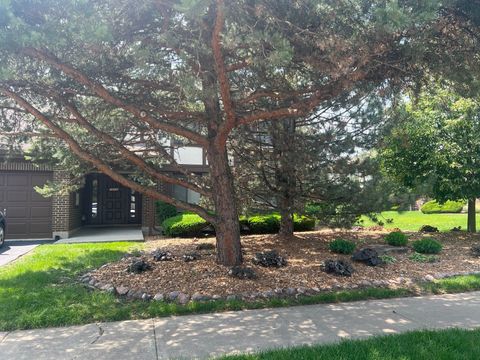
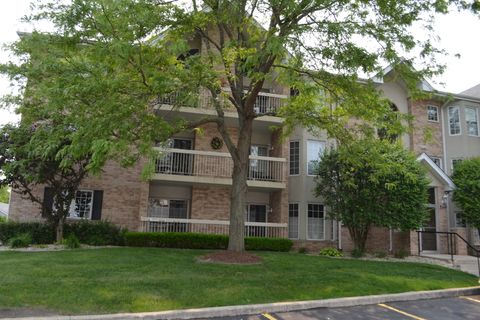
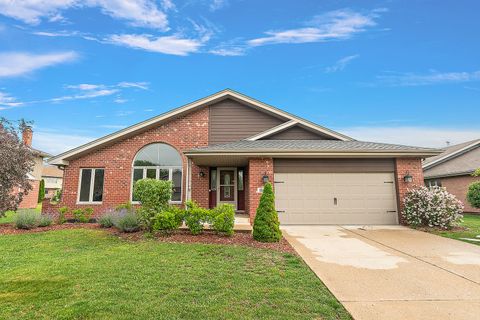
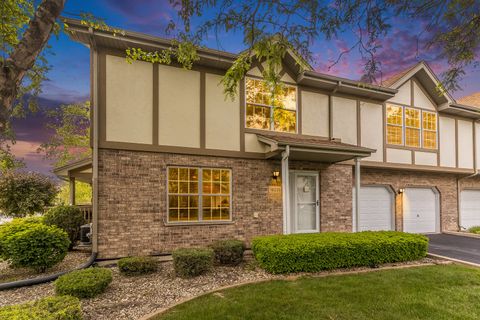
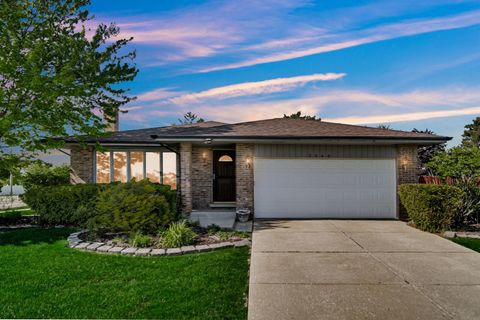
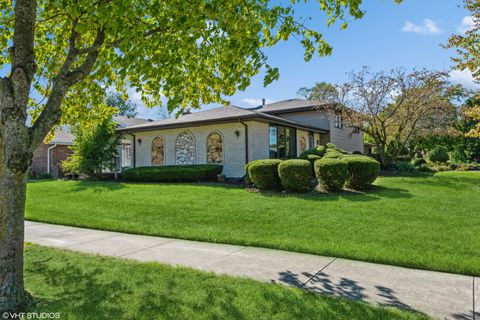
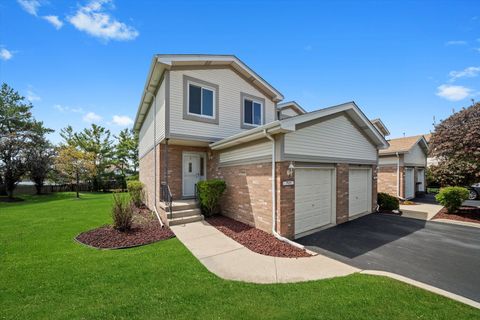
Active
$279,000
1
bds
|
2
ba
|
1,800
sqft
|
built
1937
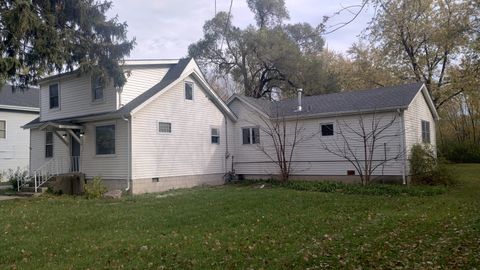
17945 Sayre Ave, Tinley Park, IL 60477
$149
Cash flow
2.8%
Cash-on-Cash Return
6.3%
Cap rate
1.0%
Rent to Value Ratio
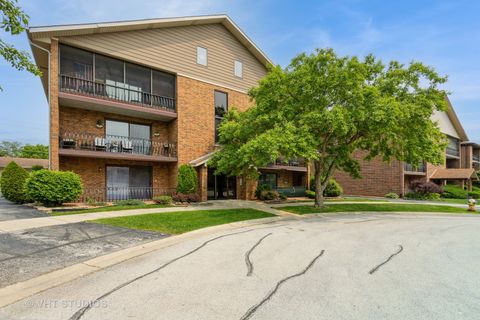
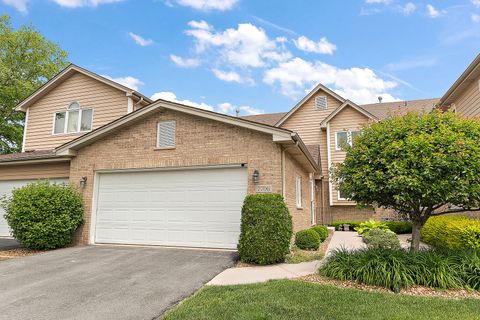
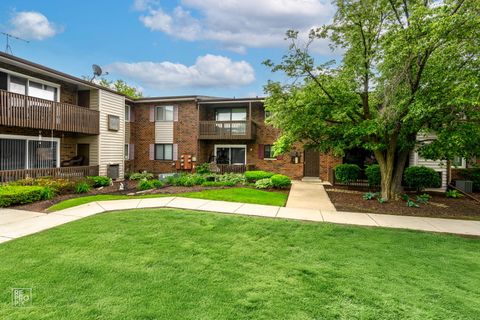
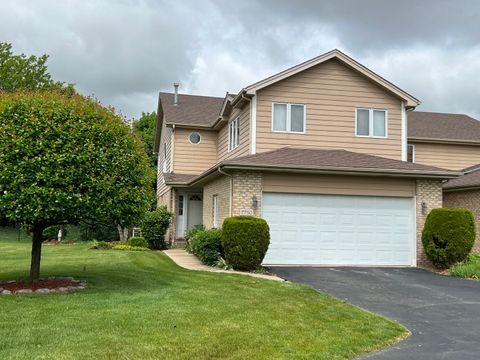
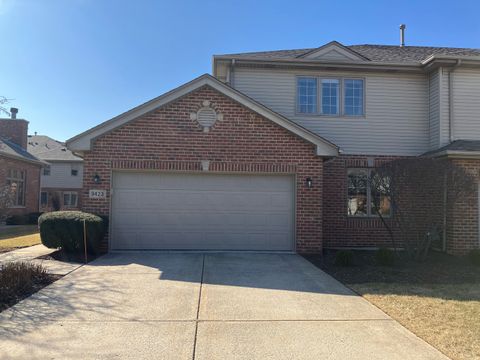
Active
$229,872
2
bds
|
2
ba
|
1,405
sqft
|
built
2007
6256 Kallsen Dr, Tinley Park, IL 60477
$144
Cash flow
3.3%
Cash-on-Cash Return
6.4%
Cap rate
1.0%
Rent to Value Ratio
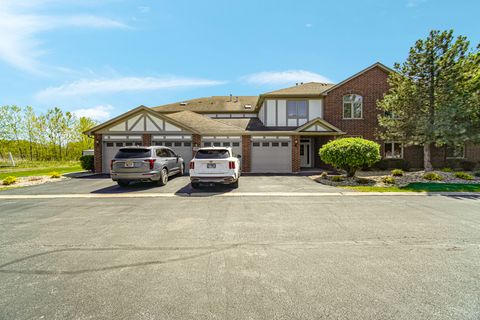
45 out of 77 properties for sale in Tinley Park, IL
Limited Results Shown
Create a free account, or log in to reveal all property listings and enjoy the complete experience.
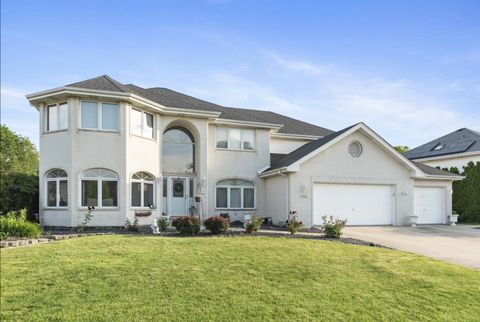
Active
$364,900
3
bds
|
3
ba
|
2,178
sqft
|
built
1997
7852 Bristol Park Dr, Tinley Park, IL 60477
$-485
Cash flow
-6.9%
Cash-on-Cash Return
4.1%
Cap rate
0.8%
Rent to Value Ratio

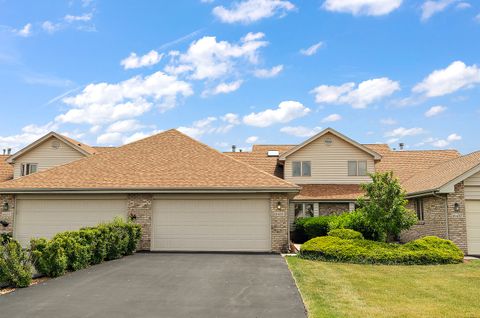
Active
$349,900
4
bds
|
3
ba
|
1,800
sqft
|
built
1963
17227 70th Ave, Tinley Park, IL 60477
$-320
Cash flow
-4.8%
Cash-on-Cash Return
4.6%
Cap rate
0.8%
Rent to Value Ratio

Active
$323,900
3
bds
|
3
ba
|
1,600
sqft
|
built
2001
18283 Kirby Dr, Tinley Park, IL 60487
$-318
Cash flow
-5.1%
Cash-on-Cash Return
4.5%
Cap rate
0.9%
Rent to Value Ratio
Active
$360,000
3
bds
|
2
ba
|
1,095
sqft
|
built
1971
16719 Olcott Ave, Tinley Park, IL 60477
$-251
Cash flow
-3.6%
Cash-on-Cash Return
4.8%
Cap rate
0.8%
Rent to Value Ratio
Active
$239,995
2
bds
|
2
ba
|
1,500
sqft
|
built
2004
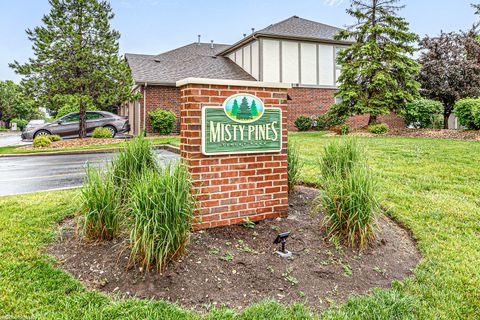
6248 Misty Pines Dr, Tinley Park, IL 60477
$-317
Cash flow
-6.9%
Cash-on-Cash Return
4.1%
Cap rate
0.9%
Rent to Value Ratio
Active
$315,000
3
bds
|
2
ba
|
1,372
sqft
|
built
1968
16401 Clark Ln, Tinley Park, IL 60477
$-170
Cash flow
-2.8%
Cash-on-Cash Return
5.0%
Cap rate
0.9%
Rent to Value Ratio
Active
$274,300
2
bds
|
2
ba
|
1,650
sqft
|
built
2003
6743 S Pointe Dr, Tinley Park, IL 60477
$-480
Cash flow
-9.1%
Cash-on-Cash Return
3.6%
Cap rate
0.9%
Rent to Value Ratio
Active
$569,000
4
bds
|
3
ba
|
3,000
sqft
|
built
1990
17739 Peacock Ln, Tinley Park, IL 60487
$-1,035
Cash flow
-9.5%
Cash-on-Cash Return
3.5%
Cap rate
0.6%
Rent to Value Ratio
Active
$229,872
2
bds
|
2
ba
|
1,405
sqft
|
built
2007
6256 Kallsen Dr, Tinley Park, IL 60477
$144
Cash flow
3.3%
Cash-on-Cash Return
6.4%
Cap rate
1.0%
Rent to Value Ratio
Active
$220,000
3
bds
|
2
ba
|
0
sqft
|
built
1984
18040 Royal Oak Ct, Tinley Park, IL 60477
$-226
Cash flow
-5.4%
Cash-on-Cash Return
4.4%
Cap rate
1.0%
Rent to Value Ratio
Active
$615,000
4
bds
|
4
ba
|
3,787
sqft
|
built
1994
7819 Joliet Dr N, Tinley Park, IL 60477
$-985
Cash flow
-8.4%
Cash-on-Cash Return
3.8%
Cap rate
0.7%
Rent to Value Ratio
Active under contract
$215,000
2
bds
|
2
ba
|
1,100
sqft
|
built
1986
16807 81st Ave, Tinley Park, IL 60477
$-145
Cash flow
-3.5%
Cash-on-Cash Return
4.9%
Cap rate
1.0%
Rent to Value Ratio
Active under contract
$325,000
3
bds
|
3
ba
|
1,797
sqft
|
built
1997
18435 Lakeview Cir W, Tinley Park, IL 60477
$-539
Cash flow
-8.7%
Cash-on-Cash Return
3.7%
Cap rate
0.9%
Rent to Value Ratio
Active
$269,900
2
bds
|
2
ba
|
1,400
sqft
|
built
1997
7771 Bristol Park Dr, Tinley Park, IL 60477
$-306
Cash flow
-5.9%
Cash-on-Cash Return
4.3%
Cap rate
0.9%
Rent to Value Ratio
Active
$374,000
2
bds
|
4
ba
|
2,414
sqft
|
built
1999
7706 Northfield Ln, Tinley Park, IL 60487
$-481
Cash flow
-6.7%
Cash-on-Cash Return
4.1%
Cap rate
0.9%
Rent to Value Ratio
Active
$189,000
2
bds
|
1
ba
|
900
sqft
|
built
1979
7131 166th St, Tinley Park, IL 60477
$-373
Cash flow
-10.3%
Cash-on-Cash Return
3.3%
Cap rate
0.8%
Rent to Value Ratio
Active
$360,000
4
bds
|
2
ba
|
0
sqft
|
built
1974
7707 Bristol Ln, Tinley Park, IL 60477
$-535
Cash flow
-7.8%
Cash-on-Cash Return
3.9%
Cap rate
0.7%
Rent to Value Ratio
Active
$499,000
3
bds
|
3
ba
|
2,736
sqft
|
built
2006
8542 Monaghan Dr, Tinley Park, IL 60487
$-919
Cash flow
-9.6%
Cash-on-Cash Return
3.5%
Cap rate
0.8%
Rent to Value Ratio
Active
$193,000
2
bds
|
2
ba
|
1,100
sqft
|
built
1972
6724 181st St, Tinley Park, IL 60477
$-177
Cash flow
-4.8%
Cash-on-Cash Return
4.6%
Cap rate
1.0%
Rent to Value Ratio
Active
$414,900
3
bds
|
4
ba
|
2,186
sqft
|
built
2001
17964 Upland Dr, Tinley Park, IL 60487
$-669
Cash flow
-8.4%
Cash-on-Cash Return
3.7%
Cap rate
0.8%
Rent to Value Ratio
Active
$359,000
3
bds
|
2
ba
|
0
sqft
|
built
1969
16409 64th Ct, Tinley Park, IL 60477
$-404
Cash flow
-5.9%
Cash-on-Cash Return
4.3%
Cap rate
0.8%
Rent to Value Ratio
Active
$319,900
2
bds
|
3
ba
|
1,960
sqft
|
built
1998
18225 Eagle Dr, Tinley Park, IL 60477
$-519
Cash flow
-8.5%
Cash-on-Cash Return
3.7%
Cap rate
0.9%
Rent to Value Ratio
Active
$334,000
2
bds
|
3
ba
|
2,104
sqft
|
built
2000
7750 Northfield Ln, Tinley Park, IL 60487
$-543
Cash flow
-8.5%
Cash-on-Cash Return
3.7%
Cap rate
0.8%
Rent to Value Ratio
Active
$339,900
3
bds
|
4
ba
|
1,695
sqft
|
built
1998
9051 Mansfield Dr, Tinley Park, IL 60487
$-300
Cash flow
-4.6%
Cash-on-Cash Return
4.6%
Cap rate
0.8%
Rent to Value Ratio
Active
$430,000
4
bds
|
3
ba
|
1,460
sqft
|
built
1994
6807 180th Ct, Tinley Park, IL 60477
$-213
Cash flow
-2.6%
Cash-on-Cash Return
5.1%
Cap rate
0.7%
Rent to Value Ratio
Active
$444,900
4
bds
|
3
ba
|
2,500
sqft
|
built
1993
7942 161st St, Tinley Park, IL 60477
$-607
Cash flow
-7.1%
Cash-on-Cash Return
4.0%
Cap rate
0.7%
Rent to Value Ratio
Active
$279,000
1
bds
|
2
ba
|
1,800
sqft
|
built
1937
17945 Sayre Ave, Tinley Park, IL 60477
$149
Cash flow
2.8%
Cash-on-Cash Return
6.3%
Cap rate
1.0%
Rent to Value Ratio
Active
$420,000
3
bds
|
3
ba
|
2,100
sqft
|
built
1999
9423 Caledonia Dr, Tinley Park, IL 60487
$-679
Cash flow
-8.4%
Cash-on-Cash Return
3.7%
Cap rate
0.8%
Rent to Value Ratio
Active
$232,000
2
bds
|
2
ba
|
1,500
sqft
|
built
2003
6257 Kallsen Dr, Tinley Park, IL 60477
$-278
Cash flow
-6.3%
Cash-on-Cash Return
4.2%
Cap rate
1.1%
Rent to Value Ratio
Active
$410,000
4
bds
|
3
ba
|
2,056
sqft
|
built
1987
8120 Cherokee Trl, Tinley Park, IL 60477
$-431
Cash flow
-5.5%
Cash-on-Cash Return
4.4%
Cap rate
0.8%
Rent to Value Ratio
Active
$449,000
3
bds
|
2
ba
|
2,400
sqft
|
built
1985
17000 Cherry Creek Ave, Tinley Park, IL 60487
$-635
Cash flow
-7.4%
Cash-on-Cash Return
4.0%
Cap rate
0.7%
Rent to Value Ratio
Active
$287,000
2
bds
|
3
ba
|
1,800
sqft
|
built
2002
18524 Dearborn Ct, Tinley Park, IL 60477
$-566
Cash flow
-10.3%
Cash-on-Cash Return
3.3%
Cap rate
0.9%
Rent to Value Ratio
Active
$399,900
3
bds
|
3
ba
|
1,886
sqft
|
built
1998
17800 Ridgeland Ave, Tinley Park, IL 60477
$-509
Cash flow
-6.6%
Cash-on-Cash Return
4.2%
Cap rate
0.8%
Rent to Value Ratio
Active
$379,900
3
bds
|
2
ba
|
0
sqft
|
built
1979
8440 163rd St, Tinley Park, IL 60487
$-507
Cash flow
-7.0%
Cash-on-Cash Return
4.1%
Cap rate
0.7%
Rent to Value Ratio
Active under contract
$299,700
3
bds
|
3
ba
|
1,600
sqft
|
built
1995
7939 160th St, Tinley Park, IL 60477
$-180
Cash flow
-3.1%
Cash-on-Cash Return
5.0%
Cap rate
0.9%
Rent to Value Ratio

Active
$355,000
3
bds
|
4
ba
|
2,234
sqft
|
built
2005
9004 Newcastle Ct, Tinley Park, IL 60487
$-447
Cash flow
-6.6%
Cash-on-Cash Return
4.2%
Cap rate
0.9%
Rent to Value Ratio
Active
$119,900
1
bds
|
1
ba
|
0
sqft
|
built
1973
17138 71st Ave, Tinley Park, IL 60477
$-251
Cash flow
-10.9%
Cash-on-Cash Return
3.2%
Cap rate
1.1%
Rent to Value Ratio

Active
$360,000
3
bds
|
2
ba
|
1,511
sqft
|
built
1950
16835 New England Ave, Tinley Park, IL 60477
$-519
Cash flow
-7.5%
Cash-on-Cash Return
4.0%
Cap rate
0.7%
Rent to Value Ratio
Active
$265,000
2
bds
|
2
ba
|
1,400
sqft
|
built
1999
7751 Bristol Park Dr, Tinley Park, IL 60477
$-311
Cash flow
-6.1%
Cash-on-Cash Return
4.3%
Cap rate
0.9%
Rent to Value Ratio
Active
$195,000
2
bds
|
2
ba
|
1,100
sqft
|
built
1972
18053 Live Oak Ct, Tinley Park, IL 60477
$14
Cash flow
0.4%
Cash-on-Cash Return
5.8%
Cap rate
1.0%
Rent to Value Ratio