Tinley Park, IL Investment Properties for Sale
Browse homes for sale and investment properties in Tinley Park, IL. Refine your search by price, property type, or more.
Best cash flowing properties in Tinley Park, IL
Active
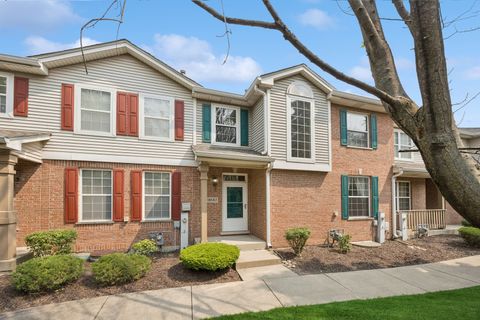
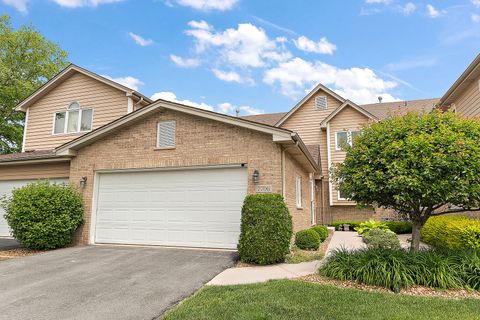
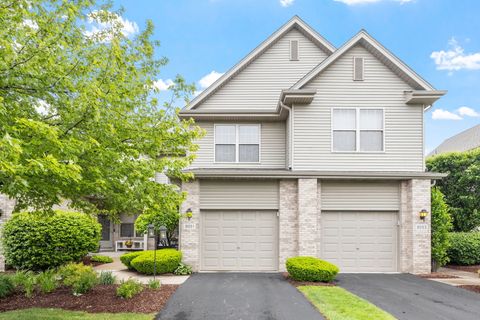
$299,700
3
bds
|
3
ba
|
1,600
sqft
|
built
1995
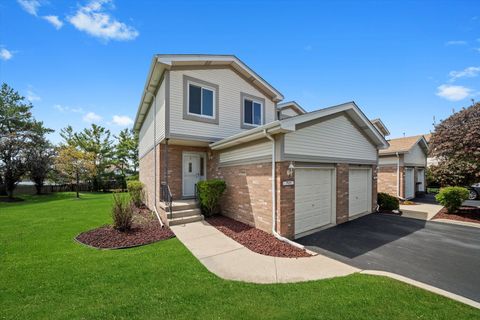
7939 160th St, Tinley Park, IL 60477
$-180
Cash flow
-3.1%
Cash-on-Cash Return
5.0%
Cap rate
0.9%
Rent to Value Ratio
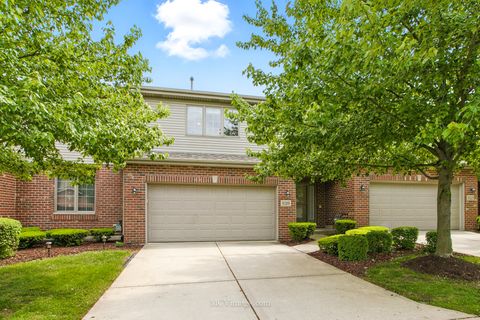
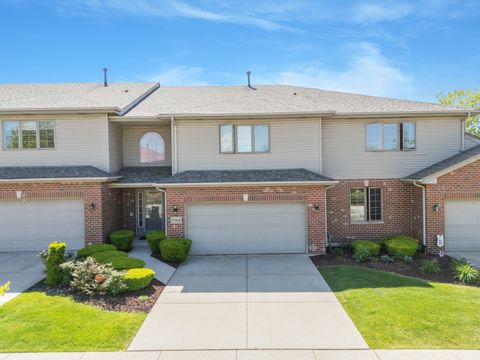
Active under contract
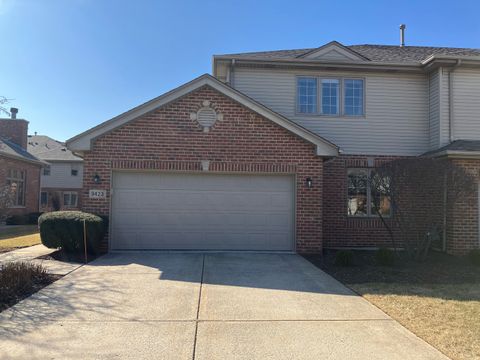
$289,900
2
bds
|
4
ba
|
1,533
sqft
|
built
1994
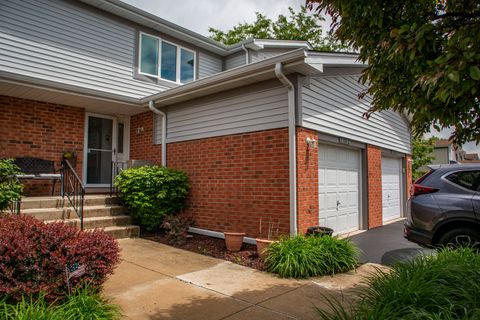
7902 160th St, Tinley Park, IL 60477
$-215
Cash flow
-3.9%
Cash-on-Cash Return
4.8%
Cap rate
1.0%
Rent to Value Ratio
16 out of 20 properties for sale in Tinley Park, IL
Limited Results Shown
Create a free account, or log in to reveal all property listings and enjoy the complete experience.
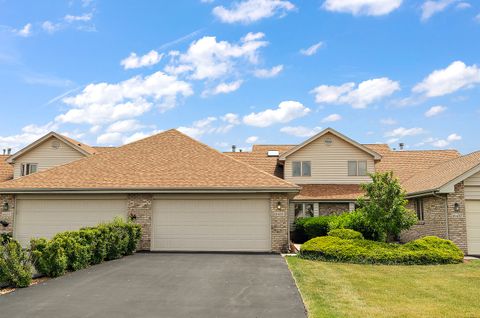
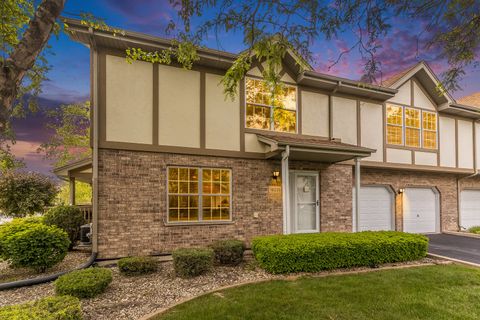
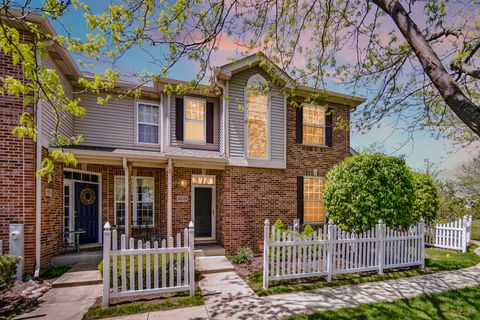
Active under contract
$300,000
2
bds
|
2
ba
|
1,452
sqft
|
built
1991
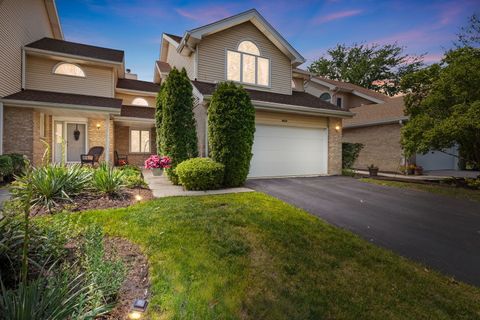
9425 Quail Xing, Tinley Park, IL 60487
$-239
Cash flow
-4.2%
Cash-on-Cash Return
4.7%
Cap rate
0.9%
Rent to Value Ratio
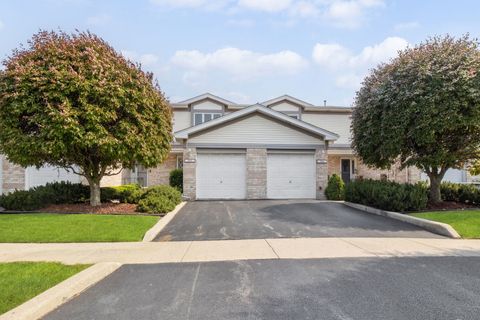
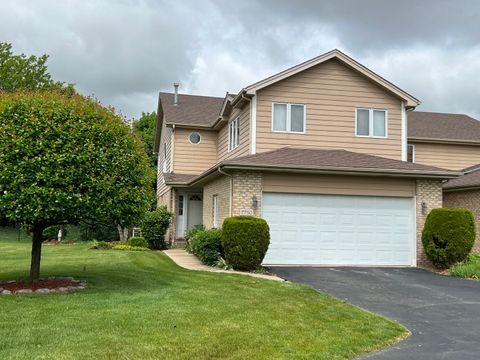
Active under contract
$284,898
2
bds
|
4
ba
|
1,722
sqft
|
built
2001
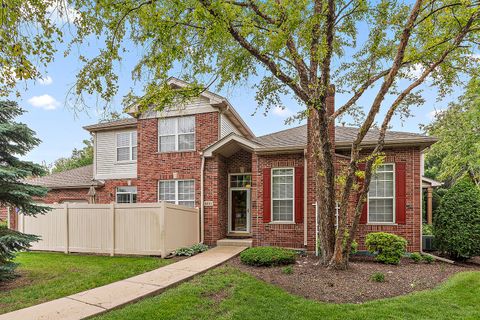
6603 Pine Lake Dr, Tinley Park, IL 60477
$-487
Cash flow
-8.9%
Cash-on-Cash Return
3.6%
Cap rate
1.0%
Rent to Value Ratio
Active under contract
$279,000
3
bds
|
2
ba
|
1,396
sqft
|
built
1998
18582 W Point Dr, Tinley Park, IL 60477
$-528
Cash flow
-9.9%
Cash-on-Cash Return
3.4%
Cap rate
0.9%
Rent to Value Ratio
Active under contract
$379,900
2
bds
|
3
ba
|
2,186
sqft
|
built
2002
9319 Lochwood Pl, Tinley Park, IL 60487
$-573
Cash flow
-7.9%
Cash-on-Cash Return
3.9%
Cap rate
0.8%
Rent to Value Ratio
Active
$325,000
3
bds
|
3
ba
|
1,797
sqft
|
built
1997
18435 Lakeview Cir W, Tinley Park, IL 60477
$-539
Cash flow
-8.7%
Cash-on-Cash Return
3.7%
Cap rate
0.9%
Rent to Value Ratio
Active under contract
$289,900
2
bds
|
3
ba
|
1,449
sqft
|
built
1995
7953 160th St, Tinley Park, IL 60477
$-341
Cash flow
-6.1%
Cash-on-Cash Return
4.3%
Cap rate
0.9%
Rent to Value Ratio
Active
$374,000
2
bds
|
4
ba
|
2,414
sqft
|
built
1999
7706 Northfield Ln, Tinley Park, IL 60487
$-481
Cash flow
-6.7%
Cash-on-Cash Return
4.1%
Cap rate
0.9%
Rent to Value Ratio
Active under contract
$289,900
2
bds
|
4
ba
|
1,533
sqft
|
built
1994
7902 160th St, Tinley Park, IL 60477
$-215
Cash flow
-3.9%
Cash-on-Cash Return
4.8%
Cap rate
1.0%
Rent to Value Ratio
Active
$419,900
3
bds
|
4
ba
|
2,186
sqft
|
built
2001
17964 Upland Dr, Tinley Park, IL 60487
$-693
Cash flow
-8.6%
Cash-on-Cash Return
3.7%
Cap rate
0.8%
Rent to Value Ratio
Active
$319,900
2
bds
|
3
ba
|
1,960
sqft
|
built
1998
18225 Eagle Dr, Tinley Park, IL 60477
$-519
Cash flow
-8.5%
Cash-on-Cash Return
3.7%
Cap rate
0.9%
Rent to Value Ratio
Active
$334,000
2
bds
|
3
ba
|
2,104
sqft
|
built
2000
7750 Northfield Ln, Tinley Park, IL 60487
$-543
Cash flow
-8.5%
Cash-on-Cash Return
3.7%
Cap rate
0.8%
Rent to Value Ratio
Active
$339,900
3
bds
|
4
ba
|
1,695
sqft
|
built
1998
9051 Mansfield Dr, Tinley Park, IL 60487
$-300
Cash flow
-4.6%
Cash-on-Cash Return
4.6%
Cap rate
0.8%
Rent to Value Ratio
Active
$420,000
3
bds
|
3
ba
|
2,100
sqft
|
built
1999
9423 Caledonia Dr, Tinley Park, IL 60487
$-679
Cash flow
-8.4%
Cash-on-Cash Return
3.7%
Cap rate
0.8%
Rent to Value Ratio
Active
$287,000
2
bds
|
3
ba
|
1,800
sqft
|
built
2002
18524 Dearborn Ct, Tinley Park, IL 60477
$-566
Cash flow
-10.3%
Cash-on-Cash Return
3.3%
Cap rate
0.9%
Rent to Value Ratio
Active
$299,700
3
bds
|
3
ba
|
1,600
sqft
|
built
1995
7939 160th St, Tinley Park, IL 60477
$-180
Cash flow
-3.1%
Cash-on-Cash Return
5.0%
Cap rate
0.9%
Rent to Value Ratio

Active
$355,000
3
bds
|
4
ba
|
2,234
sqft
|
built
2005
9004 Newcastle Ct, Tinley Park, IL 60487
$-447
Cash flow
-6.6%
Cash-on-Cash Return
4.2%
Cap rate
0.9%
Rent to Value Ratio