Tremonton, UT Investment Properties for Sale
Browse homes for sale and investment properties in Tremonton, UT. Refine your search by price, property type, or more.
Best cash flowing properties in Tremonton, UT
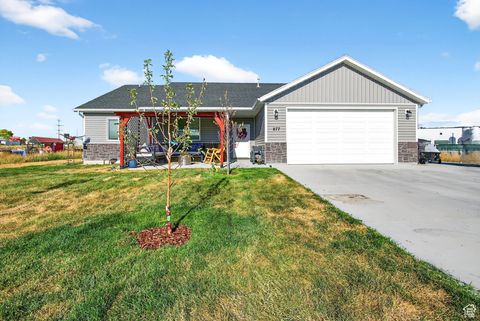
Active
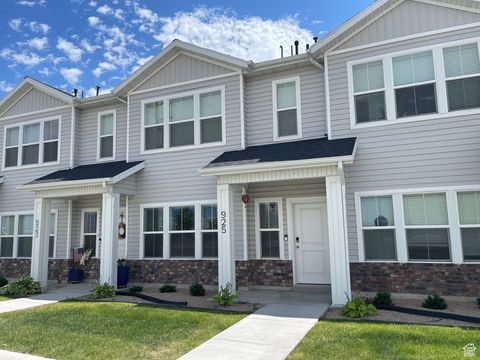
$290,000
3
bds
|
3
ba
|
1,476
sqft
|
built
2021
925 W 1000 N, Tremonton, UT 84337
$-253
Cash flow
-4.6%
Cash-on-Cash Return
4.6%
Cap rate
0.7%
Rent to Value Ratio
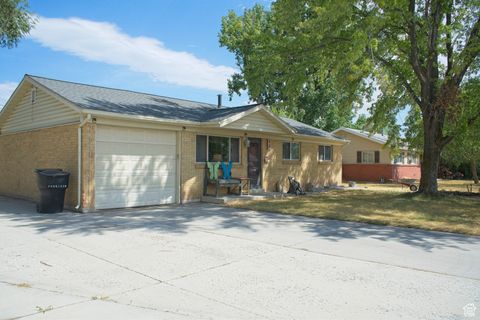
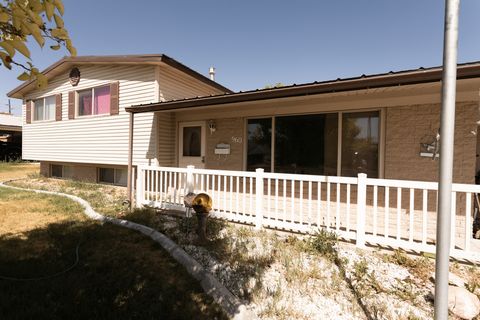
Active
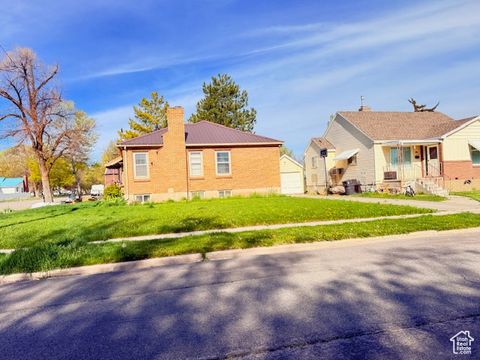
$344,900
3
bds
|
3
ba
|
2,694
sqft
|
built
1942
155 E 300 N, Tremonton, UT 84337
$-375
Cash flow
-5.7%
Cash-on-Cash Return
4.4%
Cap rate
0.6%
Rent to Value Ratio
31 out of 37 properties for sale in Tremonton, UT
Limited Results Shown
Create a free account, or log in to reveal all property listings and enjoy the complete experience.
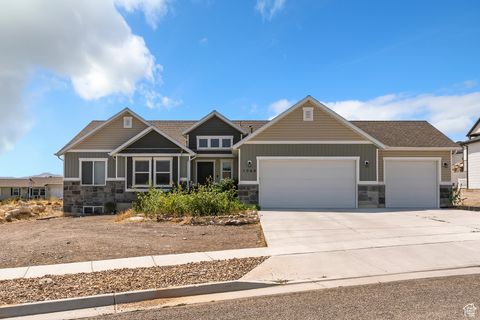
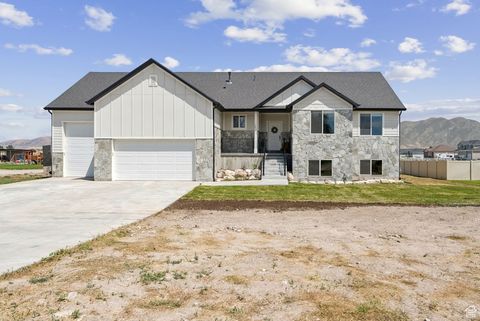
Active
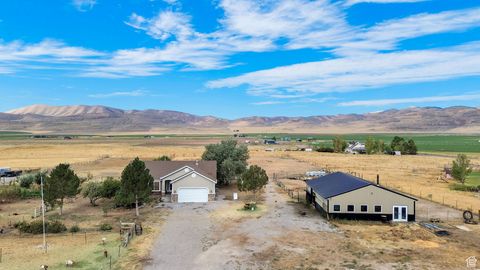
$794,000
4
bds
|
3
ba
|
2,988
sqft
|
built
2000
13585 N 10000 W, Tremonton, UT 84337
$-2,635
Cash flow
-17.3%
Cash-on-Cash Return
1.7%
Cap rate
0.3%
Rent to Value Ratio
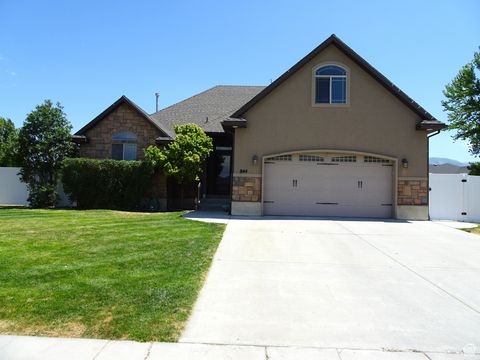
Active
$265,000
3
bds
|
2
ba
|
1,340
sqft
|
built
2018
320 W 600 S, Tremonton, UT 84337
$-566
Cash flow
-11.1%
Cash-on-Cash Return
3.1%
Cap rate
0.6%
Rent to Value Ratio
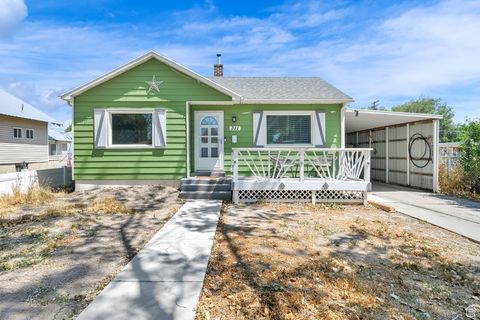
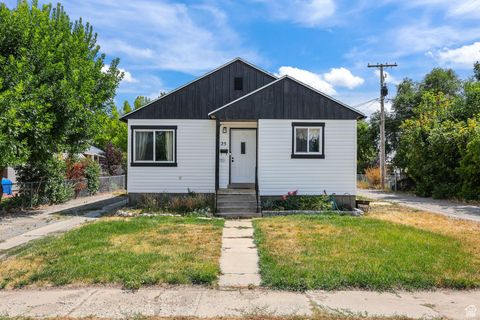
Active
$314,900
3
bds
|
1
ba
|
990
sqft
|
built
1961
795 S 150 W, Tremonton, UT 84337
$-654
Cash flow
-10.8%
Cash-on-Cash Return
3.2%
Cap rate
0.4%
Rent to Value Ratio
Active
$450,000
4
bds
|
1
ba
|
1,859
sqft
|
built
1953
311 S 100 W, Tremonton, UT 84337
$-834
Cash flow
-9.7%
Cash-on-Cash Return
3.5%
Cap rate
0.5%
Rent to Value Ratio
Active
$629,000
5
bds
|
4
ba
|
4,027
sqft
|
built
2021
1069 N 2800 W, Tremonton, UT 84337
$-901
Cash flow
-7.5%
Cash-on-Cash Return
4.0%
Cap rate
0.6%
Rent to Value Ratio
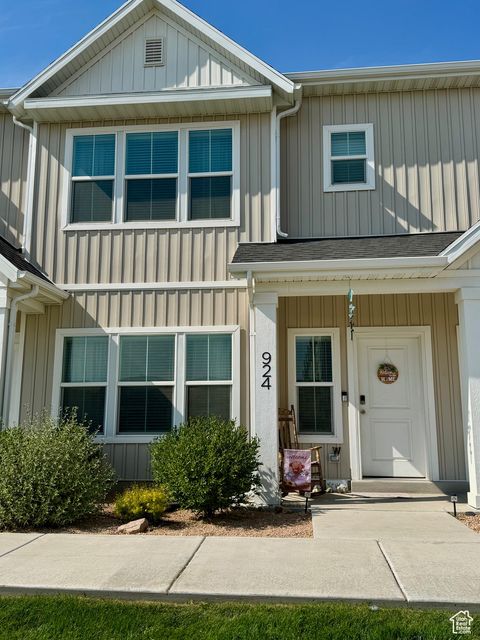
Active
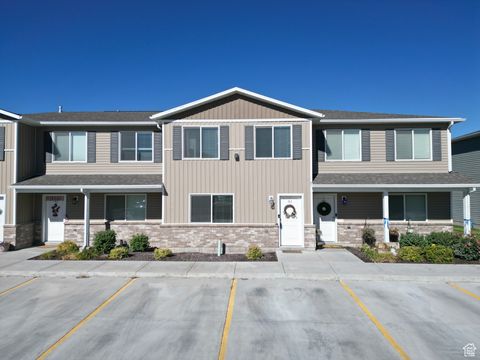
$300,000
3
bds
|
3
ba
|
1,513
sqft
|
built
2021
924 W 960 N, Tremonton, UT 84337
$-434
Cash flow
-7.5%
Cash-on-Cash Return
3.9%
Cap rate
0.6%
Rent to Value Ratio
Active
$450,000
3
bds
|
2
ba
|
1,555
sqft
|
built
2022
877 N 2300 W, Tremonton, UT 84337
$-1,085
Cash flow
-12.6%
Cash-on-Cash Return
2.8%
Cap rate
0.4%
Rent to Value Ratio
Active
$729,000
3
bds
|
2
ba
|
3,344
sqft
|
built
2023
10160 N 6800 W, Tremonton, UT 84337
$-1,684
Cash flow
-12.1%
Cash-on-Cash Return
2.9%
Cap rate
0.4%
Rent to Value Ratio
Active
$586,900
6
bds
|
3
ba
|
3,523
sqft
|
built
2007
844 N 400 E, Tremonton, UT 84337
$-1,188
Cash flow
-10.6%
Cash-on-Cash Return
3.2%
Cap rate
0.5%
Rent to Value Ratio
Active
$335,000
4
bds
|
1
ba
|
1,646
sqft
|
built
1946
25 W 400 S, Tremonton, UT 84337
$-551
Cash flow
-8.6%
Cash-on-Cash Return
3.7%
Cap rate
0.5%
Rent to Value Ratio
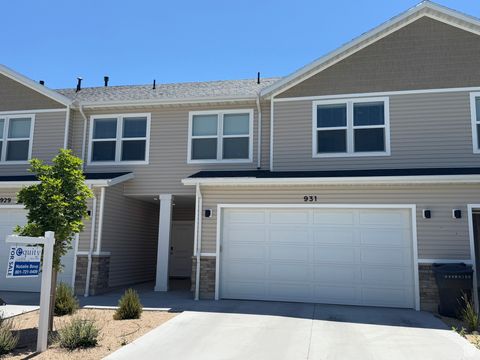
Active
$315,000
3
bds
|
3
ba
|
1,550
sqft
|
built
2022
931 W 910 N, Tremonton, UT 84337
$-646
Cash flow
-10.7%
Cash-on-Cash Return
3.2%
Cap rate
0.5%
Rent to Value Ratio
Active
$385,000
4
bds
|
2
ba
|
2,400
sqft
|
built
1996
556 W 860 S, Tremonton, UT 84337
$-1,026
Cash flow
-13.9%
Cash-on-Cash Return
2.5%
Cap rate
0.4%
Rent to Value Ratio
Active
$569,900
6
bds
|
3
ba
|
3,344
sqft
|
built
2008
758 N 400 E, Tremonton, UT 84337
$-1,851
Cash flow
-16.9%
Cash-on-Cash Return
1.8%
Cap rate
0.3%
Rent to Value Ratio
Active
$525,000
3
bds
|
3
ba
|
1,960
sqft
|
built
2020
910 W 800 N, Tremonton, UT 84337
$-1,156
Cash flow
-11.5%
Cash-on-Cash Return
3.0%
Cap rate
0.4%
Rent to Value Ratio
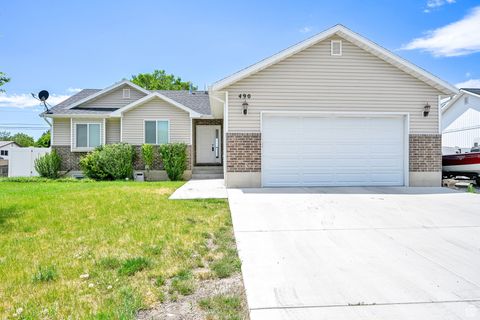
Active
$480,000
5
bds
|
3
ba
|
2,700
sqft
|
built
2018
490 S 500 W, Tremonton, UT 84337
$-1,234
Cash flow
-13.4%
Cash-on-Cash Return
2.6%
Cap rate
0.4%
Rent to Value Ratio
Active
$414,900
3
bds
|
2
ba
|
1,527
sqft
|
built
2005
1635 W 125 N, Tremonton, UT 84337
$-1,026
Cash flow
-12.9%
Cash-on-Cash Return
2.7%
Cap rate
0.4%
Rent to Value Ratio
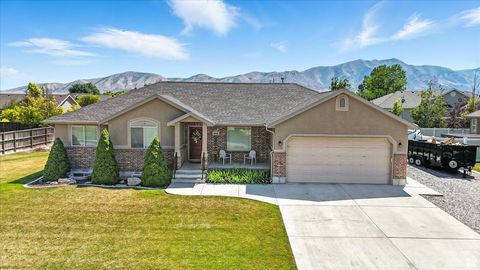
Active
$669,000
5
bds
|
3
ba
|
3,948
sqft
|
built
2006
2618 W Mountain Rd, Tremonton, UT 84337
$-1,765
Cash flow
-13.8%
Cash-on-Cash Return
2.5%
Cap rate
0.4%
Rent to Value Ratio
Active
$425,000
3
bds
|
3
ba
|
1,547
sqft
|
built
2021
892 N 900 W, Tremonton, UT 84337
$-830
Cash flow
-10.2%
Cash-on-Cash Return
3.3%
Cap rate
0.5%
Rent to Value Ratio
Active
$333,300
3
bds
|
2
ba
|
2,191
sqft
|
built
1960
960 N 100 W, Tremonton, UT 84337
$-576
Cash flow
-9.0%
Cash-on-Cash Return
3.6%
Cap rate
0.5%
Rent to Value Ratio
Active
$650,000
4
bds
|
3
ba
|
3,036
sqft
|
built
1942
102 S 1000 W, Tremonton, UT 84337
$-1,662
Cash flow
-13.3%
Cash-on-Cash Return
2.6%
Cap rate
0.4%
Rent to Value Ratio
Active
$495,000
5
bds
|
2
ba
|
3,452
sqft
|
built
1921
10205 W 10400 N, Tremonton, UT 84337
$-583
Cash flow
-6.1%
Cash-on-Cash Return
4.3%
Cap rate
0.6%
Rent to Value Ratio
Active
$425,000
3
bds
|
2
ba
|
2,380
sqft
|
built
1940
144 S 100 W, Tremonton, UT 84337
$-1,124
Cash flow
-13.8%
Cash-on-Cash Return
2.5%
Cap rate
0.4%
Rent to Value Ratio
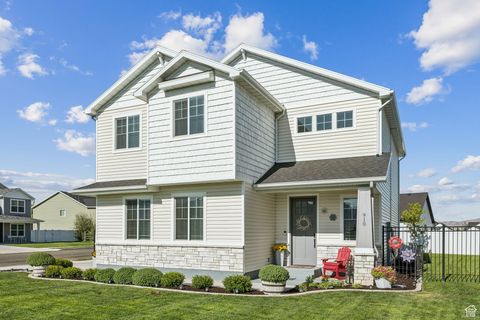
Active
$290,000
3
bds
|
3
ba
|
1,654
sqft
|
built
2007
855 W 350 N, Tremonton, UT 84337
$-505
Cash flow
-9.1%
Cash-on-Cash Return
3.6%
Cap rate
0.6%
Rent to Value Ratio
Active
$495,000
4
bds
|
4
ba
|
3,590
sqft
|
built
1975
720 N 300 E, Tremonton, UT 84337
$-893
Cash flow
-9.4%
Cash-on-Cash Return
3.5%
Cap rate
0.5%
Rent to Value Ratio
Active
$530,000
7
bds
|
3
ba
|
3,146
sqft
|
built
2006
680 N 980 W, Tremonton, UT 84337
$-1,571
Cash flow
-15.5%
Cash-on-Cash Return
2.1%
Cap rate
0.3%
Rent to Value Ratio
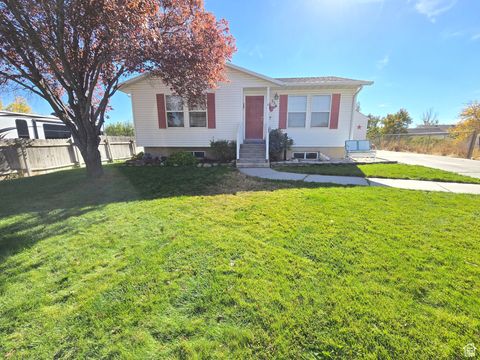
Active
$379,900
3
bds
|
2
ba
|
1,900
sqft
|
built
1959
789 N 100 W, Tremonton, UT 84337
$-888
Cash flow
-12.2%
Cash-on-Cash Return
2.9%
Cap rate
0.4%
Rent to Value Ratio
Active
$450,000
6
bds
|
3
ba
|
2,558
sqft
|
built
2006
162 S 500 W, Tremonton, UT 84337
$-612
Cash flow
-7.1%
Cash-on-Cash Return
4.0%
Cap rate
0.6%
Rent to Value Ratio
Active
$655,000
6
bds
|
4
ba
|
3,834
sqft
|
built
2005
955 W 720 N, Tremonton, UT 84337
$-1,616
Cash flow
-12.9%
Cash-on-Cash Return
2.7%
Cap rate
0.4%
Rent to Value Ratio
Active
$949,000
3
bds
|
2
ba
|
2,262
sqft
|
built
2014
12695 N 10800 W, Tremonton, UT 84337
$-2,750
Cash flow
-15.1%
Cash-on-Cash Return
2.2%
Cap rate
0.3%
Rent to Value Ratio