Tremonton, UT Investment Properties for Sale
Browse homes for sale and investment properties in Tremonton, UT. Refine your search by price, property type, or more.
Best cash flowing properties in Tremonton, UT

Active
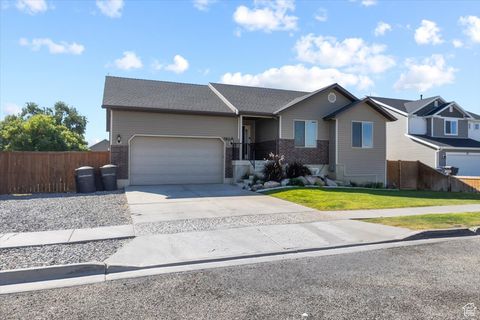
$304,900
3
bds
|
3
ba
|
1,430
sqft
|
built
2022
953 N 900 W, Tremonton, UT 84337
$-602
Cash flow
-10.3%
Cash-on-Cash Return
3.3%
Cap rate
0.5%
Rent to Value Ratio
Active
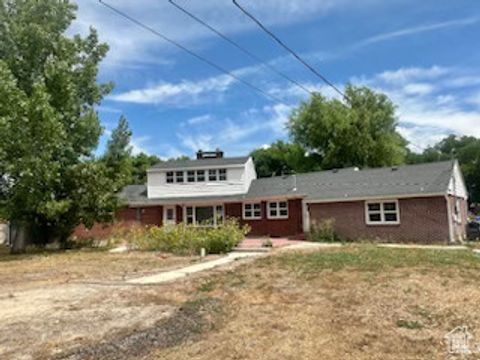
$534,900
4
bds
|
4
ba
|
4,084
sqft
|
built
1949
575 N 300 E, Tremonton, UT 84337
$-868
Cash flow
-8.5%
Cash-on-Cash Return
3.7%
Cap rate
0.6%
Rent to Value Ratio
45 out of 53 properties for sale in Tremonton, UT
Limited Results Shown
Create a free account, or log in to reveal all property listings and enjoy the complete experience.
Active
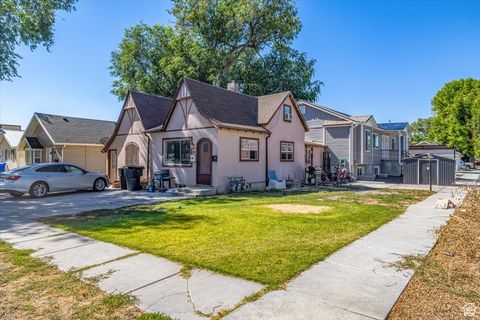
$785,000
10
bds
|
7
ba
|
5,058
sqft
|
built
1918
67 N 200 E, Tremonton, UT 84337
$-2,242
Cash flow
-14.9%
Cash-on-Cash Return
2.3%
Cap rate
0.3%
Rent to Value Ratio
Active
$500,000
5
bds
|
3
ba
|
2,581
sqft
|
built
2007
783 W 900 S, Tremonton, UT 84337
$-1,184
Cash flow
-12.4%
Cash-on-Cash Return
2.8%
Cap rate
0.4%
Rent to Value Ratio
Active
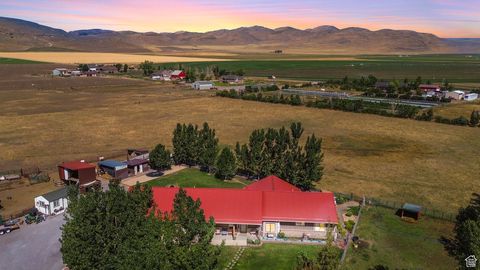
$949,000
3
bds
|
2
ba
|
2,262
sqft
|
built
2014
12695 N 10800 W, Tremonton, UT 84337
$-2,750
Cash flow
-15.1%
Cash-on-Cash Return
2.2%
Cap rate
0.3%
Rent to Value Ratio