Bexar County Investment Properties for Sale
Browse homes for sale and investment properties in Bexar County. Refine your search by price, property type, or more.
Best cash flowing properties in Bexar County
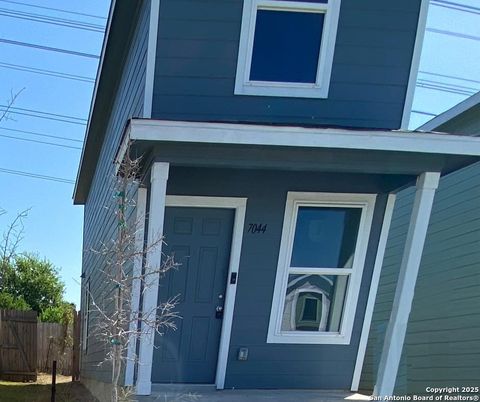
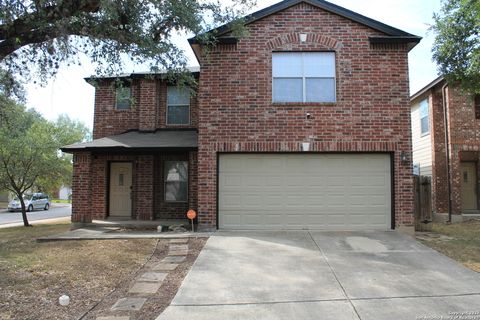
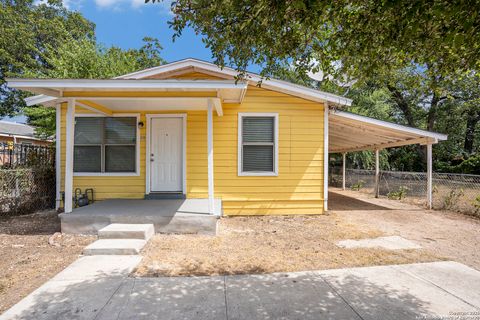
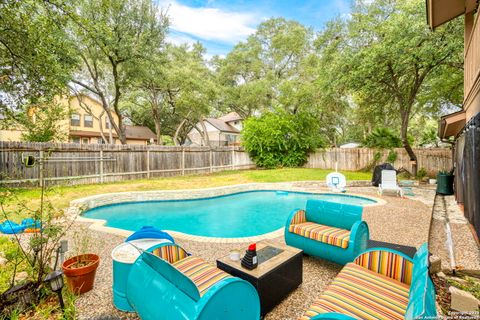
Active
$174,999
1
bds
|
2
ba
|
664
sqft
|
built
2023
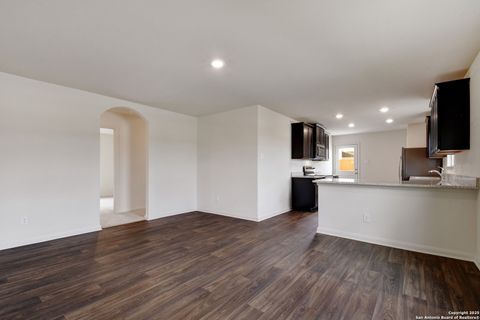
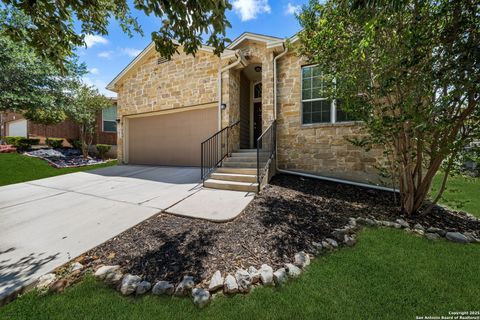
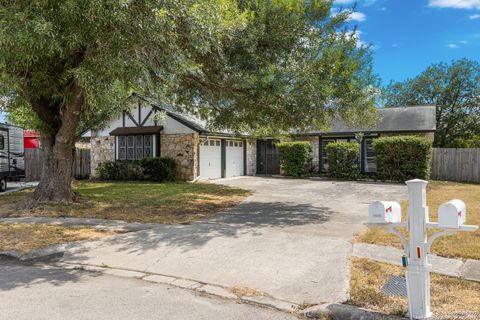
7044 Elm Cv, San Antonio, TX 78244
$130
Cash flow
3.9%
Cash-on-Cash Return
6.6%
Cap rate
0.9%
Rent to Value Ratio
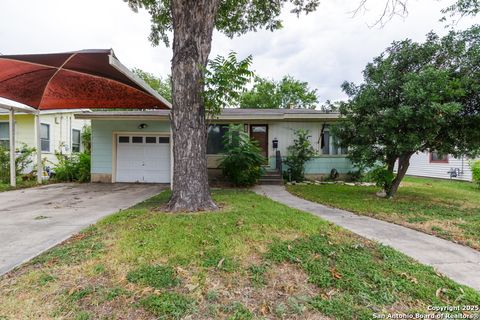
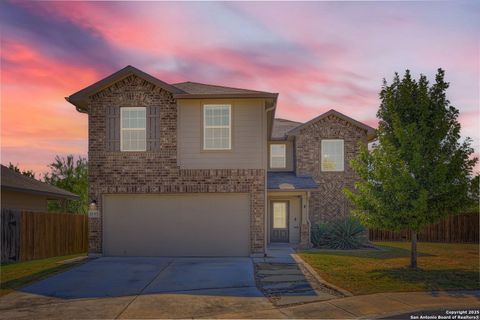
Active
$175,000
2
bds
|
1
ba
|
1,018
sqft
|
built
1952
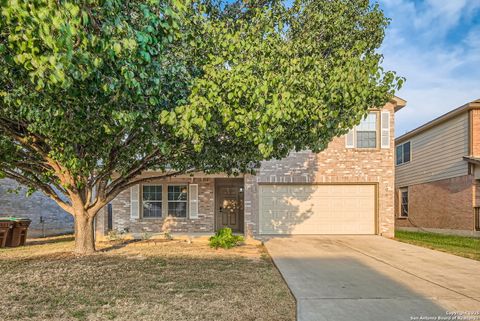
206 Laddie Pl, San Antonio, TX 78201
$24
Cash flow
0.7%
Cash-on-Cash Return
5.8%
Cap rate
0.9%
Rent to Value Ratio
3,836 out of 4,208 properties for sale in Bexar County
Limited Results Shown
Create a free account, or log in to reveal all property listings and enjoy the complete experience.
Active
$675,000
12
bds
|
0
ba
|
5,684
sqft
|
built
2007
10723 Mathom Lndg, Universal City, TX 78148
$-3,653
Cash flow
-28.2%
Cash-on-Cash Return
-0.8%
Cap rate
0.2%
Rent to Value Ratio
Active
$379,000
4
bds
|
3
ba
|
2,378
sqft
|
built
1963
5302 Charter Oak Dr, San Antonio, TX 78229
$-524
Cash flow
-7.2%
Cash-on-Cash Return
4.0%
Cap rate
0.7%
Rent to Value Ratio
Active
$539,900
4
bds
|
4
ba
|
2,970
sqft
|
built
2020
1928 Pitcher Bnd, San Antonio, TX 78253
$-1,242
Cash flow
-12.0%
Cash-on-Cash Return
2.9%
Cap rate
0.6%
Rent to Value Ratio
Active
$259,900
3
bds
|
2
ba
|
1,438
sqft
|
built
1930
330 Givens Ave, San Antonio, TX 78204
$-282
Cash flow
-5.7%
Cash-on-Cash Return
4.4%
Cap rate
0.9%
Rent to Value Ratio
Active
$299,000
4
bds
|
3
ba
|
2,540
sqft
|
built
2012
3806 Impatiens Vw, San Antonio, TX 78245
$-496
Cash flow
-8.7%
Cash-on-Cash Return
3.7%
Cap rate
0.7%
Rent to Value Ratio
Active
$299,000
3
bds
|
2
ba
|
1,755
sqft
|
built
1969
3318 John Glenn Dr, San Antonio, TX 78217
$-746
Cash flow
-13.0%
Cash-on-Cash Return
2.7%
Cap rate
0.6%
Rent to Value Ratio
Active
$299,990
3
bds
|
3
ba
|
2,177
sqft
|
built
2003
14803 Academy Oak, San Antonio, TX 78247
$-402
Cash flow
-7.0%
Cash-on-Cash Return
4.1%
Cap rate
0.7%
Rent to Value Ratio
Active
$420,000
6
bds
|
0
ba
|
2,724
sqft
|
built
2021
6303 Luglio Ln, San Antonio, TX 78233
$-2,001
Cash flow
-24.9%
Cash-on-Cash Return
0.0%
Cap rate
0.3%
Rent to Value Ratio
Active
$235,000
3
bds
|
1
ba
|
1,306
sqft
|
built
1944
2602 S Olive St, San Antonio, TX 78210
$-162
Cash flow
-3.6%
Cash-on-Cash Return
4.9%
Cap rate
0.9%
Rent to Value Ratio

Active
$685,000
5
bds
|
3
ba
|
2,591
sqft
|
built
1935
228 W Woodlawn Ave, San Antonio, TX 78212
$-2,309
Cash flow
-17.6%
Cash-on-Cash Return
1.6%
Cap rate
0.4%
Rent to Value Ratio
Active
$285,000
3
bds
|
2
ba
|
1,450
sqft
|
built
1928
1722 W Ridgewood Ct, San Antonio, TX 78201
$-653
Cash flow
-12.0%
Cash-on-Cash Return
2.9%
Cap rate
0.5%
Rent to Value Ratio

Active
$135,000
3
bds
|
1
ba
|
1,198
sqft
|
built
1930
2259 N Interstate 35, San Antonio, TX 78208
$-3
Cash flow
-0.1%
Cash-on-Cash Return
5.7%
Cap rate
1.1%
Rent to Value Ratio

Active
$449,900
4
bds
|
3
ba
|
2,536
sqft
|
built
2016
27351 Rio Bnd, Boerne, TX 78015
$-221
Cash flow
-2.6%
Cash-on-Cash Return
5.1%
Cap rate
0.6%
Rent to Value Ratio
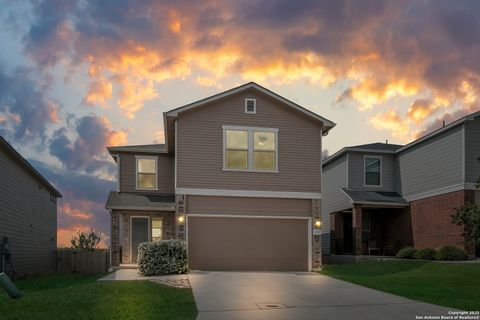
Active
$300,900
4
bds
|
2
ba
|
1,794
sqft
|
built
2022
15326 Waterow Vw, Von Ormy, TX 78073
$-80
Cash flow
-1.4%
Cash-on-Cash Return
5.4%
Cap rate
0.7%
Rent to Value Ratio
Active
$240,000
3
bds
|
2
ba
|
1,579
sqft
|
built
2012
7202 Aldebaran Sun, San Antonio, TX 78252
$-426
Cash flow
-9.3%
Cash-on-Cash Return
3.6%
Cap rate
0.8%
Rent to Value Ratio
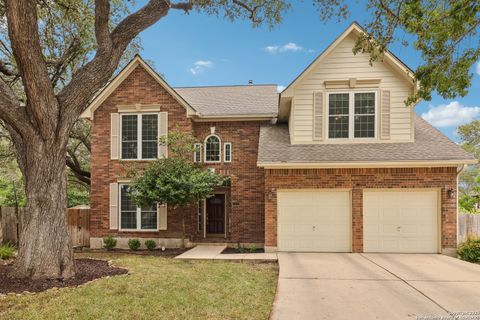
Active
$319,000
4
bds
|
3
ba
|
2,596
sqft
|
built
2004
206 Birchwood Bay, San Antonio, TX 78253
$-48,655
Cash flow
-795.8%
Cash-on-Cash Return
-177.3%
Cap rate
0.7%
Rent to Value Ratio
Active
$240,000
3
bds
|
3
ba
|
1,617
sqft
|
built
2020
8218 Blue Canal, San Antonio, TX 78244
$-404
Cash flow
-8.8%
Cash-on-Cash Return
3.7%
Cap rate
0.7%
Rent to Value Ratio
Active
$290,000
4
bds
|
3
ba
|
1,698
sqft
|
built
1977
13200 Montecito, San Antonio, TX 78233
$-634
Cash flow
-11.4%
Cash-on-Cash Return
3.1%
Cap rate
0.7%
Rent to Value Ratio
Active
$349,000
4
bds
|
3
ba
|
1,702
sqft
|
built
1964
207 E Woodlake Dr, San Antonio, TX 78229
$-272
Cash flow
-4.1%
Cash-on-Cash Return
4.7%
Cap rate
0.6%
Rent to Value Ratio
Active
$157,500
2
bds
|
2
ba
|
1,115
sqft
|
built
1984
12610 Uhr Ln, San Antonio, TX 78217
$-539
Cash flow
-17.9%
Cash-on-Cash Return
1.6%
Cap rate
0.9%
Rent to Value Ratio
Active
$390,000
4
bds
|
3
ba
|
2,462
sqft
|
built
2019
8611 Pinto Cyn, San Antonio, TX 78254
$-855
Cash flow
-11.4%
Cash-on-Cash Return
3.0%
Cap rate
0.6%
Rent to Value Ratio
Active
$280,000
4
bds
|
3
ba
|
2,278
sqft
|
built
2006
11118 Ballard Peak, San Antonio, TX 78254
$-406
Cash flow
-7.6%
Cash-on-Cash Return
3.9%
Cap rate
0.7%
Rent to Value Ratio

Active
$1,249,777
5
bds
|
5
ba
|
4,210
sqft
|
built
2011
135 Penns Way, Shavano Park, TX 78231
$-5,326
Cash flow
-22.2%
Cash-on-Cash Return
0.6%
Cap rate
0.3%
Rent to Value Ratio
Active
$310,000
4
bds
|
3
ba
|
2,900
sqft
|
built
2007
6741 Wayman Rdg, Live Oak, TX 78233
$-692
Cash flow
-11.6%
Cash-on-Cash Return
3.0%
Cap rate
0.6%
Rent to Value Ratio

Active
$235,000
2
bds
|
3
ba
|
1,671
sqft
|
built
2006
13411 Bristow Dawn, San Antonio, TX 78217
$-609
Cash flow
-13.5%
Cash-on-Cash Return
2.6%
Cap rate
0.8%
Rent to Value Ratio
Active
$479,900
4
bds
|
3
ba
|
3,085
sqft
|
built
2002
9546 Haviland Ct, San Antonio, TX 78251
$-1,422
Cash flow
-15.5%
Cash-on-Cash Return
2.1%
Cap rate
0.5%
Rent to Value Ratio
Active
$625,000
4
bds
|
3
ba
|
2,951
sqft
|
built
1979
311 Bluffcrest, San Antonio, TX 78216
$-1,926
Cash flow
-16.1%
Cash-on-Cash Return
2.0%
Cap rate
0.5%
Rent to Value Ratio
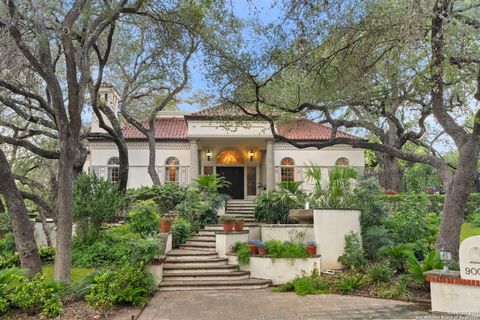
Active
$1,695,000
6
bds
|
6
ba
|
5,024
sqft
|
built
1987
9003 Village Dr, San Antonio, TX 78217
$-6,351
Cash flow
-19.5%
Cash-on-Cash Return
1.2%
Cap rate
0.4%
Rent to Value Ratio
Active
$405,000
3
bds
|
2
ba
|
2,250
sqft
|
built
1991
13014 Rambling Oak, San Antonio, TX 78232
$-1,080
Cash flow
-13.9%
Cash-on-Cash Return
2.5%
Cap rate
0.6%
Rent to Value Ratio
Active
$589,000
4
bds
|
4
ba
|
3,191
sqft
|
built
2002
1711 Montecino, San Antonio, TX 78258
$-1,522
Cash flow
-13.5%
Cash-on-Cash Return
2.6%
Cap rate
0.6%
Rent to Value Ratio
Active
$232,500
3
bds
|
2
ba
|
1,450
sqft
|
built
2023
4510 Martin Way, San Antonio, TX 78222
$-259
Cash flow
-5.8%
Cash-on-Cash Return
4.3%
Cap rate
0.8%
Rent to Value Ratio
Active
$140,000
3
bds
|
1
ba
|
728
sqft
|
built
1943
235 Noria St, San Antonio, TX 78207
$-257
Cash flow
-9.6%
Cash-on-Cash Return
3.5%
Cap rate
0.6%
Rent to Value Ratio
Active
$450,000
4
bds
|
3
ba
|
2,474
sqft
|
built
1992
1302 Adobe Run, San Antonio, TX 78232
$-1,343
Cash flow
-15.6%
Cash-on-Cash Return
2.1%
Cap rate
0.6%
Rent to Value Ratio

Active
$975,000
4
bds
|
5
ba
|
4,024
sqft
|
built
2008
10526 Campo Viejo, Boerne, TX 78006
$-2,055
Cash flow
-11.0%
Cash-on-Cash Return
3.1%
Cap rate
0.6%
Rent to Value Ratio
Active
$260,000
3
bds
|
3
ba
|
1,772
sqft
|
built
2020
4447 Tivoli Dr, Converse, TX 78109
$-430
Cash flow
-8.6%
Cash-on-Cash Return
3.7%
Cap rate
0.7%
Rent to Value Ratio
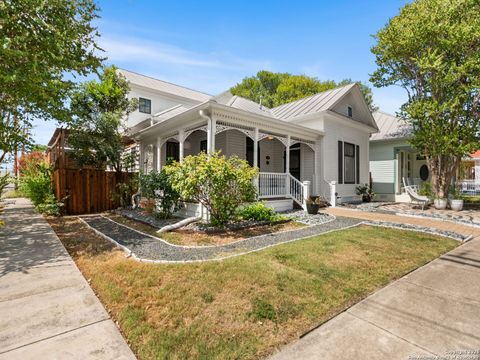
Active
$675,000
3
bds
|
3
ba
|
2,185
sqft
|
built
1920
126 Daniel St, San Antonio, TX 78204
$-2,117
Cash flow
-16.4%
Cash-on-Cash Return
1.9%
Cap rate
0.5%
Rent to Value Ratio
Active
$429,316
4
bds
|
2
ba
|
2,146
sqft
|
built
1983
8923 Rustling Branches, San Antonio, TX 78254
$-1,210
Cash flow
-14.7%
Cash-on-Cash Return
2.3%
Cap rate
0.5%
Rent to Value Ratio
Active
$320,000
3
bds
|
3
ba
|
2,188
sqft
|
built
2018
10703 Spirit Roam, San Antonio, TX 78254
$-698
Cash flow
-11.4%
Cash-on-Cash Return
3.1%
Cap rate
0.6%
Rent to Value Ratio