Bexar County Investment Properties for Sale
Browse homes for sale and investment properties in Bexar County. Refine your search by price, property type, or more.
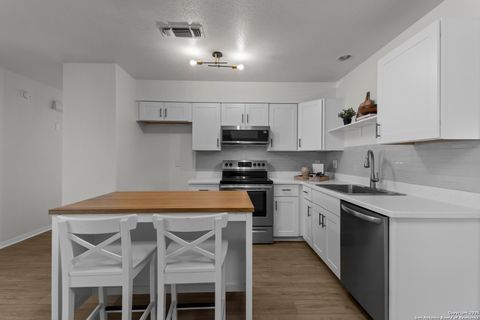
Best cash flowing properties in Bexar County
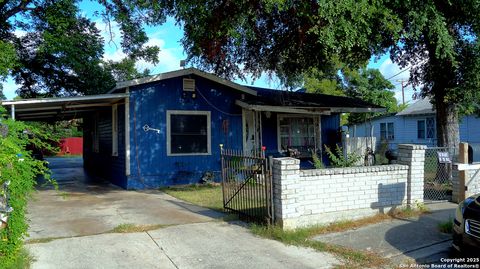
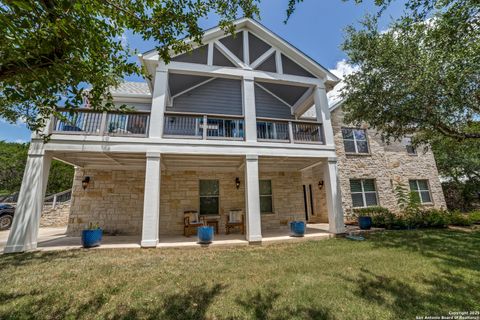
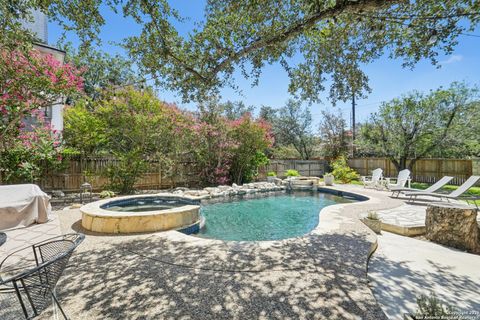
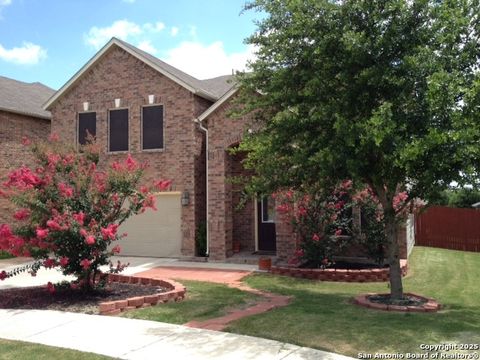
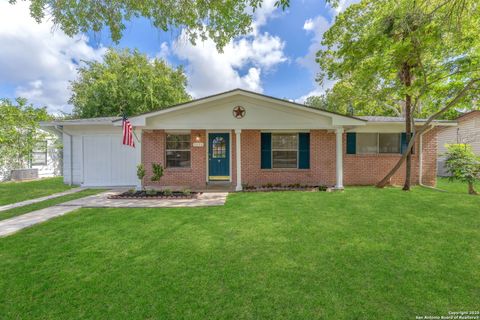
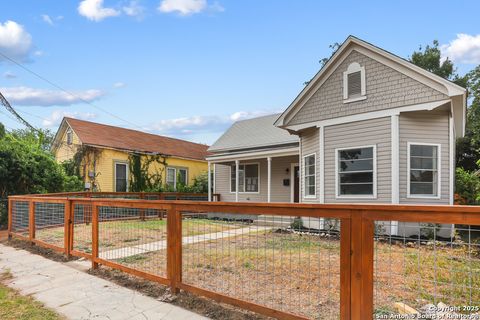
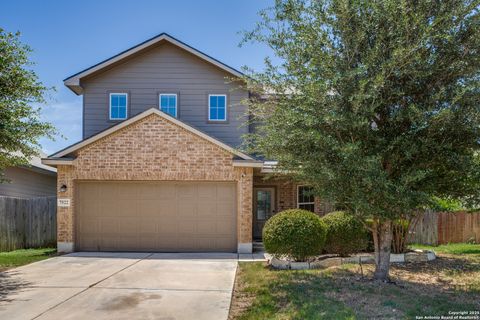
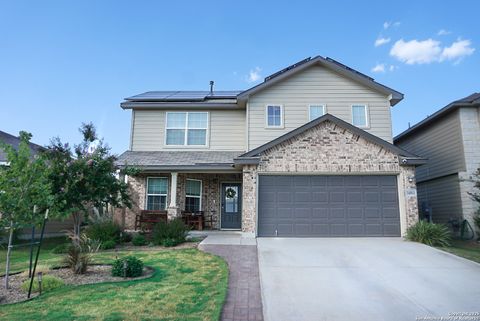
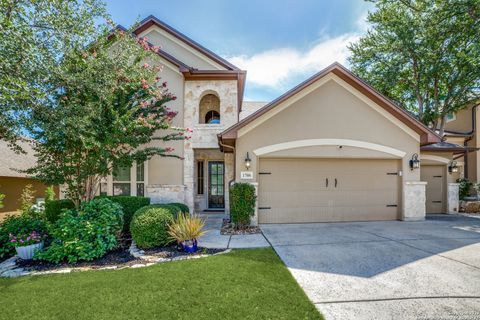
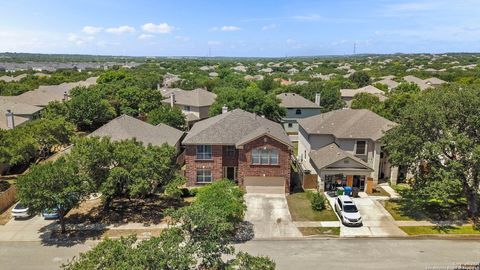
Active
$140,000
4
bds
|
2
ba
|
1,048
sqft
|
built
1956
117 S San Felipe Ave, San Antonio, TX 78237
$52
Cash flow
1.9%
Cash-on-Cash Return
6.1%
Cap rate
1.0%
Rent to Value Ratio
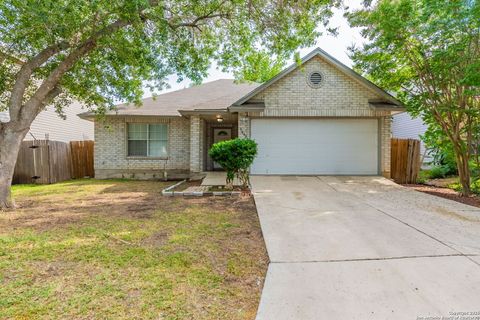
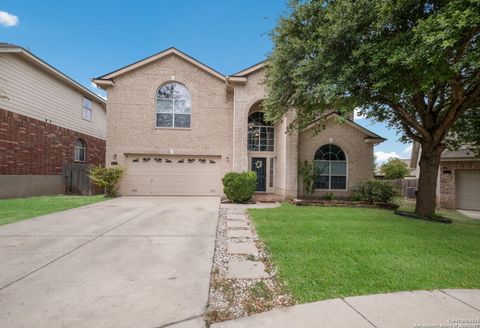
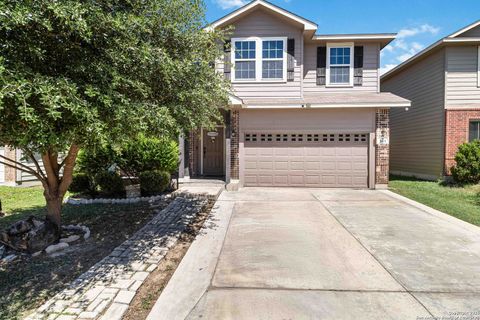
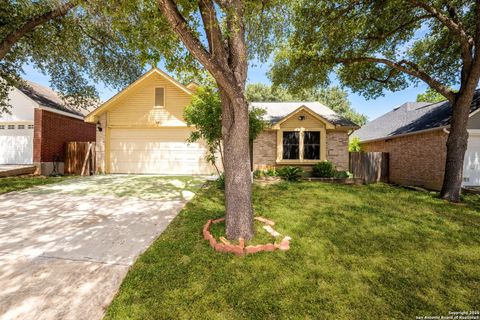
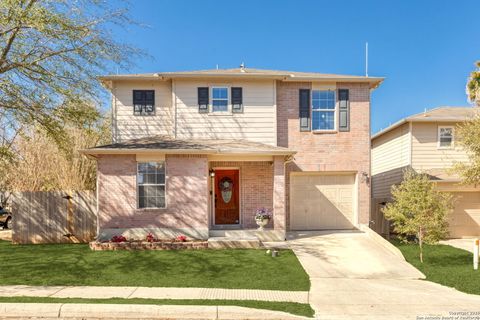
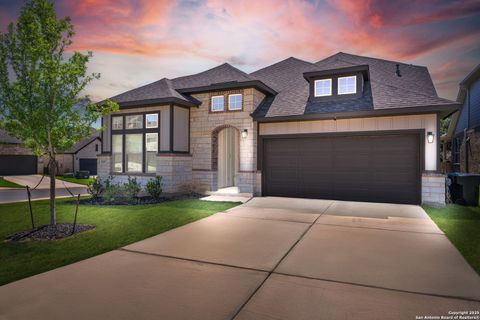
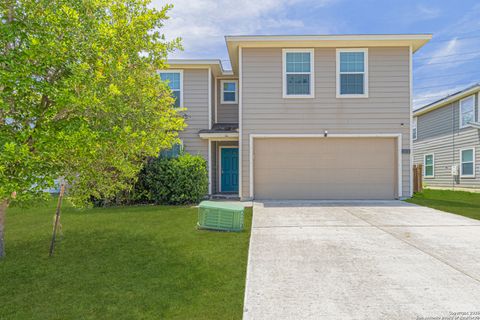
Active
$200,000
3
bds
|
2
ba
|
1,467
sqft
|
built
2001
10622 Cavelier Pt, San Antonio, TX 78254
$-151
Cash flow
-3.9%
Cash-on-Cash Return
4.8%
Cap rate
0.9%
Rent to Value Ratio
4,283 out of 4,689 properties for sale in Bexar County
Limited Results Shown
Create a free account, or log in to reveal all property listings and enjoy the complete experience.
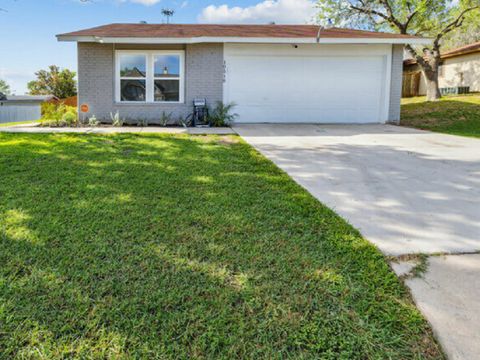
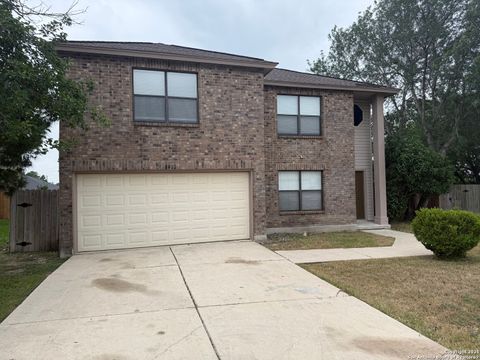
Active
$199,000
4
bds
|
2
ba
|
1,447
sqft
|
built
1978
10302 Little Sugar Crk, Converse, TX 78109
$-268
Cash flow
-7.0%
Cash-on-Cash Return
4.1%
Cap rate
0.8%
Rent to Value Ratio
Active
$324,900
5
bds
|
2
ba
|
2,003
sqft
|
built
2012
10421 Mac Arthur Way, Converse, TX 78109
$-619
Cash flow
-9.9%
Cash-on-Cash Return
3.4%
Cap rate
0.7%
Rent to Value Ratio
Active
$675,000
4
bds
|
3
ba
|
2,546
sqft
|
built
2004
9845 Scenic Hills Dr, San Antonio, TX 78255
$-1,722
Cash flow
-13.3%
Cash-on-Cash Return
2.6%
Cap rate
0.5%
Rent to Value Ratio
Active
$500,000
4
bds
|
3
ba
|
2,625
sqft
|
built
1994
15202 Rompel Trail Dr, San Antonio, TX 78232
$-1,071
Cash flow
-11.2%
Cash-on-Cash Return
3.1%
Cap rate
0.6%
Rent to Value Ratio
Active
$435,000
4
bds
|
3
ba
|
3,224
sqft
|
built
2006
6214 Ozona Ml, San Antonio, TX 78253
$-968
Cash flow
-11.6%
Cash-on-Cash Return
3.0%
Cap rate
0.6%
Rent to Value Ratio
Active
$238,000
3
bds
|
2
ba
|
1,151
sqft
|
built
1983
10510 Kinderhook, San Antonio, TX 78245
$-409
Cash flow
-9.0%
Cash-on-Cash Return
3.6%
Cap rate
0.7%
Rent to Value Ratio
Active
$389,900
6
bds
|
4
ba
|
3,409
sqft
|
built
2005
506 Leafy Rdg, San Antonio, TX 78251
$-1,152
Cash flow
-15.4%
Cash-on-Cash Return
2.1%
Cap rate
0.6%
Rent to Value Ratio
Active
$237,500
4
bds
|
3
ba
|
1,377
sqft
|
built
1975
14423 Briarlake St, San Antonio, TX 78247
$-390
Cash flow
-8.6%
Cash-on-Cash Return
3.7%
Cap rate
0.7%
Rent to Value Ratio
Active
$370,000
5
bds
|
3
ba
|
2,501
sqft
|
built
2017
3431 Still Pond, San Antonio, TX 78245
$-889
Cash flow
-12.5%
Cash-on-Cash Return
2.8%
Cap rate
0.5%
Rent to Value Ratio
Active
$285,000
2
bds
|
2
ba
|
1,023
sqft
|
built
2007
7342 Oak Manor Dr, San Antonio, TX 78229
$-878
Cash flow
-16.1%
Cash-on-Cash Return
2.0%
Cap rate
0.5%
Rent to Value Ratio
Active
$165,000
3
bds
|
1
ba
|
1,275
sqft
|
built
1962
5131 Redding Ln, Kirby, TX 78219
$-156
Cash flow
-4.9%
Cash-on-Cash Return
4.5%
Cap rate
0.8%
Rent to Value Ratio
Active
$215,000
2
bds
|
2
ba
|
1,465
sqft
|
built
1994
4811 Aspen Vw, San Antonio, TX 78217
$-368
Cash flow
-8.9%
Cash-on-Cash Return
3.6%
Cap rate
0.7%
Rent to Value Ratio
Active
$540,000
4
bds
|
4
ba
|
3,239
sqft
|
built
2019
9109 Sunpool, Schertz, TX 78154
$-1,381
Cash flow
-13.3%
Cash-on-Cash Return
2.6%
Cap rate
0.5%
Rent to Value Ratio
Active
$370,000
5
bds
|
4
ba
|
2,712
sqft
|
built
2019
5934 Concho Riv, San Antonio, TX 78253
$-722
Cash flow
-10.2%
Cash-on-Cash Return
3.3%
Cap rate
0.7%
Rent to Value Ratio
Active
$380,000
3
bds
|
3
ba
|
1,562
sqft
|
built
1930
926 Nolan St, San Antonio, TX 78202
$-1,399
Cash flow
-19.2%
Cash-on-Cash Return
1.3%
Cap rate
0.3%
Rent to Value Ratio
Active
$289,900
2
bds
|
2
ba
|
854
sqft
|
built
1920
228 Sherman, San Antonio, TX 78202
$-737
Cash flow
-13.3%
Cash-on-Cash Return
2.6%
Cap rate
0.6%
Rent to Value Ratio
Active
$449,900
4
bds
|
3
ba
|
2,489
sqft
|
built
2010
3715 Sweet Olive, San Antonio, TX 78261
$-1,096
Cash flow
-12.7%
Cash-on-Cash Return
2.8%
Cap rate
0.6%
Rent to Value Ratio
Active
$320,000
3
bds
|
3
ba
|
1,500
sqft
|
built
1985
13014 Trent St, San Antonio, TX 78232
$-957
Cash flow
-15.6%
Cash-on-Cash Return
2.1%
Cap rate
0.6%
Rent to Value Ratio
Active
$315,000
4
bds
|
3
ba
|
2,298
sqft
|
built
2018
7522 Rigel Chase, San Antonio, TX 78252
$-723
Cash flow
-12.0%
Cash-on-Cash Return
2.9%
Cap rate
0.6%
Rent to Value Ratio
Active
$289,000
3
bds
|
3
ba
|
2,185
sqft
|
built
2005
16115 Branching Oaks, San Antonio, TX 78247
$-595
Cash flow
-10.7%
Cash-on-Cash Return
3.2%
Cap rate
0.7%
Rent to Value Ratio
Active
$665,000
4
bds
|
4
ba
|
3,508
sqft
|
built
2006
18339 Emerald Oaks Dr, San Antonio, TX 78259
$-1,912
Cash flow
-15.0%
Cash-on-Cash Return
2.2%
Cap rate
0.6%
Rent to Value Ratio
Active
$500,000
4
bds
|
4
ba
|
2,711
sqft
|
built
2017
8737 Stackstone, Schertz, TX 78154
$-1,546
Cash flow
-16.1%
Cash-on-Cash Return
2.0%
Cap rate
0.5%
Rent to Value Ratio
Active
$349,999
4
bds
|
3
ba
|
2,323
sqft
|
built
2021
14811 Goldfinch Way, San Antonio, TX 78253
$-624
Cash flow
-9.3%
Cash-on-Cash Return
3.5%
Cap rate
0.6%
Rent to Value Ratio
Active
$590,000
3
bds
|
2
ba
|
2,525
sqft
|
built
2023
16203 Bronco Vw, San Antonio, TX 78247
$-1,989
Cash flow
-17.6%
Cash-on-Cash Return
1.6%
Cap rate
0.5%
Rent to Value Ratio
Active
$259,999
5
bds
|
3
ba
|
2,175
sqft
|
built
2006
7451 Circle Farm, San Antonio, TX 78239
$-475
Cash flow
-9.5%
Cash-on-Cash Return
3.5%
Cap rate
0.7%
Rent to Value Ratio
Active
$389,990
4
bds
|
3
ba
|
2,606
sqft
|
built
2021
12003 Sitio Plns, San Antonio, TX 78254
$-758
Cash flow
-10.1%
Cash-on-Cash Return
3.3%
Cap rate
0.6%
Rent to Value Ratio
Active
$589,900
5
bds
|
3
ba
|
2,891
sqft
|
built
2013
1706 Nightshade, San Antonio, TX 78260
$-1,520
Cash flow
-13.4%
Cash-on-Cash Return
2.6%
Cap rate
0.5%
Rent to Value Ratio
Active
$250,000
4
bds
|
3
ba
|
2,116
sqft
|
built
2012
11410 Durango Way, San Antonio, TX 78245
$-275
Cash flow
-5.7%
Cash-on-Cash Return
4.4%
Cap rate
0.8%
Rent to Value Ratio
Active
$245,000
3
bds
|
3
ba
|
2,144
sqft
|
built
1997
8022 Chestnut Clay Ln, Converse, TX 78109
$-311
Cash flow
-6.6%
Cash-on-Cash Return
4.2%
Cap rate
0.7%
Rent to Value Ratio
Active
$619,000
4
bds
|
4
ba
|
3,836
sqft
|
built
2016
10513 Far Reaches Ln, Helotes, TX 78023
$-1,615
Cash flow
-13.6%
Cash-on-Cash Return
2.5%
Cap rate
0.6%
Rent to Value Ratio
Active
$367,000
4
bds
|
3
ba
|
3,041
sqft
|
built
2003
8747 Feather Trl, Helotes, TX 78023
$-860
Cash flow
-12.2%
Cash-on-Cash Return
2.9%
Cap rate
0.7%
Rent to Value Ratio
Active
$255,000
3
bds
|
2
ba
|
1,522
sqft
|
built
1998
9518 Arcadia Crk, San Antonio, TX 78251
$-595
Cash flow
-12.2%
Cash-on-Cash Return
2.9%
Cap rate
0.6%
Rent to Value Ratio
Active
$330,000
3
bds
|
2
ba
|
1,601
sqft
|
built
2004
15522 Flowing Spg, San Antonio, TX 78247
$-791
Cash flow
-12.5%
Cash-on-Cash Return
2.8%
Cap rate
0.5%
Rent to Value Ratio
Active
$268,000
2
bds
|
2
ba
|
1,281
sqft
|
built
2007
12323 Abbey Gdn, San Antonio, TX 78249
$-757
Cash flow
-14.7%
Cash-on-Cash Return
2.3%
Cap rate
0.6%
Rent to Value Ratio
Active
$230,000
3
bds
|
2
ba
|
1,154
sqft
|
built
1980
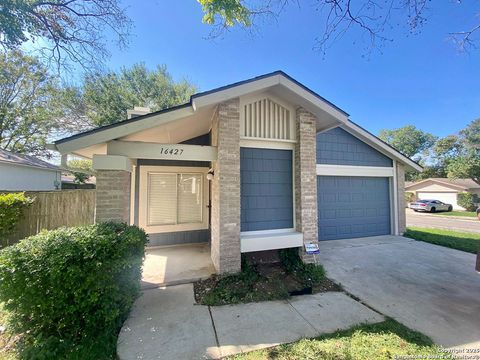
16427 Oak Rock St, San Antonio, TX 78247
$-287
Cash flow
-6.5%
Cash-on-Cash Return
4.2%
Cap rate
0.8%
Rent to Value Ratio
Active
$239,000
3
bds
|
2
ba
|
1,460
sqft
|
built
1985
6426 Indian Run, San Antonio, TX 78233
$-460
Cash flow
-10.0%
Cash-on-Cash Return
3.4%
Cap rate
0.7%
Rent to Value Ratio
Active
$299,999
3
bds
|
2
ba
|
1,646
sqft
|
built
2014
7606 Heavenly Arbor, San Antonio, TX 78254
$-505
Cash flow
-8.8%
Cash-on-Cash Return
3.7%
Cap rate
0.7%
Rent to Value Ratio
Active
$249,900
3
bds
|
2
ba
|
1,417
sqft
|
built
2019
14610 Jocasta Dr, San Antonio, TX 78245
$-412
Cash flow
-8.6%
Cash-on-Cash Return
3.7%
Cap rate
0.7%
Rent to Value Ratio