Bexar County Investment Properties for Sale
Browse homes for sale and investment properties in Bexar County. Refine your search by price, property type, or more.
Best cash flowing properties in Bexar County
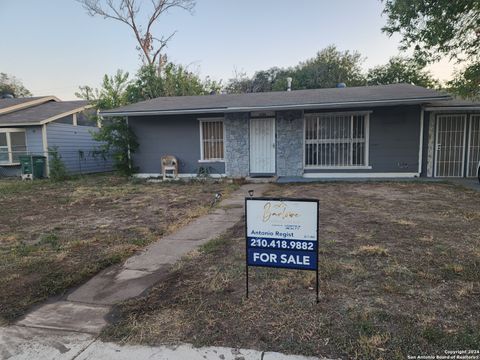
Active
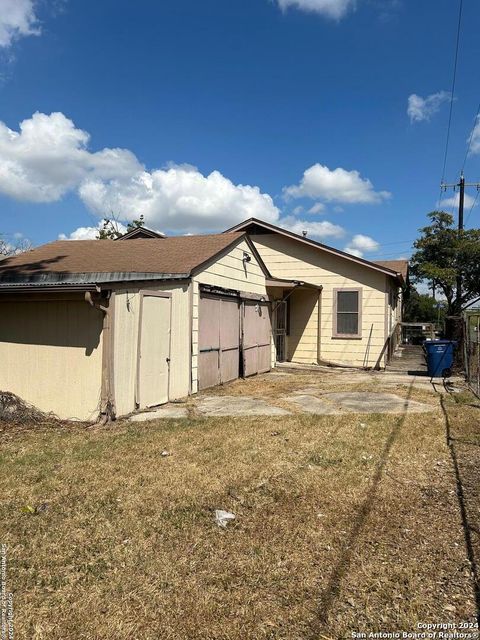
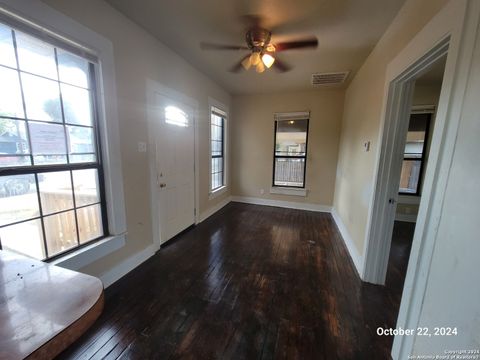
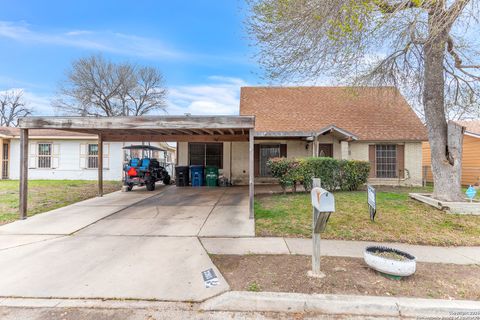
$109,000
3
bds
|
2
ba
|
1,344
sqft
|
built
1947
398 Fairview Ave, San Antonio, TX 78223
$52
Cash flow
2.5%
Cash-on-Cash Return
6.3%
Cap rate
1.3%
Rent to Value Ratio
Active
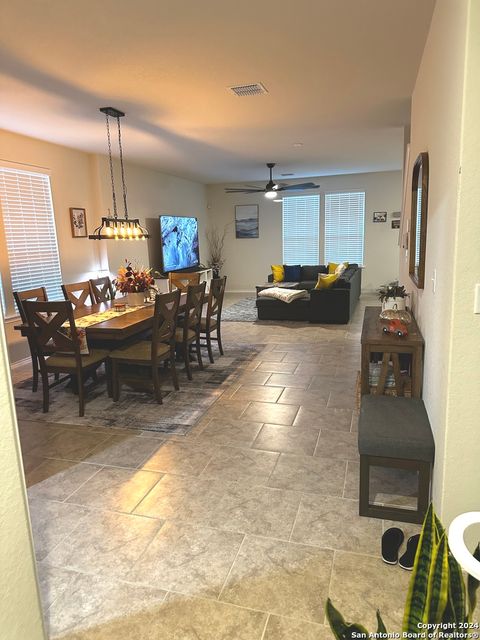
$114,900
2
bds
|
1
ba
|
693
sqft
|
built
1949
737 Kendalia Ave, San Antonio, TX 78221
$13
Cash flow
0.6%
Cash-on-Cash Return
5.8%
Cap rate
1.0%
Rent to Value Ratio
3,836 out of 4,208 properties for sale in Bexar County
Limited Results Shown
Create a free account, or log in to reveal all property listings and enjoy the complete experience.
Active
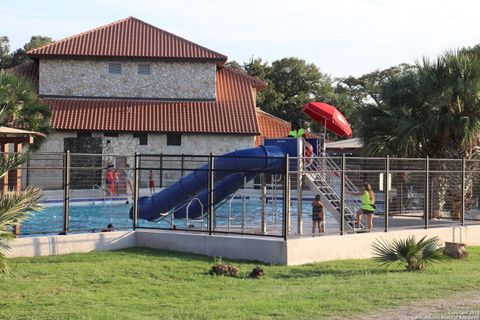
$269,500
3
bds
|
2
ba
|
1,452
sqft
|
built
1962
221 Windcrest Dr, Windcrest, TX 78239
$-475
Cash flow
-9.2%
Cash-on-Cash Return
3.6%
Cap rate
0.7%
Rent to Value Ratio

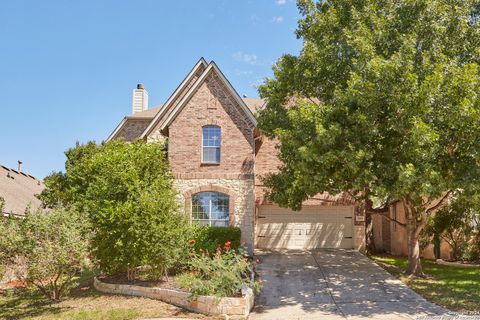
Active
$215,000
3
bds
|
2
ba
|
1,085
sqft
|
built
1981
9219 Valley Dale St, San Antonio, TX 78250
$-347
Cash flow
-8.4%
Cash-on-Cash Return
3.7%
Cap rate
0.7%
Rent to Value Ratio

Active
$1,280,000
4
bds
|
4
ba
|
3,459
sqft
|
built
1949
106 Morningside Dr, Terrell Hills, TX 78209
$-3,599
Cash flow
-14.7%
Cash-on-Cash Return
2.3%
Cap rate
0.4%
Rent to Value Ratio
Active
$262,500
4
bds
|
2
ba
|
2,604
sqft
|
built
2012
23238 Copper Canyon Dr, Elmendorf, TX 78112
$-300
Cash flow
-6.0%
Cash-on-Cash Return
4.3%
Cap rate
0.7%
Rent to Value Ratio

Active
$173,000
3
bds
|
2
ba
|
1,269
sqft
|
built
1973
8414 Glen Breeze, San Antonio, TX 78239
$-161
Cash flow
-4.9%
Cash-on-Cash Return
4.6%
Cap rate
0.8%
Rent to Value Ratio
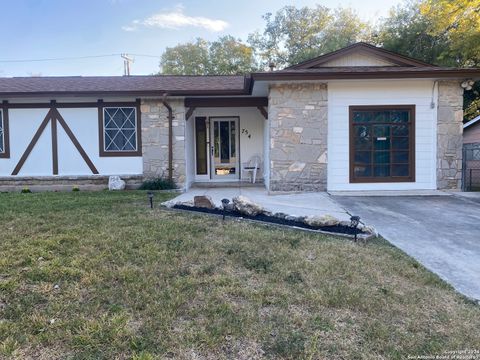
Active
$265,000
4
bds
|
2
ba
|
1,585
sqft
|
built
1971
754 Clearview Dr, San Antonio, TX 78228
$-429
Cash flow
-8.4%
Cash-on-Cash Return
3.7%
Cap rate
0.7%
Rent to Value Ratio
Active
$307,000
4
bds
|
3
ba
|
2,320
sqft
|
built
2006
11923 Ranchwell Cv, San Antonio, TX 78249
$-536
Cash flow
-9.1%
Cash-on-Cash Return
3.6%
Cap rate
0.7%
Rent to Value Ratio
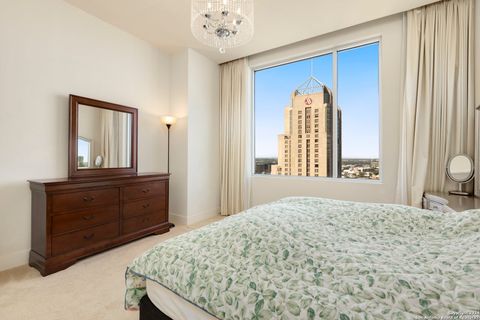
Active
$647,000
2
bds
|
2
ba
|
1,530
sqft
|
built
2007
610 E Market St, San Antonio, TX 78205
$-2,903
Cash flow
-23.4%
Cash-on-Cash Return
0.3%
Cap rate
0.6%
Rent to Value Ratio

Active
$315,000
3
bds
|
3
ba
|
2,175
sqft
|
built
2021
12121 Old Onyx, San Antonio, TX 78245
$-487
Cash flow
-8.1%
Cash-on-Cash Return
3.8%
Cap rate
0.7%
Rent to Value Ratio
Active
$278,000
3
bds
|
2
ba
|
1,785
sqft
|
built
1973
4543 Guadalajara Dr, San Antonio, TX 78233
$-599
Cash flow
-11.2%
Cash-on-Cash Return
3.1%
Cap rate
0.6%
Rent to Value Ratio
Active
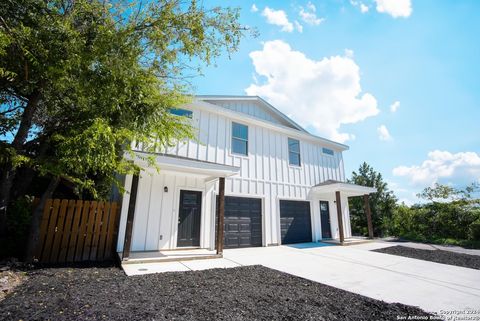
$529,000
6
bds
|
0
ba
|
2,800
sqft
|
built
2024
1210 S New Braunfels Ave, San Antonio, TX 78210
$-1,644
Cash flow
-16.2%
Cash-on-Cash Return
1.9%
Cap rate
0.3%
Rent to Value Ratio
Active
$280,000
3
bds
|
3
ba
|
2,173
sqft
|
built
2005
2815 Bandbury Oak, San Antonio, TX 78247
$-505
Cash flow
-9.4%
Cash-on-Cash Return
3.5%
Cap rate
0.7%
Rent to Value Ratio
Active
$213,000
4
bds
|
3
ba
|
1,536
sqft
|
built
1958
4106 Wild Oak Dr, San Antonio, TX 78219
$-309
Cash flow
-7.6%
Cash-on-Cash Return
3.9%
Cap rate
0.7%
Rent to Value Ratio
Active
$320,000
5
bds
|
3
ba
|
2,910
sqft
|
built
1913
722 E Drexel Ave, San Antonio, TX 78210
$-400
Cash flow
-6.5%
Cash-on-Cash Return
4.2%
Cap rate
0.9%
Rent to Value Ratio
Active
$381,000
4
bds
|
3
ba
|
2,521
sqft
|
built
2006
4307 James Bowie, San Antonio, TX 78253
$-861
Cash flow
-11.8%
Cash-on-Cash Return
3.0%
Cap rate
0.6%
Rent to Value Ratio
Active
$279,500
3
bds
|
2
ba
|
1,903
sqft
|
built
2006
11615 Huisache Daisy, San Antonio, TX 78245
$-462
Cash flow
-8.6%
Cash-on-Cash Return
3.7%
Cap rate
0.7%
Rent to Value Ratio

Active
$348,000
3
bds
|
2
ba
|
2,045
sqft
|
built
2015
5018 Italica Rd, San Antonio, TX 78253
$-730
Cash flow
-10.9%
Cash-on-Cash Return
3.2%
Cap rate
0.6%
Rent to Value Ratio
Active
$564,000
4
bds
|
3
ba
|
2,720
sqft
|
built
1987
1203 Vista Del Juez, San Antonio, TX 78216
$-1,509
Cash flow
-14.0%
Cash-on-Cash Return
2.5%
Cap rate
0.5%
Rent to Value Ratio
Active
$550,000
12
bds
|
0
ba
|
4,350
sqft
|
built
2024
21149 Interstate 37 S, Elmendorf, TX 78112
$-1,637
Cash flow
-15.5%
Cash-on-Cash Return
2.1%
Cap rate
0.3%
Rent to Value Ratio
Active
$360,000
4
bds
|
3
ba
|
2,882
sqft
|
built
2006
7347 Concerto Dr, San Antonio, TX 78266
$-689
Cash flow
-10.0%
Cash-on-Cash Return
3.4%
Cap rate
0.7%
Rent to Value Ratio
Active
$375,000
4
bds
|
3
ba
|
2,115
sqft
|
built
1996
638 Spacious Sky, San Antonio, TX 78260
$-687
Cash flow
-9.6%
Cash-on-Cash Return
3.5%
Cap rate
0.7%
Rent to Value Ratio
Active
$215,000
1
bds
|
1
ba
|
650
sqft
|
built
1946
1331 S Flores St, San Antonio, TX 78204
$-659
Cash flow
-16.0%
Cash-on-Cash Return
2.0%
Cap rate
0.7%
Rent to Value Ratio
Active
$340,000
5
bds
|
3
ba
|
2,595
sqft
|
built
2006
5823 Barton Holw, San Antonio, TX 78249
$-677
Cash flow
-10.4%
Cash-on-Cash Return
3.3%
Cap rate
0.7%
Rent to Value Ratio

Active
$315,000
4
bds
|
0
ba
|
1,696
sqft
|
built
1908
418 Warren St, San Antonio, TX 78212
$-1,265
Cash flow
-21.0%
Cash-on-Cash Return
0.9%
Cap rate
0.3%
Rent to Value Ratio
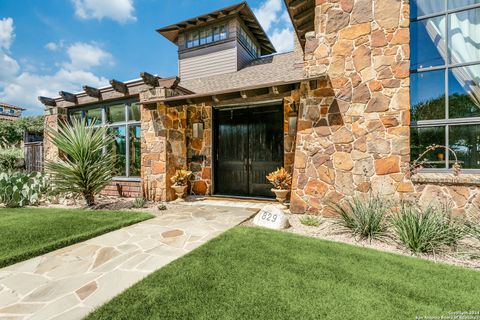
Active
$1,195,000
4
bds
|
3
ba
|
4,571
sqft
|
built
2005
829 Terrell Rd, Terrell Hills, TX 78209
$-3,545
Cash flow
-15.5%
Cash-on-Cash Return
2.1%
Cap rate
0.5%
Rent to Value Ratio

Active
$489,000
5
bds
|
4
ba
|
2,839
sqft
|
built
1953
101 Linda Dr, San Antonio, TX 78216
$-1,165
Cash flow
-12.4%
Cash-on-Cash Return
2.8%
Cap rate
0.7%
Rent to Value Ratio
Active
$255,000
4
bds
|
2
ba
|
1,567
sqft
|
built
1983
7111 Bart Holw, San Antonio, TX 78250
$-509
Cash flow
-10.4%
Cash-on-Cash Return
3.3%
Cap rate
0.7%
Rent to Value Ratio
Active
$147,500
4
bds
|
4
ba
|
2,002
sqft
|
built
1929
348 Pendleton Ave, San Antonio, TX 78204
$-483
Cash flow
-17.1%
Cash-on-Cash Return
1.7%
Cap rate
0.9%
Rent to Value Ratio
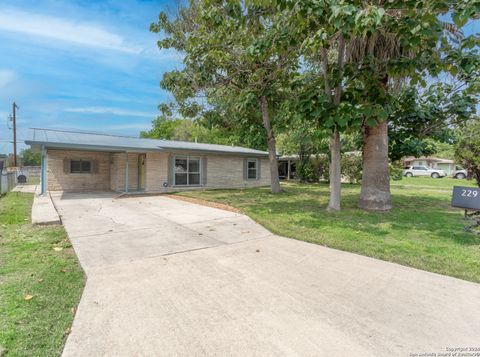
Active
$215,000
3
bds
|
1
ba
|
1,195
sqft
|
built
1960
229 Weathercock Ln, Windcrest, TX 78239
$-431
Cash flow
-10.5%
Cash-on-Cash Return
3.3%
Cap rate
0.7%
Rent to Value Ratio
Active
$215,000
4
bds
|
3
ba
|
2,134
sqft
|
built
1970
3203 Coconino Dr, San Antonio, TX 78211
$-223
Cash flow
-5.4%
Cash-on-Cash Return
4.4%
Cap rate
0.8%
Rent to Value Ratio
Active
$329,000
4
bds
|
3
ba
|
2,606
sqft
|
built
2023
10623 Mexia Ave, San Antonio, TX 78252
$-580
Cash flow
-9.2%
Cash-on-Cash Return
3.6%
Cap rate
0.7%
Rent to Value Ratio

Active
$230,000
3
bds
|
2
ba
|
1,508
sqft
|
built
1954
3322 W Poplar St, San Antonio, TX 78228
$-208
Cash flow
-4.7%
Cash-on-Cash Return
4.6%
Cap rate
0.8%
Rent to Value Ratio
Active
$342,000
3
bds
|
2
ba
|
1,300
sqft
|
built
1948
2306 W Huisache Ave, San Antonio, TX 78201
$-934
Cash flow
-14.2%
Cash-on-Cash Return
2.4%
Cap rate
0.5%
Rent to Value Ratio

Active
$399,000
4
bds
|
0
ba
|
2,280
sqft
|
built
1910
217 Lotus St, San Antonio, TX 78210
$-2,031
Cash flow
-26.6%
Cash-on-Cash Return
-0.4%
Cap rate
0.3%
Rent to Value Ratio
Active
$440,000
4
bds
|
3
ba
|
2,661
sqft
|
built
2006
3215 Valley Crk, San Antonio, TX 78261
$-1,221
Cash flow
-14.5%
Cash-on-Cash Return
2.3%
Cap rate
0.6%
Rent to Value Ratio

Active
$650,000
4
bds
|
3
ba
|
3,030
sqft
|
built
2023
28415 Seppenfield, San Antonio, TX 78260
$-1,124
Cash flow
-9.0%
Cash-on-Cash Return
3.6%
Cap rate
0.7%
Rent to Value Ratio

Active
$930,000
2
bds
|
2
ba
|
1,819
sqft
|
built
2008
4242 Broadway, San Antonio, TX 78209
$-5,010
Cash flow
-28.1%
Cash-on-Cash Return
-0.8%
Cap rate
0.4%
Rent to Value Ratio

Active
$250,000
3
bds
|
1
ba
|
1,171
sqft
|
built
1948
3435 S Ww White Rd, San Antonio, TX 78222
$-259
Cash flow
-5.4%
Cash-on-Cash Return
4.4%
Cap rate
0.7%
Rent to Value Ratio