Bexar County Investment Properties for Sale
Browse homes for sale and investment properties in Bexar County. Refine your search by price, property type, or more.
Best cash flowing properties in Bexar County
Active
$149,900
3
bds
|
2
ba
|
937
sqft
|
built
1971
5810 Woodhill, San Antonio, TX 78218
$237
Cash flow
8.2%
Cash-on-Cash Return
7.6%
Cap rate
0.9%
Rent to Value Ratio
Active
$130,000
2
bds
|
1
ba
|
944
sqft
|
built
1979
6829 Oldham, San Antonio, TX 78239
$165
Cash flow
6.6%
Cash-on-Cash Return
7.2%
Cap rate
1.1%
Rent to Value Ratio
4,322 out of 4,729 properties for sale in Bexar County
Limited Results Shown
Create a free account, or log in to reveal all property listings and enjoy the complete experience.

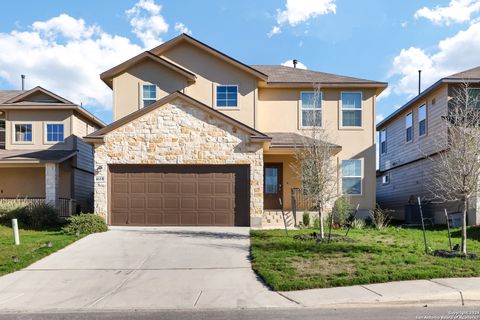
Active
$300,000
4
bds
|
3
ba
|
2,652
sqft
|
built
2006
7419 Monets Gdn, San Antonio, TX 78218
$-488
Cash flow
-8.5%
Cash-on-Cash Return
3.7%
Cap rate
0.7%
Rent to Value Ratio
Active
$126,000
2
bds
|
1
ba
|
723
sqft
|
built
1973
8702 Village Dr, San Antonio, TX 78217
$11
Cash flow
0.5%
Cash-on-Cash Return
5.8%
Cap rate
1.1%
Rent to Value Ratio
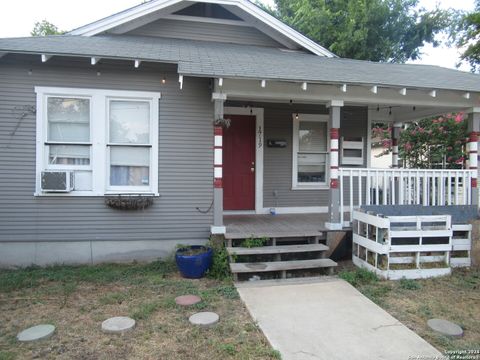
Active
$200,000
2
bds
|
1
ba
|
780
sqft
|
built
1945
1430 Vickers Ave, San Antonio, TX 78211
$-508
Cash flow
-13.3%
Cash-on-Cash Return
2.6%
Cap rate
0.5%
Rent to Value Ratio
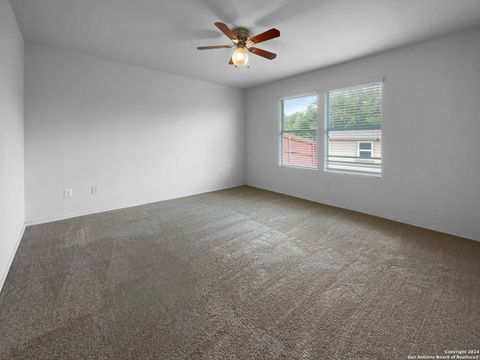
Active
$208,000
3
bds
|
2
ba
|
1,393
sqft
|
built
2012
9534 Lookover Bay, Converse, TX 78109
$-308
Cash flow
-7.7%
Cash-on-Cash Return
3.9%
Cap rate
0.8%
Rent to Value Ratio

Active
$479,900
3
bds
|
2
ba
|
2,010
sqft
|
built
1989
2415 Trace Oak, San Antonio, TX 78232
$-1,147
Cash flow
-12.5%
Cash-on-Cash Return
2.8%
Cap rate
0.6%
Rent to Value Ratio

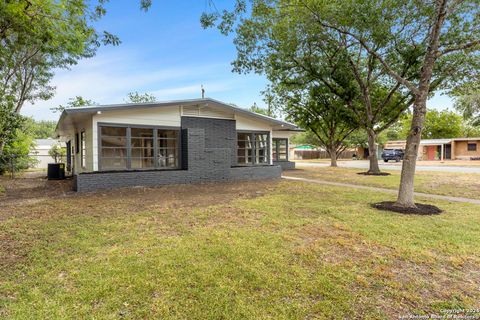
Active
$348,000
4
bds
|
0
ba
|
2,074
sqft
|
built
1950
905 Rittiman Rd, San Antonio, TX 78209
$-1,502
Cash flow
-22.5%
Cash-on-Cash Return
0.5%
Cap rate
0.3%
Rent to Value Ratio
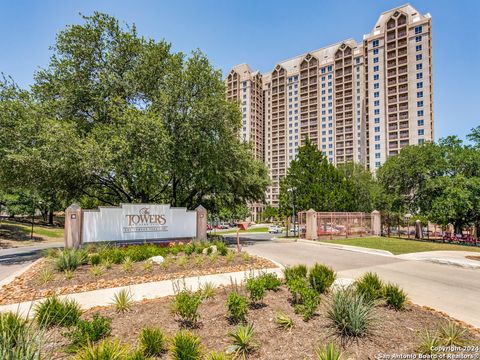
Active
$40,000
2
bds
|
2
ba
|
1,062
sqft
|
built
1988
1 Towers Park Ln, San Antonio, TX 78209
$-1,318
Cash flow
-38.4%
Cash-on-Cash Return
-39.5%
Cap rate
4.0%
Rent to Value Ratio
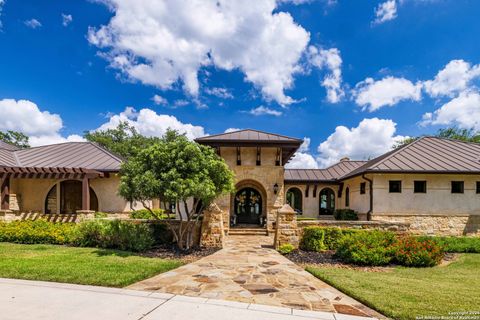
Active
$3,750,000
5
bds
|
7
ba
|
7,637
sqft
|
built
2009
14454 Santa Rita, Helotes, TX 78023
$-15,761
Cash flow
-21.9%
Cash-on-Cash Return
0.6%
Cap rate
0.2%
Rent to Value Ratio
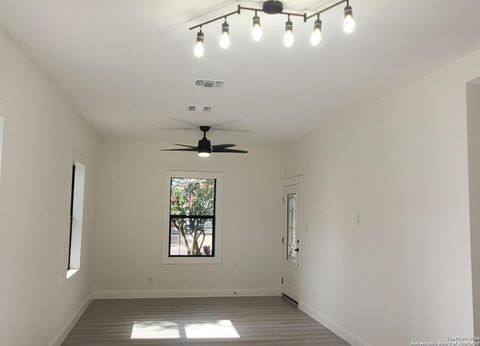
Active
$239,000
3
bds
|
2
ba
|
1,068
sqft
|
built
1919
226 W Sayers Ave, San Antonio, TX 78214
$-167
Cash flow
-3.6%
Cash-on-Cash Return
4.8%
Cap rate
0.8%
Rent to Value Ratio
Active
$580,000
3
bds
|
3
ba
|
2,770
sqft
|
built
1998
1707 Alpine Cir, San Antonio, TX 78248
$-1,318
Cash flow
-11.9%
Cash-on-Cash Return
3.0%
Cap rate
0.6%
Rent to Value Ratio
Active
$550,000
3
bds
|
2
ba
|
1,587
sqft
|
built
2022
28326 Bonn Mountain St, San Antonio, TX 78260
$-1,235
Cash flow
-11.7%
Cash-on-Cash Return
3.0%
Cap rate
0.5%
Rent to Value Ratio
Active
$485,000
4
bds
|
3
ba
|
2,945
sqft
|
built
2021
13107 Phaethon St, San Antonio, TX 78245
$-1,188
Cash flow
-12.8%
Cash-on-Cash Return
2.7%
Cap rate
0.6%
Rent to Value Ratio
Active
$249,900
3
bds
|
3
ba
|
1,494
sqft
|
built
1928
246 W High Ave, San Antonio, TX 78210
$-428
Cash flow
-8.9%
Cash-on-Cash Return
3.6%
Cap rate
0.8%
Rent to Value Ratio
Active
$329,900
4
bds
|
3
ba
|
2,323
sqft
|
built
2021
4618 Chalk Flts, San Antonio, TX 78253
$-797
Cash flow
-12.6%
Cash-on-Cash Return
2.8%
Cap rate
0.7%
Rent to Value Ratio
Active
$159,900
2
bds
|
1
ba
|
912
sqft
|
built
1935
1719 Hays St, San Antonio, TX 78202
$-278
Cash flow
-9.1%
Cash-on-Cash Return
3.6%
Cap rate
0.7%
Rent to Value Ratio
Active
$395,000
3
bds
|
2
ba
|
1,872
sqft
|
built
1953
539 Calumet Pl, San Antonio, TX 78209
$-648
Cash flow
-8.6%
Cash-on-Cash Return
3.7%
Cap rate
0.8%
Rent to Value Ratio
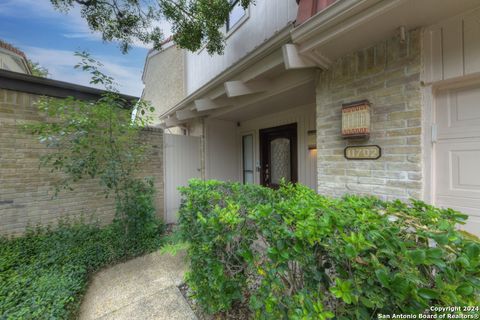
Active
$435,000
5
bds
|
5
ba
|
2,743
sqft
|
built
1978
11702 Pepper Tree St, San Antonio, TX 78230
$-967
Cash flow
-11.6%
Cash-on-Cash Return
3.0%
Cap rate
0.7%
Rent to Value Ratio

Active
$986,000
5
bds
|
5
ba
|
3,362
sqft
|
built
1988
19214 Autumn Gdn, San Antonio, TX 78258
$-3,181
Cash flow
-16.8%
Cash-on-Cash Return
1.8%
Cap rate
0.5%
Rent to Value Ratio

Active
$618,500
4
bds
|
3
ba
|
3,010
sqft
|
built
2003
614 Cypress Trl, San Antonio, TX 78256
$-1,433
Cash flow
-12.1%
Cash-on-Cash Return
2.9%
Cap rate
0.6%
Rent to Value Ratio
Active
$175,000
2
bds
|
2
ba
|
912
sqft
|
built
1940
410 Mc Kay Ave, San Antonio, TX 78204
$-20
Cash flow
-0.6%
Cash-on-Cash Return
5.5%
Cap rate
1.0%
Rent to Value Ratio

Active
$291,500
3
bds
|
2
ba
|
1,561
sqft
|
built
2021
9334 Nubuck Br, Converse, TX 78109
$-786
Cash flow
-14.1%
Cash-on-Cash Return
2.4%
Cap rate
0.6%
Rent to Value Ratio
Active
$152,900
1
bds
|
1
ba
|
849
sqft
|
built
1984
11839 Parliament St, San Antonio, TX 78216
$-452
Cash flow
-15.4%
Cash-on-Cash Return
2.1%
Cap rate
0.9%
Rent to Value Ratio
Active
$465,000
4
bds
|
2
ba
|
3,002
sqft
|
built
2012
8139 Mystic Chase, Boerne, TX 78015
$-476
Cash flow
-5.3%
Cash-on-Cash Return
4.5%
Cap rate
0.7%
Rent to Value Ratio
Active
$465,000
4
bds
|
2
ba
|
1,914
sqft
|
built
1910
1613 N Olive St, San Antonio, TX 78208
$-216
Cash flow
-2.4%
Cash-on-Cash Return
5.1%
Cap rate
0.8%
Rent to Value Ratio

Active
$169,000
2
bds
|
2
ba
|
1,195
sqft
|
built
1977
2935 Nacogdoches Rd, San Antonio, TX 78217
$-518
Cash flow
-16.0%
Cash-on-Cash Return
2.0%
Cap rate
0.8%
Rent to Value Ratio
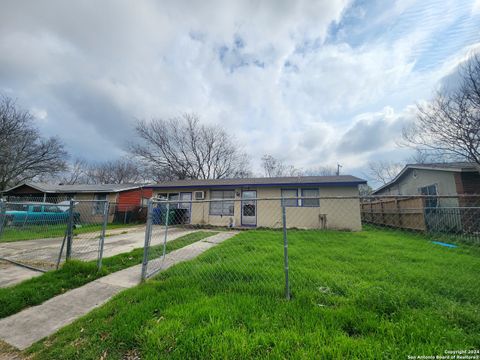
Active
$99,000
4
bds
|
2
ba
|
1,157
sqft
|
built
1967
438 Park Plz, San Antonio, TX 78237
$160
Cash flow
8.4%
Cash-on-Cash Return
7.6%
Cap rate
1.2%
Rent to Value Ratio

Active
$4,250,000
5
bds
|
7
ba
|
7,490
sqft
|
built
2004
209 Terrell Rd, Terrell Hills, TX 78209
$-20,332
Cash flow
-25.0%
Cash-on-Cash Return
-0.1%
Cap rate
0.2%
Rent to Value Ratio
Active
$535,000
4
bds
|
3
ba
|
3,015
sqft
|
built
1984
8118 New Dawn, San Antonio, TX 78250
$-1,188
Cash flow
-11.6%
Cash-on-Cash Return
3.0%
Cap rate
0.6%
Rent to Value Ratio

Active
$360,000
4
bds
|
3
ba
|
2,450
sqft
|
built
2021
5001 Drovers Path, Saint Hedwig, TX 78152
$-711
Cash flow
-10.3%
Cash-on-Cash Return
3.3%
Cap rate
0.6%
Rent to Value Ratio
Active
$115,000
2
bds
|
1
ba
|
1,084
sqft
|
built
1972
4114 Mc Innis Rd, San Antonio, TX 78222
$97
Cash flow
4.4%
Cash-on-Cash Return
6.7%
Cap rate
1.1%
Rent to Value Ratio
Active
$272,000
3
bds
|
3
ba
|
1,836
sqft
|
built
2021
519 Wild Olive Way, San Antonio, TX 78219
$-643
Cash flow
-12.3%
Cash-on-Cash Return
2.8%
Cap rate
0.7%
Rent to Value Ratio
Active
$155,000
3
bds
|
1
ba
|
1,232
sqft
|
built
1954
2717 Ceralvo St, San Antonio, TX 78237
$-46
Cash flow
-1.5%
Cash-on-Cash Return
5.3%
Cap rate
0.9%
Rent to Value Ratio
Active
$335,000
4
bds
|
3
ba
|
2,897
sqft
|
built
2006
11006 Funny Cide, San Antonio, TX 78245
$-264
Cash flow
-4.1%
Cash-on-Cash Return
4.7%
Cap rate
0.7%
Rent to Value Ratio

Active
$230,000
4
bds
|
3
ba
|
1,443
sqft
|
built
1986
9302 Village Lance, San Antonio, TX 78250
$-481
Cash flow
-10.9%
Cash-on-Cash Return
3.2%
Cap rate
0.7%
Rent to Value Ratio
Active
$490,000
2
bds
|
3
ba
|
1,372
sqft
|
built
1937
261 E Rosewood Ave, San Antonio, TX 78212
$-1,642
Cash flow
-17.5%
Cash-on-Cash Return
1.7%
Cap rate
0.4%
Rent to Value Ratio

Active
$380,000
2
bds
|
1
ba
|
1,060
sqft
|
built
1924
511 Devine St, San Antonio, TX 78210
$-1,083
Cash flow
-14.9%
Cash-on-Cash Return
2.3%
Cap rate
0.5%
Rent to Value Ratio
Active
$299,000
3
bds
|
2
ba
|
1,417
sqft
|
built
1941
1743 W Huisache Ave, San Antonio, TX 78201
$-752
Cash flow
-13.1%
Cash-on-Cash Return
2.7%
Cap rate
0.6%
Rent to Value Ratio
Active
$460,000
3
bds
|
3
ba
|
3,617
sqft
|
built
1942
323 E Lambert St, San Antonio, TX 78204
$-608
Cash flow
-6.9%
Cash-on-Cash Return
4.1%
Cap rate
0.8%
Rent to Value Ratio