Galveston County Investment Properties for Sale
Browse homes for sale and investment properties in Galveston County. Refine your search by price, property type, or more.
Best cash flowing properties in Galveston County
Active
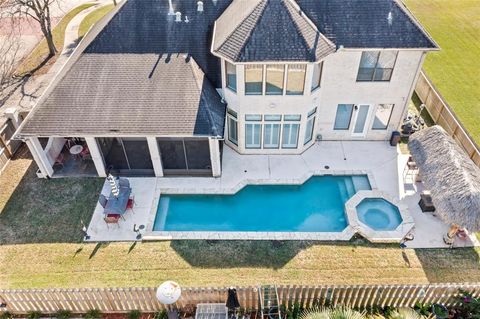
$645,000
4
bds
|
4
ba
|
3,427
sqft
|
built
2004
2308 Vega Ct, League City, TX 77573
$425
Cash flow
3.4%
Cash-on-Cash Return
6.5%
Cap rate
0.8%
Rent to Value Ratio
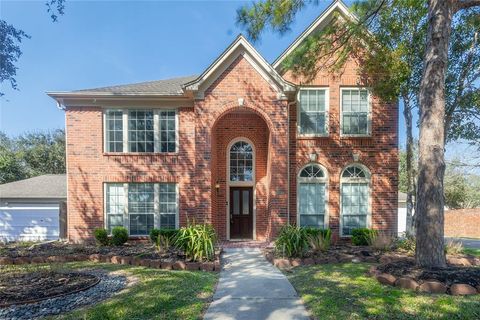
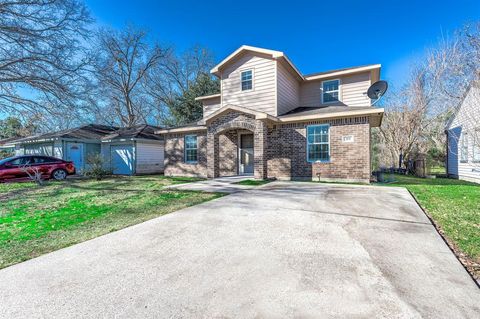
Active
$350,000
4
bds
|
3
ba
|
3,196
sqft
|
built
1993
2201 Summer Reef Dr, League City, TX 77573
$415
Cash flow
6.2%
Cash-on-Cash Return
7.1%
Cap rate
0.9%
Rent to Value Ratio
1,739 out of 2,071 properties for sale in Galveston County
Limited Results Shown
Create a free account, or log in to reveal all property listings and enjoy the complete experience.
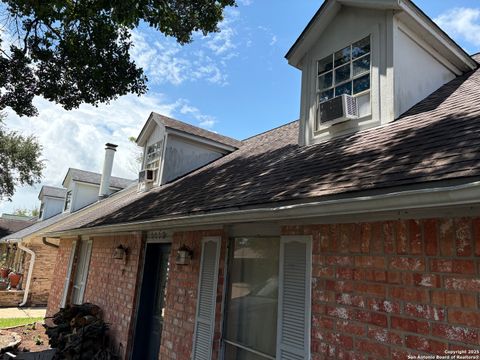
Active
$159,000
4
bds
|
2
ba
|
1,755
sqft
|
built
1977
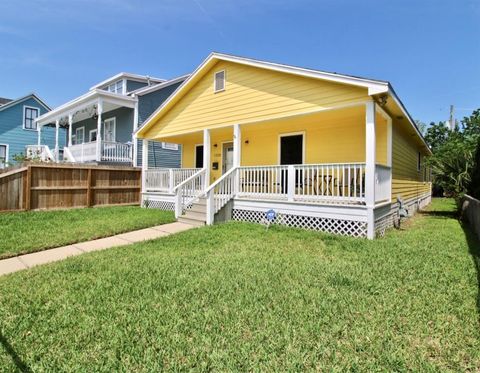
1118 Bacliff Dr, Bacliff, TX 77518
$116
Cash flow
3.8%
Cash-on-Cash Return
6.6%
Cap rate
1.1%
Rent to Value Ratio
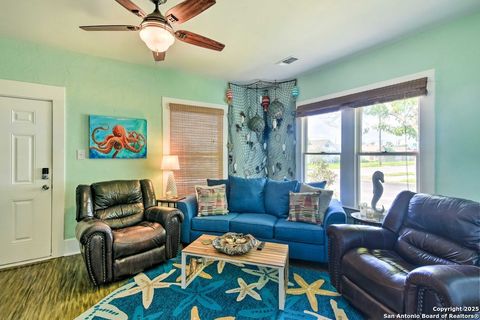
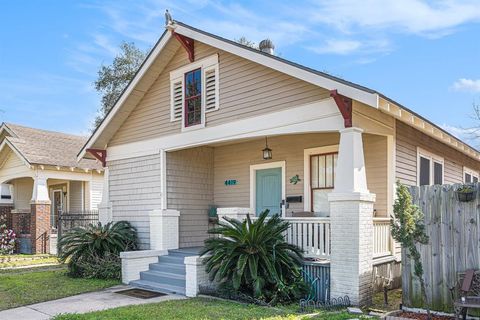
Active
$299,990
3
bds
|
1
ba
|
1,038
sqft
|
built
1948
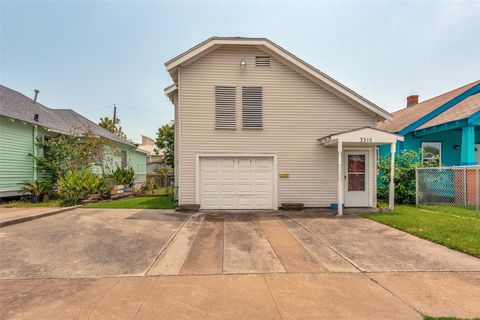
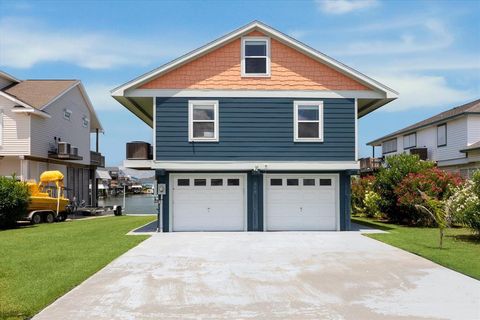
3928 Avenue S, Galveston, TX 77550
$-407
Cash flow
-7.1%
Cash-on-Cash Return
4.1%
Cap rate
0.7%
Rent to Value Ratio
Active
$199,999
3
bds
|
3
ba
|
1,470
sqft
|
built
2011
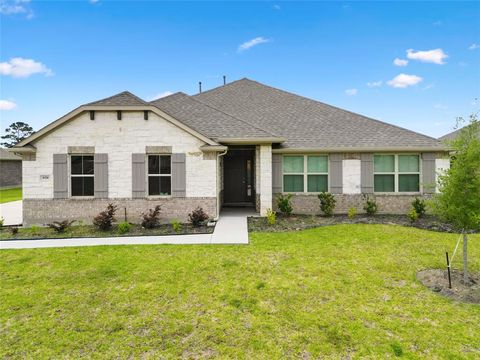
315 N Fulton St, Texas City, TX 77591
$296
Cash flow
7.7%
Cash-on-Cash Return
7.5%
Cap rate
0.9%
Rent to Value Ratio
Active
$325,000
2
bds
|
1
ba
|
1,042
sqft
|
built
1965
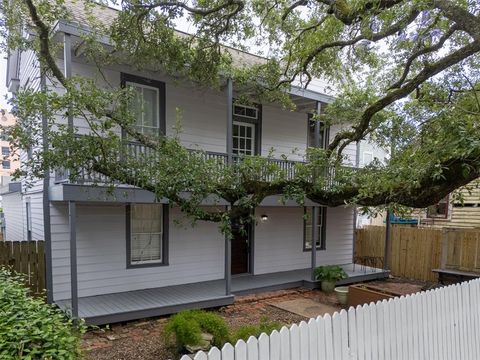
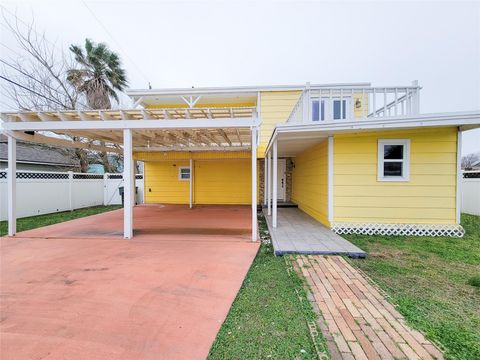
4419 Avenue Q 1/2, Galveston, TX 77550
$-655
Cash flow
-10.5%
Cash-on-Cash Return
3.3%
Cap rate
0.6%
Rent to Value Ratio
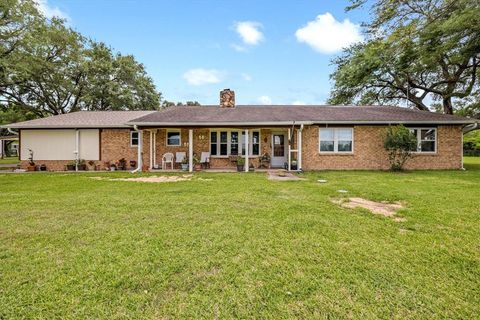
Active
$732,000
4
bds
|
4
ba
|
3,177
sqft
|
built
1983
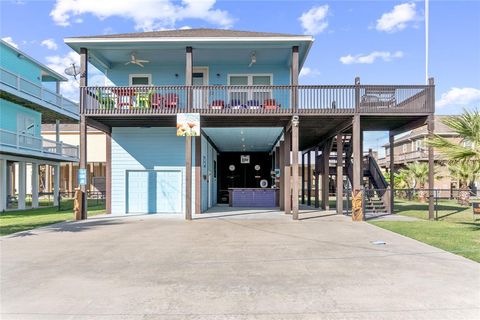
6825 Highland Rd, Santa Fe, TX 77517
$-1,874
Cash flow
-13.4%
Cash-on-Cash Return
2.6%
Cap rate
0.5%
Rent to Value Ratio

Active
$399,900
2
bds
|
2
ba
|
1,097
sqft
|
built
1955
1308 Avenue M 1/2, Galveston, TX 77550
$-670
Cash flow
-8.7%
Cash-on-Cash Return
3.7%
Cap rate
0.6%
Rent to Value Ratio

Active
$549,500
3
bds
|
2
ba
|
1,515
sqft
|
built
2022
23007 Fresca St, Galveston, TX 77554
$-549
Cash flow
-5.2%
Cash-on-Cash Return
4.5%
Cap rate
0.6%
Rent to Value Ratio
Active
$418,000
3
bds
|
3
ba
|
1,012
sqft
|
built
1975
16507 Nassau Way, Jamaica Beach, TX 77554
$-802
Cash flow
-10.0%
Cash-on-Cash Return
3.4%
Cap rate
0.6%
Rent to Value Ratio
Active
$375,000
2
bds
|
2
ba
|
1,190
sqft
|
built
1955
1105 Avenue L, Galveston, TX 77550
$-940
Cash flow
-13.1%
Cash-on-Cash Return
2.7%
Cap rate
0.5%
Rent to Value Ratio
Active
$145,900
1
bds
|
1
ba
|
521
sqft
|
built
1985
9520 Seawall Blvd, Galveston, TX 77554
$-690
Cash flow
-24.7%
Cash-on-Cash Return
n/a
Cap rate
1.1%
Rent to Value Ratio
Active
$995,000
4
bds
|
2
ba
|
1,741
sqft
|
built
1983
4227 Ghost Crab Ln, Galveston, TX 77554
$-2,897
Cash flow
-15.2%
Cash-on-Cash Return
2.2%
Cap rate
0.4%
Rent to Value Ratio
Active
$369,000
2
bds
|
1
ba
|
1,372
sqft
|
built
1955
1611 Avenue N 1/2, Galveston, TX 77550
$-911
Cash flow
-12.9%
Cash-on-Cash Return
2.7%
Cap rate
0.5%
Rent to Value Ratio
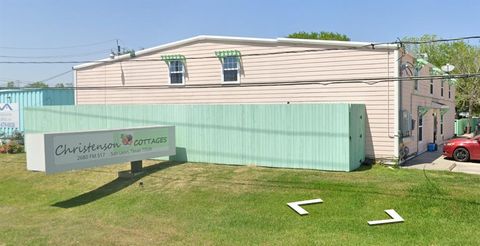
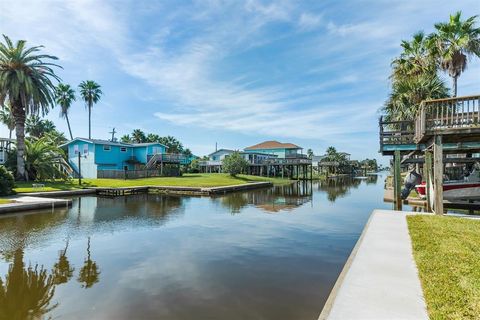
Active
$670,000
bds
|
0
ba
|
6,840
sqft
|
built
2011
2680 Avenue J, San Leon, TX 77539
$-1,929
Cash flow
-15.0%
Cash-on-Cash Return
2.2%
Cap rate
0.3%
Rent to Value Ratio
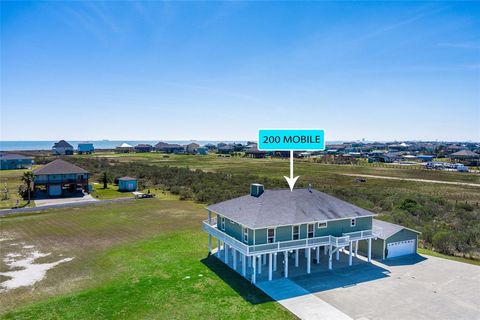
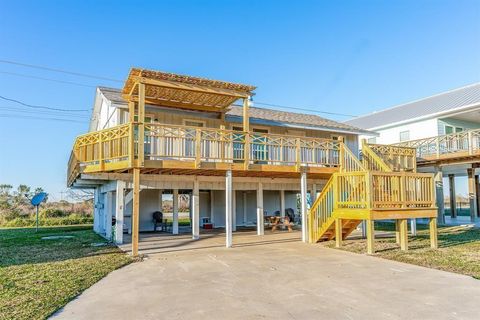
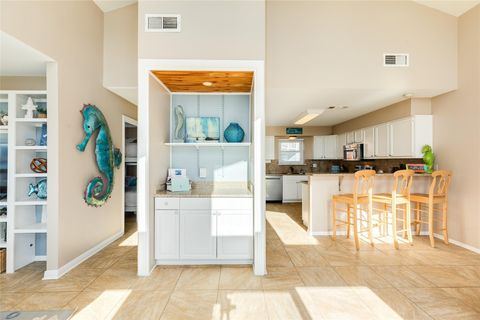
Active
$550,000
4
bds
|
4
ba
|
2,088
sqft
|
built
2003
200 Mobile, Crystal Beach, TX 77650
$-951
Cash flow
-9.0%
Cash-on-Cash Return
3.6%
Cap rate
0.6%
Rent to Value Ratio
Active
$350,000
3
bds
|
2
ba
|
1,200
sqft
|
built
1993
3619 Barracuda, Crystal Beach, TX 77650
$-621
Cash flow
-9.3%
Cash-on-Cash Return
3.5%
Cap rate
0.4%
Rent to Value Ratio
Active
$509,000
2
bds
|
2
ba
|
1,120
sqft
|
built
1990
4406 Tampico Way, Galveston, TX 77554
$-1,146
Cash flow
-11.7%
Cash-on-Cash Return
3.0%
Cap rate
0.6%
Rent to Value Ratio
Active
$1,599,000
4
bds
|
4
ba
|
2,800
sqft
|
built
2003
21011 W Sand Hill Dr, Galveston, TX 77554
$-4,355
Cash flow
-14.2%
Cash-on-Cash Return
2.4%
Cap rate
0.5%
Rent to Value Ratio
Active
$435,000
3
bds
|
3
ba
|
1,692
sqft
|
built
2004
3101 Diane, Crystal Beach, TX 77650
$-610
Cash flow
-7.3%
Cash-on-Cash Return
4.0%
Cap rate
0.6%
Rent to Value Ratio
Active
$160,000
1
bds
|
1
ba
|
474
sqft
|
built
1980
6300 Seawall Blvd, Galveston, TX 77551
$-561
Cash flow
-18.3%
Cash-on-Cash Return
1.5%
Cap rate
0.9%
Rent to Value Ratio
Active
$599,000
3
bds
|
3
ba
|
3,194
sqft
|
built
1992
123 Port St, San Leon, TX 77539
$-673
Cash flow
-5.9%
Cash-on-Cash Return
4.3%
Cap rate
0.8%
Rent to Value Ratio
Active
$250,000
3
bds
|
2
ba
|
1,557
sqft
|
built
2007
6733 Hidden Colony Ln, Dickinson, TX 77539
$-497
Cash flow
-10.4%
Cash-on-Cash Return
3.3%
Cap rate
0.8%
Rent to Value Ratio
Active
$1,199,500
4
bds
|
3
ba
|
3,077
sqft
|
built
2000
1207 N Shore Dr, Clear Lake Shores, TX 77565
$-3,049
Cash flow
-13.3%
Cash-on-Cash Return
2.6%
Cap rate
0.5%
Rent to Value Ratio
Active
$232,000
3
bds
|
2
ba
|
1,727
sqft
|
built
2004
7918 Leaning Oak Dr, Texas City, TX 77591
$-188
Cash flow
-4.2%
Cash-on-Cash Return
4.7%
Cap rate
0.9%
Rent to Value Ratio
Active
$528,000
4
bds
|
4
ba
|
3,782
sqft
|
built
2004
2944 Port Rose Ln, League City, TX 77573
$-720
Cash flow
-7.1%
Cash-on-Cash Return
4.0%
Cap rate
0.8%
Rent to Value Ratio
Active
$314,900
3
bds
|
1
ba
|
1,304
sqft
|
built
1960
3515 Avenue S, Galveston, TX 77550
$-661
Cash flow
-11.0%
Cash-on-Cash Return
3.2%
Cap rate
0.6%
Rent to Value Ratio
Active
$449,000
3
bds
|
2
ba
|
1,240
sqft
|
built
2016
1844 Pompano Ln, Crystal Beach, TX 77650
$-878
Cash flow
-10.2%
Cash-on-Cash Return
3.3%
Cap rate
0.6%
Rent to Value Ratio
Active
$395,000
4
bds
|
3
ba
|
2,315
sqft
|
built
2023
4320 Leslies Way, Dickinson, TX 77539
$-734
Cash flow
-9.7%
Cash-on-Cash Return
3.4%
Cap rate
0.7%
Rent to Value Ratio
Active
$447,000
4
bds
|
3
ba
|
2,044
sqft
|
built
1901
2023 Avenue O 1/2, Galveston, TX 77550
$-1,007
Cash flow
-11.8%
Cash-on-Cash Return
3.0%
Cap rate
0.5%
Rent to Value Ratio
Active
$425,000
3
bds
|
2
ba
|
1,560
sqft
|
built
1904
1624 Avenue N 1/2, Galveston, TX 77550
$-693
Cash flow
-8.5%
Cash-on-Cash Return
3.7%
Cap rate
0.7%
Rent to Value Ratio
Active
$699,999
4
bds
|
4
ba
|
2,051
sqft
|
built
2011
2774 Gulfview Ln, Crystal Beach, TX 77650
$-1,380
Cash flow
-10.3%
Cash-on-Cash Return
3.3%
Cap rate
0.6%
Rent to Value Ratio
Active
$499,900
4
bds
|
3
ba
|
1,566
sqft
|
built
2023
991 Seadrift Dr, Port Bolivar, TX 77650
$-745
Cash flow
-7.8%
Cash-on-Cash Return
3.9%
Cap rate
0.6%
Rent to Value Ratio
Active
$829,900
3
bds
|
3
ba
|
2,136
sqft
|
built
1997
3802 Tidewater Dr, Galveston, TX 77554
$-1,676
Cash flow
-10.5%
Cash-on-Cash Return
3.3%
Cap rate
0.6%
Rent to Value Ratio

Active
$145,000
1
bds
|
1
ba
|
462
sqft
|
built
1985
6102 Seawall Blvd, Galveston, TX 77551
$-610
Cash flow
-21.9%
Cash-on-Cash Return
0.6%
Cap rate
0.8%
Rent to Value Ratio
Active
$459,000
4
bds
|
2
ba
|
1,680
sqft
|
built
1999
1320 Avenue L, Galveston, TX 77550
$-1,106
Cash flow
-12.6%
Cash-on-Cash Return
2.8%
Cap rate
0.5%
Rent to Value Ratio

Active
$599,000
2
bds
|
2
ba
|
1,174
sqft
|
built
1977
12906 Bermuda Beach Dr, Galveston, TX 77554
$-1,640
Cash flow
-14.3%
Cash-on-Cash Return
2.4%
Cap rate
0.5%
Rent to Value Ratio
Active
$844,484
5
bds
|
3
ba
|
1,802
sqft
|
built
1974
219 Bora Bora Dr, Galveston, TX 77554
$-3,046
Cash flow
-18.8%
Cash-on-Cash Return
1.3%
Cap rate
0.4%
Rent to Value Ratio
Active
$285,000
3
bds
|
2
ba
|
1,727
sqft
|
built
1947
5703 Fraser Ave, Galveston, TX 77551
$-95
Cash flow
-1.7%
Cash-on-Cash Return
5.3%
Cap rate
0.8%
Rent to Value Ratio
Active
$399,900
2
bds
|
2
ba
|
1,160
sqft
|
built
2018
984 Crane Ln, Crystal Beach, TX 77650
$-821
Cash flow
-10.7%
Cash-on-Cash Return
3.2%
Cap rate
0.6%
Rent to Value Ratio