Galveston County Investment Properties for Sale
Browse homes for sale and investment properties in Galveston County. Refine your search by price, property type, or more.
Best cash flowing properties in Galveston County

Active
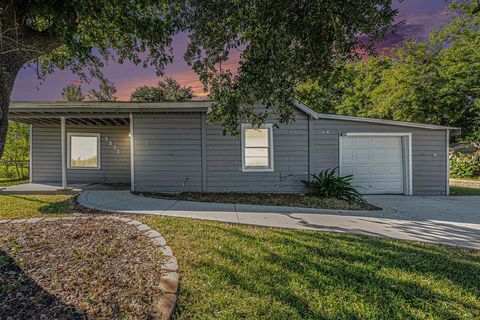
$145,000
3
bds
|
0
ba
|
1,210
sqft
|
built
1974
3417 Cherry Ave, Texas City, TX 77590
$157
Cash flow
5.6%
Cash-on-Cash Return
7.6%
Cap rate
1.1%
Rent to Value Ratio
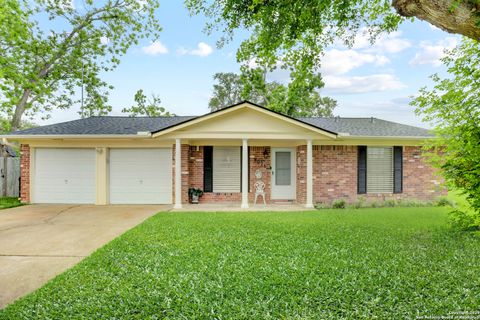
Active
$140,000
3
bds
|
0
ba
|
1,256
sqft
|
built
1955
3303 1st Ave N, Texas City, TX 77590
$147
Cash flow
5.5%
Cash-on-Cash Return
7.5%
Cap rate
1.3%
Rent to Value Ratio
2,779 out of 3,341 properties for sale in Galveston County
Limited Results Shown
Create a free account, or log in to reveal all property listings and enjoy the complete experience.
Active
$299,000
3
bds
|
2
ba
|
1,625
sqft
|
built
1975
8026 Leigh Rd, Hitchcock, TX 77563
$-571
Cash flow
-10.0%
Cash-on-Cash Return
4.0%
Cap rate
0.6%
Rent to Value Ratio

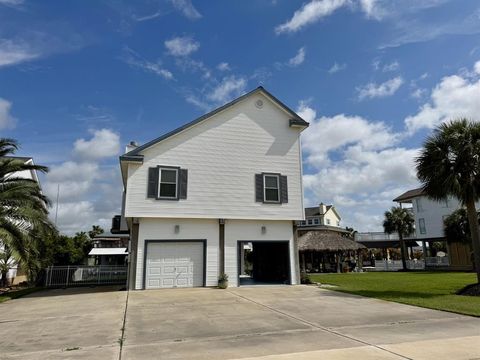
Active
$999,999
3
bds
|
0
ba
|
2,701
sqft
|
built
1979
69 Harbor Ln, Kemah, TX 77565
$-1,901
Cash flow
-9.9%
Cash-on-Cash Return
4.0%
Cap rate
0.6%
Rent to Value Ratio
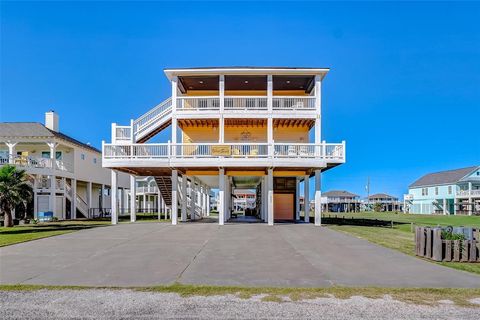
Active
$1,170,000
3
bds
|
0
ba
|
1,998
sqft
|
built
1994
1314 Hawaii Dr, Tiki Island, TX 77554
$-5,000
Cash flow
-22.3%
Cash-on-Cash Return
1.1%
Cap rate
0.3%
Rent to Value Ratio

Active
$299,900
3
bds
|
0
ba
|
1,832
sqft
|
built
1988
4021 Fatta Dr, Dickinson, TX 77539
$-224
Cash flow
-3.9%
Cash-on-Cash Return
5.4%
Cap rate
0.8%
Rent to Value Ratio
Active
$145,000
3
bds
|
0
ba
|
1,210
sqft
|
built
1974
3417 Cherry Ave, Texas City, TX 77590
$157
Cash flow
5.6%
Cash-on-Cash Return
7.6%
Cap rate
1.1%
Rent to Value Ratio

Active
$595,000
3
bds
|
0
ba
|
1,632
sqft
|
built
2014
2836 Gulfview Ln, Crystal Beach, TX 77650
$-1,373
Cash flow
-12.0%
Cash-on-Cash Return
3.5%
Cap rate
0.6%
Rent to Value Ratio
Active
$140,000
3
bds
|
0
ba
|
1,256
sqft
|
built
1955
3303 1st Ave N, Texas City, TX 77590
$147
Cash flow
5.5%
Cash-on-Cash Return
7.5%
Cap rate
1.3%
Rent to Value Ratio
Active
$948,000
5
bds
|
0
ba
|
2,712
sqft
|
built
2014
2383 Sand Drift Ln, Crystal Beach, TX 77650
$-1,784
Cash flow
-9.8%
Cash-on-Cash Return
4.0%
Cap rate
0.6%
Rent to Value Ratio
Active
$895,000
4
bds
|
0
ba
|
2,097
sqft
|
built
2020
945 Gulfview Dr, Crystal Beach, TX 77650
$-2,251
Cash flow
-13.1%
Cash-on-Cash Return
3.2%
Cap rate
0.5%
Rent to Value Ratio
Active
$529,900
4
bds
|
0
ba
|
1,700
sqft
|
built
2010
2932 Lakeside Dr, Crystal Beach, TX 77650
$-1,354
Cash flow
-13.3%
Cash-on-Cash Return
3.2%
Cap rate
0.6%
Rent to Value Ratio

Active
$1,125,000
4
bds
|
0
ba
|
2,345
sqft
|
built
2015
4214 Spanish Main, Jamaica Beach, TX 77554
$-3,172
Cash flow
-14.7%
Cash-on-Cash Return
2.9%
Cap rate
0.5%
Rent to Value Ratio
Active
$499,000
4
bds
|
0
ba
|
1,758
sqft
|
built
2004
3216 Castle Dr, Crystal Beach, TX 77650
$-969
Cash flow
-10.1%
Cash-on-Cash Return
3.9%
Cap rate
0.6%
Rent to Value Ratio
Active
$450,000
3
bds
|
0
ba
|
1,280
sqft
|
built
2014
2307 Martinique, Crystal Beach, TX 77650
$-1,133
Cash flow
-13.1%
Cash-on-Cash Return
3.2%
Cap rate
0.6%
Rent to Value Ratio

Active
$439,900
3
bds
|
0
ba
|
2,368
sqft
|
built
2017
607 29th St, Dickinson, TX 77539
$-978
Cash flow
-11.6%
Cash-on-Cash Return
3.6%
Cap rate
0.6%
Rent to Value Ratio
Active
$499,900
4
bds
|
0
ba
|
2,120
sqft
|
built
2018
2507 Rosa Rita Dr, League City, TX 77573
$-1,279
Cash flow
-13.3%
Cash-on-Cash Return
3.2%
Cap rate
0.6%
Rent to Value Ratio
Active
$130,000
3
bds
|
0
ba
|
1,504
sqft
|
built
1971
612 Honeysuckle Dr, La Marque, TX 77568
$114
Cash flow
4.6%
Cash-on-Cash Return
7.3%
Cap rate
1.2%
Rent to Value Ratio
Active
$200,000
3
bds
|
0
ba
|
1,574
sqft
|
built
1965
2906 Katherine St, La Marque, TX 77568
$-97
Cash flow
-2.5%
Cash-on-Cash Return
5.7%
Cap rate
0.9%
Rent to Value Ratio
Active
$464,900
4
bds
|
0
ba
|
3,088
sqft
|
built
2006
2501 Clover Rdg, League City, TX 77573
$-918
Cash flow
-10.3%
Cash-on-Cash Return
3.9%
Cap rate
0.7%
Rent to Value Ratio

Active
$454,000
4
bds
|
0
ba
|
3,030
sqft
|
built
2012
2865 Milano Ln, League City, TX 77573
$-1,150
Cash flow
-13.2%
Cash-on-Cash Return
3.2%
Cap rate
0.6%
Rent to Value Ratio
Active
$215,000
4
bds
|
0
ba
|
1,416
sqft
|
built
2019
608 38th St, Galveston, TX 77550
$34
Cash flow
0.8%
Cash-on-Cash Return
6.5%
Cap rate
1.1%
Rent to Value Ratio
Active
$149,500
1
bds
|
0
ba
|
620
sqft
|
built
1965
402 Post Office St, Galveston, TX 77550
$-404
Cash flow
-14.1%
Cash-on-Cash Return
3.0%
Cap rate
0.9%
Rent to Value Ratio

Active
$892,400
4
bds
|
0
ba
|
2,420
sqft
|
built
2000
422 Windward Way, Tiki Island, TX 77554
$-3,013
Cash flow
-17.6%
Cash-on-Cash Return
2.2%
Cap rate
0.5%
Rent to Value Ratio
Active
$699,995
4
bds
|
0
ba
|
2,006
sqft
|
built
2019
23111 Marina, Galveston, TX 77554
$-1,767
Cash flow
-13.2%
Cash-on-Cash Return
3.2%
Cap rate
0.6%
Rent to Value Ratio
Active
$139,995
1
bds
|
0
ba
|
480
sqft
|
built
1980
6300 Seawall Blvd, Galveston, TX 77551
$-559
Cash flow
-20.8%
Cash-on-Cash Return
1.5%
Cap rate
0.9%
Rent to Value Ratio

Active
$875,000
3
bds
|
0
ba
|
2,240
sqft
|
built
2008
20919 W Sunset Bay Dr, Galveston, TX 77554
$-928
Cash flow
-5.5%
Cash-on-Cash Return
5.0%
Cap rate
0.6%
Rent to Value Ratio

Active
$400,000
2
bds
|
0
ba
|
864
sqft
|
built
1984
1160 N Redfish St, Crystal Beach, TX 77650
$-1,266
Cash flow
-16.5%
Cash-on-Cash Return
2.5%
Cap rate
0.4%
Rent to Value Ratio

Active
$317,500
1
bds
|
0
ba
|
612
sqft
|
built
2010
979 Sea Spray Dr, Crystal Beach, TX 77650
$-860
Cash flow
-14.1%
Cash-on-Cash Return
3.0%
Cap rate
0.5%
Rent to Value Ratio
Active
$620,000
2
bds
|
0
ba
|
1,167
sqft
|
built
2009
10327 Termini San Luis Pass Rd, Galveston, TX 77554
$-3,966
Cash flow
-33.4%
Cash-on-Cash Return
-1.4%
Cap rate
0.5%
Rent to Value Ratio
Active
$369,000
2
bds
|
0
ba
|
875
sqft
|
built
1980
7310 Seawall Blvd, Galveston, TX 77551
$-1,740
Cash flow
-24.6%
Cash-on-Cash Return
0.6%
Cap rate
0.5%
Rent to Value Ratio
Active
$398,900
2
bds
|
0
ba
|
1,416
sqft
|
built
1992
117 Verdia Dr, Crystal Beach, TX 77650
$-1,125
Cash flow
-14.7%
Cash-on-Cash Return
2.9%
Cap rate
0.6%
Rent to Value Ratio
Active
$547,900
3
bds
|
0
ba
|
1,604
sqft
|
built
1898
1611 19th St, Galveston, TX 77550
$-1,567
Cash flow
-14.9%
Cash-on-Cash Return
2.8%
Cap rate
0.5%
Rent to Value Ratio
Active
$452,000
2
bds
|
0
ba
|
1,152
sqft
|
built
1916
912 Sealy St, Galveston, TX 77550
$-1,548
Cash flow
-17.9%
Cash-on-Cash Return
2.2%
Cap rate
0.5%
Rent to Value Ratio

Active
$279,000
2
bds
|
0
ba
|
1,057
sqft
|
built
1953
1813 29th St, Galveston, TX 77550
$-597
Cash flow
-11.2%
Cash-on-Cash Return
3.7%
Cap rate
0.6%
Rent to Value Ratio

Active
$224,999
4
bds
|
0
ba
|
1,733
sqft
|
built
1953
2013 15th Ave N, Texas City, TX 77590
$-120
Cash flow
-2.8%
Cash-on-Cash Return
5.6%
Cap rate
0.9%
Rent to Value Ratio

Active
$2,800,000
3
bds
|
0
ba
|
4,993
sqft
|
built
1999
4210 Rum Bay, Galveston, TX 77554
$-14,185
Cash flow
-26.4%
Cash-on-Cash Return
0.2%
Cap rate
0.2%
Rent to Value Ratio
Active
$399,000
4
bds
|
0
ba
|
3,196
sqft
|
built
1993
2201 Summer Reef Dr, League City, TX 77573
$-12
Cash flow
-0.2%
Cash-on-Cash Return
6.2%
Cap rate
0.8%
Rent to Value Ratio

Active
$270,000
4
bds
|
0
ba
|
1,000
sqft
|
built
2020
3717 Church St, Galveston, TX 77550
$-458
Cash flow
-8.9%
Cash-on-Cash Return
4.2%
Cap rate
0.7%
Rent to Value Ratio

Active
$389,000
3
bds
|
0
ba
|
2,071
sqft
|
built
2011
4050 Palmetto Ct, Dickinson, TX 77539
$-942
Cash flow
-12.6%
Cash-on-Cash Return
3.4%
Cap rate
0.7%
Rent to Value Ratio

Active
$315,000
2
bds
|
0
ba
|
624
sqft
|
built
2021
3515 Avenue S, Galveston, TX 77550
$-713
Cash flow
-11.8%
Cash-on-Cash Return
3.6%
Cap rate
0.6%
Rent to Value Ratio

Active
$665,000
4
bds
|
0
ba
|
3,373
sqft
|
built
1857
1309 Broadway St, Galveston, TX 77550
$-22
Cash flow
-0.2%
Cash-on-Cash Return
6.2%
Cap rate
0.8%
Rent to Value Ratio